


Abstract
Hospitalizations often occur multiple times during the disease course of a heart failure (HF) patient. However, repeated hospitalizations have not been explored in a fulsome way in this setting. We investigated the association between patient factors and the risk of hospitalization among patients with HF using an extension of the Cox model for the analysis of recurrent events.
We examined hospitalizations and predictors of readmission among newly discharged patients with HF in the Enhanced Feedback For Effective Cardiac Treatment phase 1 (April 1999–March 2001) study with the Prentice–Williams–Peterson model with total time. Of 8948 individuals discharged alive from hospital, 7562 (84.5%) were hospitalized at least once during 15-year follow-up. More than 31 000 hospitalizations were observed. There was a progressive shortening of the interval length between hospitalization episodes. An increasing number of comorbidities (average 2.3 per patient) was associated to an increasing hazard of being readmitted to hospital. Most patient factors associated with the risk of hospitalization have been previously described in the literature. However, the estimates were smaller in comparison to a traditional analysis based on the Cox model.
The importance of patient factors for the risk of being admitted to hospital was variable over the course of the disease. Conditions such as diabetes and chronic pulmonary obstructive disease had a sustained association with the rate of hospitalization across all episodes examined. The analysis of recurrent events can explore the longitudinal aspect of HF and the critical issue of hospitalizations in this population.
Introduction
The use of guideline-directed medical therapy has reduced mortality among patients with heart failure (HF). As a consequence, HF is now a common condition associated with high morbidity.1 Patients with HF frequently decompensate, leading to multiple hospital admissions during the course of the disease.2 After a diagnosis of HF, it is estimated that two thirds of all patients will experience two or more hospitalizations and almost half will experience 4 or more hospitalizations during their lifetime.3 Based on the current natural history of HF, it would be reasonable from an analytical perspective to examine hospitalizations as an event capable of temporal repetition.4
Yet, the analysis of hospitalizations in HF research has typically relied on the Cox proportional hazard (PH) model. The Cox PH model, which has become synonymous with regression in survival analysis, was developed for the analysis of a single time-to-event per study participant.5 In the Cox PH model, even when patients experience a non-terminal event, such as hospitalization, they are no longer considered at risk for additional events and any information beyond that point is ignored. Analysing a non-terminal event as a first event offers an incomplete picture of the hospitalization process in patients with HF. When considering the longitudinal aspect of HF, more hospital admissions can occur beyond the first in the same patient over time.
Repeated hospitalizations occurring over a HF patient’s life span have not been explored in a fulsome way in HF research. An analysis of all hospitalizations including the first and subsequent events might provide new insights about the hospitalization process in patients with HF that a standard analysis may not. Extensions of the Cox PH model that can account for repeated events over time have been proposed,6 but they have been infrequently adopted in HF research.7 In this study, we investigated hospitalizations in patients with HF using a regression model for the analysis of repeated hospitalizations. Our objective was to examine the association between patient-level factors on subsequent hospitalization risk when considering the full course of the disease.
Methods
Study cohort
Individuals who were hospitalized for an index episode of HF were identified from the Enhanced Feedback for Effective Cardiac Treatment (EFFECT) phase 1 study. The EFFECT study was a cluster randomized clinical trial conducted in 86 acute care hospitals in Ontario from 1 April 1999 to 30 March 2001 to determine if the public release of hospital report cards would improve the quality of care provided. Patients included in the EFFECT study were those hospitalized with a most responsible diagnosis of HF using the International Classification of Diseases 9th revision (ICD-9-CM code 428) according to the hospital discharge abstract in the Canadian Institute for Health Information Discharge Abstract Database (CIHI-DAD).8 Eligible patients had their primary chart records abstracted by highly trained nurse-abstractors for clinical information and only patients who met the Framingham criteria for HF were included.9 Patients who were assessed in the emergency department and were not admitted to hospital were not included in the analysis.
Additional data sources
We linked clinical data from the EFFECT study to the Canadian Institute for Health Information Discharge Abstract Database (CIHI-DAD) to identify hospital admissions before and after the index hospitalization for HF, and to determine occurrence of in-hospital deaths. We used the Registered Persons Database (RPDB) to determine occurrence of death among the study cohort. All databases were linked using unique encoded identifiers and analysed at the Institute for Clinical Evaluative Sciences (ICES).
Outcome
The primary outcome was time-to-hospitalization defined as unplanned hospitalizations of any cause following the index admission. Admissions with a length of stay of 1 day or less were not counted as an outcome event, since these were likely to be planned admissions according to the same approach used in previous studies.2,10 Patients who were transferred between hospitals during a hospitalization were considered to have experienced a single episode of care. Repeated hospitalizations were examined from the day of discharge from the index hospitalization (baseline) until the first of death or end of observation on 31 March 2014.
Covariates
The variables examined have been used in a previously validated model for readmission in HF developed using administrative data.11 The variables included age, sex, aetiology (ischaemic vs. non-ischaemic), diabetes mellitus, cancer, stroke, cardiopulmonary respiratory failure, shock, pneumonia, chronic pulmonary obstructive disease (COPD), dementia, depression, peripheral vascular disease, chronic liver disease, mitral and aortic valve disease, asthma, dialysis, and a previous hospitalization before the index event. Ischaemic aetiology was defined as a diagnosis of coronary artery disease, previous acute coronary syndrome (i.e. unstable angina or myocardial infarction), percutaneous coronary intervention, or coronary artery bypass graft surgery. All variables were coded as categorical variables with the exception of age. In an additional analysis, we also characterized study participants by the number of comorbidities, therefore treating comorbidities as a continuous variable.
Statistical analysis
For the descriptive analysis, categorical variables were summarized using the absolute number and percentage and numerical variables using the median and interquartile range. The hospitalization probability was plotted using the cumulative incidence function that accounted for death as a competing risk.12,13 Time was measured from one hospital discharge to the next admission. To identify independent predictors of repeated hospital admissions over the course of the disease, we utilized the Prentice–Williams–Peterson (PWP) model with a total time scale measured from the beginning of the study (TT).14 The PWP-TT is a conditional model that stratifies participants based on the number of repeated events experienced within the study. Thus, the PWP-TT allows the calculation of common-event estimates for the independent variables and also event-specific estimates by adding interactions between the covariates and the strata.14 The PWP-TT treats as censored both those subjects who died and those who reached the end of the study period alive without a hospitalization event. To fit the PWP-TT, the dataset was truncated after the fifth hospitalization (i.e. all hospitalizations after the fifth were discarded). This cut-off was considered necessary in order to account for a large number of events experienced by the cohort and to obtain stable estimates. Dependence of repeated events within the same subject (i.e. to account for the within-person propensity for hospitalization) was accounted for using robust standard errors.15 The model adopted discontinuous risk intervals meaning that an individual could not be at risk for a new hospitalization while the previous one was still ongoing.16,17 Results were expressed as adjusted relative rates (RR) and 95% Wald confidence intervals (CI). Analyses were performed using SAS 9.4 (Cary, NC, USA).
Results
Study cohort
The patient flow diagram is shown in Figure 1. Among a total of 9781 subjects included in the EFFECT study, 833 (8.5%) died during the index hospitalization. The cohort for this analysis consisted of 8948 patients who were discharged alive and were thus eligible for readmissions. Of this total, 1386 (15.5%) did not experience a hospitalization during follow-up, while 7562 (84.5%) were readmitted at least once. The mortality rate was 5.2%, 27.9%, and 67.1% at 1 month, 1 year, and 5 years, respectively. Over the 15 years of observation, approximately 92% of the study cohort died.
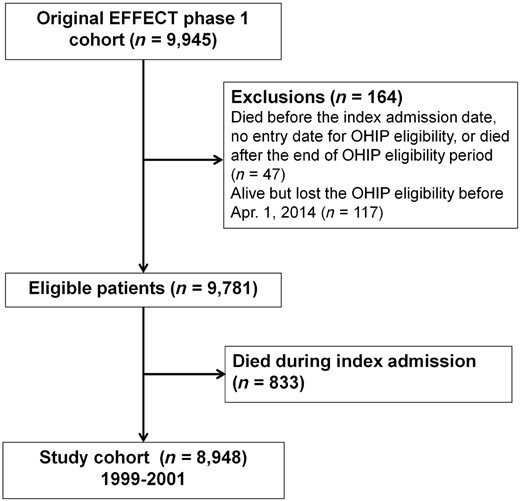
Patient flow diagram.
Baseline characteristics
Among the 8948 patients examined, 5270 (58.9%) had an ischaemic aetiology, 1128 had HF with preserved ejection fraction (EF), 2252 had HF with reduced EF, and 720 had borderline EF (EF between 40 and 50%) while 4848 did not have a measurement of EF. Patients with HF had a mean of 2.3 and a median of 2 comorbidities (minimum 0 and maximum of 8). Only 9% of patients with HF had no comorbidities, approximately 22% had 1, almost 30% had 2, and 40% had 3 or more comorbidities. As shown in Table 1, some baseline variables were significantly associated with the risk of being admitted at least once during follow-up. Patients more likely to be hospitalized during the course of the disease were younger, more often had ischaemic aetiology as the underlying cause of HF, and exhibited a higher prevalence of asthma and diabetes.
Baseline characteristics based on hospitalizations experienced during follow-up
| Variable | Number of hospitalizations | |
|---|---|---|
| 0 | 1 or more | |
| Number of patients | 1386 | 7562 |
| Age, years, median (IQR) | 80 (70–86) | 77 (69–83) |
| Sex, male, n (%) | 691 (49.9) | 3693 (48.8) |
| Ischaemic aetiology*, n (%) | 775 (56) | 4495 (59.4) |
| Pneumonia, n (%) | 88 (6.4) | 287 (3.8) |
| Shock, n (%) | SC | 17 (0.2) |
| Atrial fibrillation, n (%) | 390 (28.1) | 2234 (29.5) |
| Cardiac arrest, n (%) | 15 (1.1) | 39 (0.5) |
| Asthma, n (%) | 80 (5.8) | 614 (8.1) |
| Aortic valve disease, n (%) | 111 (8) | 632 (8.4) |
| Cancer, n (%) | 157 (11.3) | 832 (11) |
| Hepatic cirrhosis, n (%) | 10 (0.7) | 50 (0.7) |
| COPD, n (%) | 221 (16) | 1235 (16.3) |
| Stroke/TIA, n (%) | 242 (17.5) | 1191 (15.8) |
| Dementia, n (%) | 208 (15) | 389 (5.1) |
| Depression, n (%) | 193 (14) | 845 (11.2) |
| Diabetes mellitus, n (%) | 393 (28.4) | 2703 (35.7) |
| Dialysis, n (%) | 17 (1.2) | 102 (1.4) |
| Mitral valve disease, n (%) | 129 (9.3) | 813 (10.8) |
| Peripheral arterial disease, n (%) | 167 (12.1) | 970 (12.8) |
| Number of previous hospitalization, median (IQR) | 3 (1–5) | 3 (1–6) |
Ischaemic aetiology was defined as prior coronary artery disease, acute coronary syndrome, percutaneous coronary intervention, or coronary artery bypass graft surgery.
SC, small cell size (cannot be reported due to privacy regulations); COPD, chronic pulmonary obstructive disease; IQR, interquartile range; TIA, transient ischaemic attack.
Number of hospital admissions following discharge
Readmission statistics are shown in Table 2. During a median follow-up time of 1003 days (range: 1–5470 days), 31 003 admissions of any cause were observed, with a mean of 3.5 and a median of 2.0 (interquartile range: 1–5) hospitalizations per patient. The hospitalization rate was 82.7 per 100 person-years at risk. The majority of hospital admissions (58%) had a non-cardiac diagnosis as the most responsible diagnosis. Heart failure hospitalizations accounted for approximately 27% of the total number of hospitalizations. The number of hospitalizations per patient ranged from 0 to 48. Almost two thirds of all patients had 1 to 5 readmissions during follow-up. Only 2% had more than 15 hospitalizations. A survival analysis based on the Cox PH model using time-to-first hospitalization as the outcome would have ignored 75% of all events experienced by the study cohort, while a logistic regression model using the hospital admissions with 30 days as the outcome would have ignored 95% of all hospitalization events.
Number and causes of hospital admissions during follow-up
| Characteristic | Study cohort |
|---|---|
| Number of patients eligible for hospitalization | 8948 |
| Total observation time in person-years | 38 404 |
| Total observation time in person-years at risk* | 37 496 |
| Number of hospitalizations of any cause, n (%) | 31 003 (100) |
| Number of non-cardiac hospitalizations, n (%) | 17 980 (58) |
| Number of cardiac hospitalizations, n (%) | 13 023 (42) |
| Number of HF hospitalizations | 8232 (26.6) |
| Number of CAD hospitalizations | 3198 (10.3) |
| Number of other cardiac disease hospitalizations | 1593 (5.1) |
| Patients with hospital admission of any cause, n (%) | |
| 1–5 | 5780 (64.6) |
| 6–10 | 1288 (14.4) |
| 11–15 | 350 (3.9) |
| >15 | 144 (1.6) |
| Number of events in a ‘time-to-first hospitalization’ analysis | 7562 |
| Number of events ignored in a ‘time-to-first admission’ analysis, n (%) | 23 441 (75.6) |
| Number of events using ‘30-day readmission rate’ | 1592 |
| Number of events ignored using ‘30-day readmission rate’, n (%) | 29 411 (94.9) |
Exclusion of the duration of the hospitalizations.
CAD, coronary artery; HF, heart failure; n, number.
Hospitalization risk following discharge
The cumulative incidence functions (shown in Figure 2) indicating the incidence of hospitalization demonstrated a progressive shortening of the interval length between hospitalization episodes measured from hospital discharge to the next hospitalization. The median time decreased from 765 days for the first hospitalization, to 226 days for the fifth hospitalization, and to 131 days for the tenth hospitalization. According to the PWP-TT model, a previous hospitalization significantly and independently increased the risk of a future hospital admission by 33% in a multivariable analysis.
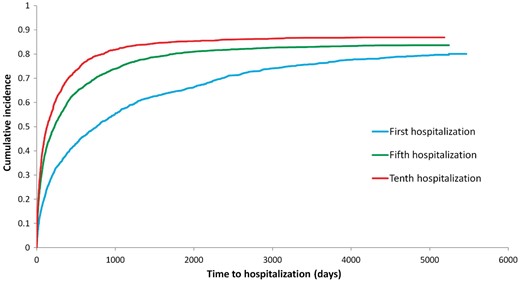
Cumulative risk of successive hospital admission.
Independent predictors of hospital admission
The number of patients that experienced a hospitalization or were censored up to episode number five are shown in Figure 3. Age, ischaemic aetiology, asthma, aortic valve disease, cancer, liver cirrhosis, COPD, diabetes, dialysis, and peripheral arterial disease were independently associated with an increased risk of hospitalizations of any cause when considering the full course of the disease. Some predictors had a strong association with the risk of hospitalization: liver cirrhosis and dialysis resulted in a 30% increase in the rate, while COPD and diabetes increased the rate by 20% (Table 3). As shown in Table 4, the analysis of event-specific estimates for individuals at risk for each hospitalization revealed that the association of certain patient factors such as age, diabetes, and COPD with the rate of hospitalization was consistent across the five episodes examined. Specifically, age, diabetes, and COPD increased the hazard of a first hospitalization as well as the hazard of a second hospitalization in those patients who had had a first hospitalization, and so on up to the fifth episode of hospitalization examined. Other clinical characteristics such as ischaemic aetiology, cancer, dialysis, peripheral arterial disease, and previous hospitalizations were associated with most episodes of readmission but not all five episodes. In contrast, asthma, a previous cerebrovascular accident, dementia, and depression were associated only with the occurrence of two or fewer episodes of hospitalization. As an example, depression increased the hazard of hospitalization in those who had not yet had a previous hospital admission; however, in those with at least one hospitalization, depression did not influence the rate of subsequent episodes. The estimates the first admission are identical to the ones obtained with the Cox PH model as expected. When comparing the estimates from both models (Table 3), we observed that an analysis based on the Cox PH model would generate RR that exceeded the overall estimates obtained with the PWP-TT model for most variables.
Common-events estimates according to the Cox PH model and the PWP-TT model
| Covariates | Cox PH | PWP-TT | ||
|---|---|---|---|---|
| RR | 95% CI | RR | 95% CI | |
| Age, per 10 years increase | 1.16 | 1.13–1.18 | 1.09 | 1.07–1.11 |
| Sex, male vs. female | 0.97 | 0.92–1.01 | 0.99 | 0.96–1.03 |
| Ischaemic aetiology, yes vs. no | 1.16 | 1.11–1.22 | 1.12 | 1.08–1.16 |
| Pneumonia, yes vs. no | 1.02 | 0.89–1.15 | 1.07 | 0.99–1.16 |
| Shock, yes vs. no | 1.38 | 0.85–2.24 | 0.97 | 0.64–1.45 |
| Atrial fibrillation, yes vs. no | 1.05 | 1.00–1.10 | 1.04 | 1.00–1.07 |
| Arrest, yes vs. no | 0.85 | 0.63–1.14 | 0.80 | 0.62–1.02 |
| Asthma, yes vs. no | 1.02 | 0.94–1.11 | 1.07 | 1.01–1.13 |
| Aortic valve disease, yes vs. no | 1.11 | 1.03–1.21 | 1.10 | 1.03–1.17 |
| Cancer, yes vs. no | 1.11 | 1.03–1.19 | 1.09 | 1.04–1.15 |
| Cirrhosis, yes vs. no | 1.20 | 0.87–1.66 | 1.32 | 1.07–1.63 |
| COPD, yes vs. no | 1.28 | 1.20–1.36 | 1.23 | 1.18–1.29 |
| CVA, yes vs. no | 1.08 | 1.02–1.15 | 1.02 | 0.97–1.06 |
| Dementia, yes vs. no | 0.88 | 0.79–0.97 | 0.94 | 0.88–1.02 |
| Depression, yes vs. no | 1.12 | 1.04–1.21 | 1.01 | 0.96–1.07 |
| Diabetes, yes vs. no | 1.27 | 1.21–1.34 | 1.23 | 1.19–1.27 |
| Dialysis, yes vs. no | 1.29 | 1.06–1.56 | 1.37 | 1.19–1.59 |
| Mitral valve disease, yes vs. no | 1.10 | 1.01–1.19 | 0.98 | 0.93–1.04 |
| Peripheral arterial disease, yes vs. no | 1.19 | 1.12–1.28 | 1.13 | 1.07–1.19 |
| Previous hospitalization, yes vs. no | 1.47 | 1.37–1.58 | 1.33 | 1.26–1.40 |
Covariates that reached statistical significance are in bold.
CI, confidence interval; CVA, cerebrovascular accident; PH, proportional hazard; PWP-TT, Prentice–Williams–Peterson with total time; RR, relative risk.
Event-specific estimates according to the PWP-TT
| Covariates | Admission 1 | Admission 2 | Admission 3 | Admission 4 | Admission 5 | |||||
|---|---|---|---|---|---|---|---|---|---|---|
| RR | 95% CI | RR | 95% CI | RR | 95% CI | RR | 95% CI | RR | 95% CI | |
| Age, per 10 years increase | 1.16 | 1.13–1.18 | 1.09 | 1.06–1.12 | 1.06 | 1.03–1.09 | 1.04 | 1.01–1.07 | 1.05 | 1.01–1.10 |
| Sex, male vs. female | 0.97 | 0.92–1.01 | 0.98 | 0.92–1.05 | 1.03 | 0.95–1.12 | 1.03 | 0.93–1.14 | 0.95 | 0.84–1.07 |
| Ischaemic aetiology, yes vs. no | 1.16 | 1.11–1.22 | 1.13 | 1.06–1.21 | 1.17 | 1.08–1.27 | 1.06 | 0.96–1.18 | 1.10 | 0.97–1.24 |
| Pneumonia, yes vs. no | 1.02 | 0.89–1.15 | 1.02 | 0.87–1.19 | 1.15 | 0.92–1.43 | 1.16 | 0.91–1.47 | 1.14 | 0.84–1.53 |
| Shock, yes vs. no | 1.38 | 0.85–2.24 | 0.73 | 0.29–1.85 | 0.77 | 0.42–1.39 | 0.70 | 0.28–1.78 | 0.88 | 0.13–6.22 |
| Atrial fibrillation, yes vs. no | 1.05 | 1.00–1.10 | 0.99 | 0.93–1.07 | 1.12 | 1.03–1.23 | 1.00 | 0.90–1.12 | 1.12 | 0.98–1.27 |
| Arrest, yes vs. no | 0.85 | 0.63–1.14 | 0.96 | 0.60–1.52 | 0.59 | 0.32–1.08 | 0.49 | 0.20–1.19 | 4.78 | 1.12–20.5 |
| Asthma, yes vs. no | 1.02 | 0.94–1.11 | 1.13 | 1.02–1.26 | 1.02 | 0.88–1.18 | 1.06 | 0.90–1.25 | 1.11 | 0.91–1.35 |
| Aortic valve disease, yes vs. no | 1.11 | 1.03–1.21 | 1.07 | 0.94–1.21 | 1.32 | 1.13–1.53 | 0.91 | 0.74–1.12 | 1.07 | 0.84–1.36 |
| Cancer, yes vs. no | 1.11 | 1.03–1.19 | 1.11 | 1.00–1.23 | 1.15 | 1.01–1.31 | 1.01 | 0.84–1.21 | 1.04 | 0.86–1.26 |
| Cirrhosis, yes vs. no | 1.20 | 0.87–1.66 | 1.66 | 1.03–2.69 | 1.62 | 1.17–2.26 | 1.13 | 0.62–2.07 | 1.06 | 0.52–2.18 |
| COPD, yes vs. no | 1.28 | 1.20–1.36 | 1.22 | 1.12–1.32 | 1.21 | 1.08–1.35 | 1.34 | 1.18–1.53 | 1.17 | 1.01–1.35 |
| CVA, yes vs. no | 1.08 | 1.02–1.15 | 1.07 | 0.98–1.17 | 0.97 | 0.87–1.08 | 0.98 | 0.84–1.14 | 0.84 | 0.71–0.99 |
| Dementia, yes vs. no | 0.88 | 0.79–0.97 | 1.07 | 0.91–1.25 | 0.87 | 0.72–1.05 | 0.96 | 0.70–1.30 | 0.98 | 0.70–1.37 |
| Depression, yes vs. no | 1.12 | 1.04–1.21 | 0.99 | 0.90–1.11 | 0.97 | 0.86–1.11 | 0.90 | 0.78–1.04 | 0.96 | 0.81–1.14 |
| Diabetes, yes vs. no | 1.27 | 1.21–1.34 | 1.19 | 1.12–1.28 | 1.26 | 1.15–1.37 | 1.22 | 1.09–1.36 | 1.16 | 1.02–1.31 |
| Dialysis, yes vs. no | 1.29 | 1.06–1.56 | 1.36 | 1.05–1.76 | 1.02 | 0.74–1.41 | 0.95 | 0.59–1.56 | 1.62 | 1.12–2.34 |
| Mitral valve disease, yes vs. no | 1.10 | 1.01–1.19 | 0.98 | 0.88–1.09 | 0.84 | 0.73–0.97 | 0.96 | 0.79–1.16 | 0.96 | 0.80–1.17 |
| Peripheral arterial disease, yes vs. no | 1.19 | 1.12–1.28 | 1.20 | 1.09–1.32 | 1.04 | 0.91–1.18 | 0.98 | 0.83–1.16 | 1.24 | 1.03–1.49 |
| Previous hospitalization, yes vs. no | 1.47 | 1.37–1.58 | 1.33 | 1.19–1.48 | 1.25 | 1.08–1.43 | 1.16 | 0.98–1.37 | 1.15 | 0.93–1.44 |
Covariates that reached statistical significance are in bold.
CI, confidence interval; COPD, chronic obstructive pulmonary disease; CVA, cerebrovascular accident; RR, relative rate; PWP-TT, Prentice–Williams–Peterson with total time.
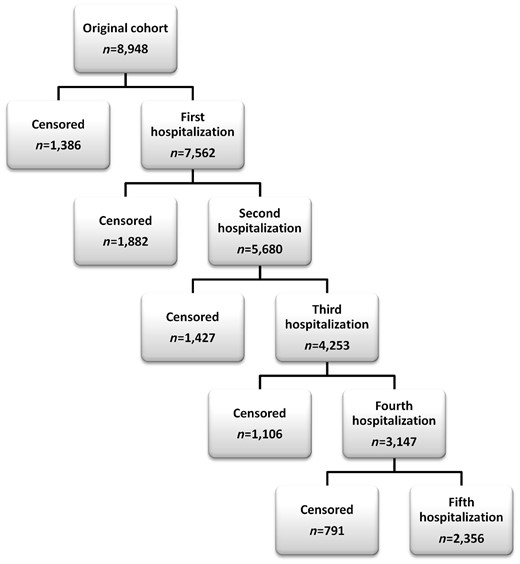
Number of patients and outcomes according to the number of the hospitalization event.
When we examined the presence of comorbidities as a count together with age and sex in the PWP-TT model, we found that the presence of each additional comorbidity increased the hazard of a readmission by 11% (RR 1.11; 95% CI 1.10–1.12; P < 0.001). When treated as a categorical variable, we found that the increasing number of comorbidities was associated to an increasing hazard of being readmitted to hospital (Figure 4).
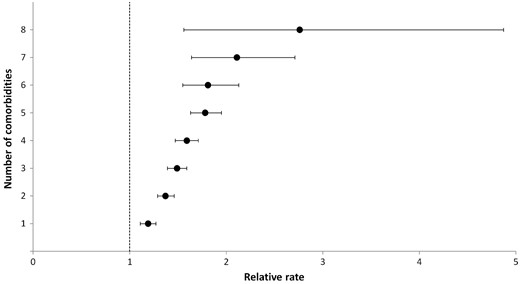
Hazard of hospital admission of any cause based on the number of comorbidities.
Examining the associations between covariates and the rate of hospitalization in the subgroups with ischaemic and non-ischaemic aetiology, we noticed some significant differences (see Supplementary material online). In individuals with an ischaemic aetiology, atrial fibrillation and cirrhosis were associated to an increased hazard of being readmitted to hospital. Meanwhile, aortic valve disease was associated to an increased risk of hospital admission in the group with non-ischaemic aetiology. Overall, covariates that were statistically significant in both groups had a stronger association with the rate of hospital admission in the group with non-ischaemic aetiology.
Discussion
In this analysis of a large cohort of patients with HF, we found that a substantial number of hospitalizations would be ignored if traditional methods for time-to-first or early events were used in the statistical analysis. The availability of longitudinal data from administrative databases, allowing the capture of virtually all hospitalizations experienced by study participants, has created interest in examining hospitalizations as a recurrent event and not simply as a first event. Conceptually, a more robust analytical strategy based on better utilization of the data could allow investigators to obtain a better understanding of the hospitalization process. Accordingly, we used the PWP-TT model to examine hospitalizations in HF.
First, we examined the relationship between previous hospitalizations and the rate of subsequent hospitalizations. Initially, we plotted the cumulative incidence of hospitalization to examine the length of the interval between events. We found that there was a progressive reduction of the median time to the next hospitalization. In an adjusted analysis, the PWP-TT indicated that the total risk of readmission increased based on a history of hospitalizations prior to the index event. Second, we examined the association of other patient factors with the rate of hospitalization. The factors associated with the rate of hospitalization identified in our analysis have been previously described in studies based on time-to-first event analyses.18 However, the PWP-TT generated more conservative estimates than the Cox PH model. The smaller RRs obtained with the PWP are probably the consequence of the way that the risk set is organized accounting for ordering of the repeated events. The analysis of event-specific estimates revealed that the association of patient factors with the risk of hospital admission changed over the course of the disease. The importance of some factors (e.g. diabetes and COPD) remained constant across the five episodes examined suggesting an association that is sustained as the time from baseline increases. Meanwhile, some patient level-characteristics were not associated with the rate of future hospitalizations beyond the first or lost importance after the first two or three hospitalizations. The perspective of the longitudinal aspect of the disease in contrast to a first event only modifies the perception about the relevance of a certain factor. COPD and diabetes mellitus are common among patients with HF and independently and consistently associated to an increased risk of readmission.19,20
Another finding of our analysis is that comorbidities frequently accompany HF and lead to increased hazard of being admitted to hospital. This could explain the elevated number of readmissions with a non-cardiac cause detected in our study. Our analysis led us to speculate about whether better management of comorbidities, especially COPD and diabetes, would reduce the future rate of hospitalizations in HF. It is well-known that the care of patients with multiple comorbidities is often focused on a single medical condition, leading to under-treatment of unrelated disorders.21 The predominance of non-cardiac causes as the most responsible diagnosis in almost 60% of all hospitalizations suggests that a cardiac-specific approach in contrast to a medically-comprehensive approach may be insufficient to reduce the hospitalization burden in patients with HF.22 Considering that many comorbidities are potentially treatable, patients with HF may benefit from newer models of care that reduce the fragmented approach that these patients often receive. Although it remains unproven that treatment of comorbidities improves outcomes, this possibility deserves strong consideration when considering the burden of hospitalizations in the population with HF.
Selection of a statistical model
A wide variety of statistical models have been proposed for the analysis of recurrent events. The most common approaches are the Andersen–Gill (AG) model and the PWP-TT model. What distinguishes these two models is the definition of the risk set or how subjects in the cohort are defined to be available to experience the event of interest at any single time. In the AG, the risk set will include all subjects that are under observation irrespective of the number of recurrent events experienced. The AG treats the recurrent event times for each subject as being independent of each other, and ignores the order of events.23 In contrast, the PWP-TT considers that individuals are not at risk for the next event until the preceding event has occurred and terminated. This conditional definition of the risk set used in the PWP-TT causes the sample size to decrease progressively as the rank of the events increases. This may be impractical for studies with shorter follow-up and lesser number of events experienced by the study cohort.
Selection of the most appropriate model for the analysis of recurrent events should be driven by the research question and the biological behaviour of the condition under study6: If the investigator wants to examine the overall association of a covariate over hospitalizations when considering the full course of the disease, then the AG should be the primary choice. If instead, the investigator wants to determine the association of a covariate for a specific hospitalization, then the PWP is indicated.
The biological behaviour of the disease under study will also influence the choice of model. For example, if the risk for the next event hospitalization increases after a patient is admitted to hospital, then the choice would be a model with stratified baseline hazard (i.e. PWP) or a model that incorporates a time-varying covariate indicating the number of events within the study (i.e. AG with a time-varying covariate). If the risk remains constant regardless of previous events, then a model with constant baseline hazard across events (i.e. AG) should be used.
Challenges related to the utilization of models for the analysis of recurrent events
When conducting this study, we were faced with several challenges related to analytical decisions and presentation of the results. For example, before estimating a statistical model for the analysis of recurrent events, it is necessary to reorganize the dataset from a wide to a long format using the counting process formulation. The counting process formulation allows the utilization of discontinuous risk intervals, time-varying covariates, and multiple events per patient. However, the proper reorganization of the dataset can be time-consuming and prone to errors. As Therneau notes, ‘the flexibility of counting process format is its great strength’, ‘but also its weakness, because it is possible for the user who sets up the data to mess up the data’.24 Another challenge is how to decide about a regression model with a constant baseline hazard in contrast to a model with a baseline hazard that varies from event to event. Hospitalizations have been shown to act as markers of disease progression manifested by increased risk of future admission supporting the use of models with stratified baseline hazards.25,26 At the same time, arguments justifying the use of a common baseline hazard could be found to support the notion that there is no clear biological mechanism underlying the relation between events. Another point that is unclear is how to present the results for an analysis of recurrent events: some have proposed that the results should be anchored to a traditional analysis based on time to first event. However, the interpretation of the results may be difficult if they differ substantially in magnitude or direction. That also seems to contradict the idea that the model used should be the one defined as the most appropriate to answer the research question. Another issue is the type of hospitalization (i.e. HF-related vs. any cause) used as the outcome. If only hospitalizations recorded as being caused by HF are considered, admissions related to the presence of comorbidities may be omitted.7 This omission would ignore a large proportion of the hospitalization burden when considering that almost 60% of all hospitalizations in patients with HF have a non-cardiovascular cause. Alternatively, if all hospitalizations are considered, the importance of factors that are specific for HF hospitalizations may be difficult to determine considering the heterogeneity of hospitalization events that seem to occur independently of HF. All these challenges in conjunction with the current environment that measures performance and penalizes hospitals based on a short-term outcome may have diminished the interest of health professionals on a more wholistic analysis of recurrent events.27,28
Limitations
Our study has limitations. First, the PWP model does not make a distinction between patients who die from those who do not experience the event of interest before the end of the observation period—they are both censored. As such, they do not account for death as a competing risk that can end the observation period. Multistate models have been suggested as an alternative to examine the interrelated trajectory of hospitalizations and death in patients with HF.29,30 This seems particularly important in the analysis of hospitalization in HF since a diagnosis of HF carries a high mortality risk.31–33 Second, we assumed non-informative censoring during the analysis. However, in the context of HF, the occurrence of death ending the observation of recurrent hospitalizations can invalidate this assumption and be interpreted as a case of informative censoring. Joint frailty models have been proposed as an option for the analysis of recurrent events in the presence of informative censoring.34,35 Third, the explanatory variables examined were treated as time-invariant. This is not an issue when only first events are considered. However, hospitalizations are considered unique opportunities to improve the process of care of patients with HF. Efforts are made to detect and treat precipitating factors and associated conditions and initiate guideline-directed medical therapy.36 Therefore, in an analysis of recurrent events, the influence of covariates will probably not be the same across all events. Ideally, independent variables that can have values that change during the study should be incorporated. Although we recognize that the counting process format can accommodate time-dependent covariates, we realize that it can be challenging to define when a variable is ‘turned on’ and remains ‘on’ during the follow-up and when they are set to ‘off’. Fourth, the interpretation of the event-specific estimates can be quite complex. As the rank of the hospitalization increases, estimates for each subsequent hospitalization are based on successively smaller subsets of the original numbers of observations, and confidence intervals become wider as a result. Therefore, the precision of the estimated regression coefficients also decreases with the increasing rank of hospitalizations, suggesting that the models perform progressively more poorly.37 Although we have been careful to examine a number of hospitalizations (i.e. five) that we considered large enough to obtain stable estimates, there is the possibility of covariates losing statistical significance for high rank strata because of efficiency loss. In addition, some unexpected patterns (e.g. a previous cardiac arrest was associated with the fifth episode of hospitalization but not with the previous four) may be uncovered that may indicate spurious associations related to the small number of patients at risk at a specific hospitalization event. Fifth, we were unable to adjust our analysis according to the ejection fraction and type of HF (preserved vs. reduced vs. borderline). Considering that more than 50% of individuals in the study cohort did not have an ejection fraction measurement and multiple imputation methods are not meaningful under a heavy amount of missingness and not well established for the analysis of recurrent event data, we decided not to include this variable in the regression analysis. Sixth, using administrative data we cannot quantify the role played by HF in those hospital admissions that had a non-cardiac diagnosis assigned as the primary cause for the event. It is known that non-cardiac comorbidities and HF are interrelated and their interaction adversely impacts management and clinical course of one another. Therefore, it is possible that HF was likely relevant to many subsequent hospitalizations even if not defined as the most responsible diagnosis in the discharge abstract.
Conclusions
Using a regression model for the analysis of recurrent events, we demonstrated that HF has an accelerated trajectory of readmission risk with progressive shortening of the interval between hospitalizations. The number of comorbidities was associated with the hazard of being admitted to hospital. Estimates obtained with the PWP-TT model were consistently smaller in comparison to those obtained from the Cox PH model. The importance of patient factors for the rate of being admitted to hospital was variable over the course of the disease. Comorbidities such as diabetes and COPD had a continued association with the hospitalization risk in comparison to other comorbidities. Techniques for the analysis of recurrent events offer an important set of tools to explore the longitudinal aspect of HF and the critical issue of hospitalizations in this population. However, not all of the methodological challenges about the utilization of those methods have been resolved.
Supplementary material
Supplementary material is available at European Heart Journal – Quality of Care and Clinical Outcomes online.
Ethics approval
This study was approved by the institutional review board at Sunnybrook Health Sciences Centre, Toronto, Canada.
Funding
Funded by a Foundation Grant (Grant # FDN 148446) from the Canadian Institutes of Health Research and the Ted Rogers Centre for Heart Research. The EFFECT study was supported by a Canadian Institutes of Health Research team grant in cardiovascular outcomes research to the Canadian Cardiovascular Outcomes Research Team; it was initially funded by a Canadian Institutes of Health Research Interdisciplinary Health Research Team grant and a grant from the Heart and Stroke Foundation of Canada. Austin is supported by a Career Investigator Award from the Heart and Stroke Foundation. Lee is supported by a mid-career investigator award from the Heart and Stroke Foundation and the Ted Rogers Chair in Heart Function Outcomes. Tu is supported by a Tier 1 Canada research chair in Health Services Research and an Eaton Scholar Award from the University of Toronto Department of Medicine.
Conflict of interest: The authors of this manuscript have no conflicts of interest to disclose. Parts of this material are based on data and information compiled and provided by CIHI. However, the analyses, conclusions, opinions and statements expressed herein are those of the authors, and not necessarily those of CIHI. This study was supported by the Institute for Clinical Evaluative Sciences (ICES), which is funded by an annual grant from the Ontario Ministry of Health and Long-Term Care (MOHLTC). The opinions, results and conclusions reported in this paper are those of the authors and are independent from the funding sources. No endorsement by ICES or the Ontario MOHLTC is intended or should be inferred.
References
