


Abstract
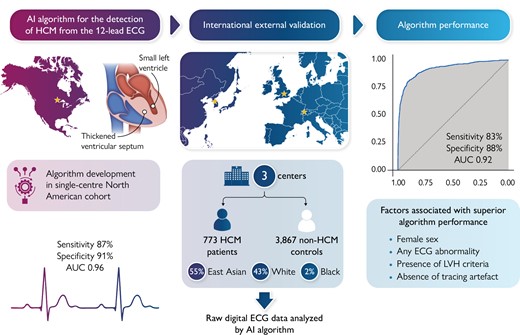
Recently, deep learning artificial intelligence (AI) models have been trained to detect cardiovascular conditions, including hypertrophic cardiomyopathy (HCM), from the 12-lead electrocardiogram (ECG). In this external validation study, we sought to assess the performance of an AI-ECG algorithm for detecting HCM in diverse international cohorts.
A convolutional neural network-based AI-ECG algorithm was developed previously in a single-centre North American HCM cohort (Mayo Clinic). This algorithm was applied to the raw 12-lead ECG data of patients with HCM and non-HCM controls from three external cohorts (Bern, Switzerland; Oxford, UK; and Seoul, South Korea). The algorithm’s ability to distinguish HCM vs. non-HCM status from the ECG alone was examined. A total of 773 patients with HCM and 3867 non-HCM controls were included across three sites in the merged external validation cohort. The HCM study sample comprised 54.6% East Asian, 43.2% White, and 2.2% Black patients. Median AI-ECG probabilities of HCM were 85% for patients with HCM and 0.3% for controls (P < 0.001). Overall, the AI-ECG algorithm had an area under the receiver operating characteristic curve (AUC) of 0.922 [95% confidence interval (CI) 0.910–0.934], with diagnostic accuracy 86.9%, sensitivity 82.8%, and specificity 87.7% for HCM detection. In age- and sex-matched analysis (case–control ratio 1:2), the AUC was 0.921 (95% CI 0.909–0.934) with accuracy 88.5%, sensitivity 82.8%, and specificity 90.4%.
The AI-ECG algorithm determined HCM status from the 12-lead ECG with high accuracy in diverse international cohorts, providing evidence for external validity. The value of this algorithm in improving HCM detection in clinical practice and screening settings requires prospective evaluation.
Introduction
The diagnosis of hypertrophic cardiomyopathy (HCM), one of the most common genetic heart diseases predisposing to sudden cardiac death (SCD), relies on clinical assessment and cardiac imaging, namely echocardiography and cardiac magnetic resonance.1 However, these modalities are not always readily available and can only be interpreted by clinicians with expertise. Hypertrophic cardiomyopathy may also remain asymptomatic for a long time or cause non-specific symptoms that are often unsuspected and undiagnosed in early stages.2 Prompt diagnosis of HCM can lead to appropriate disease surveillance, family screening, and timely implementation of outcome-modifying interventions, including implantable cardioverter–defibrillators when indicated.
The 12-lead electrocardiogram (ECG) is an integral test in the evaluation of patients with cardiovascular symptoms and can offer important insights in patients with known or suspected HCM.3 Yet, ECG interpretation requires expertise and there are no pathognomonic ECG features of HCM. The cardinal ECG features of HCM, including left ventricular hypertrophy (LVH) by voltage criteria, repolarization abnormalities, and Q waves may be observed in other conditions such as hypertensive heart disease, aortic stenosis, and in athlete’s heart.4,5 Furthermore, the ECG can be normal in ∼5–10% of patients with HCM.6
Deep learning artificial intelligence (AI) applications on the ECG have great potential to detect occult cardiovascular disease.7 An algorithm based on convolutional neural network (CNN) architecture (AI-ECG) was recently developed to detect HCM from the standard 12-lead ECG alone without any additional input of patient demographic or clinical information.8 This AI-ECG algorithm performed well in patients with common HCM ‘mimics’ and in patients with a normal ECG, suggesting that it can help extend clinicians’ ability to suspect HCM from the routine ECG, followed by confirmatory imaging studies. This algorithm was trained and internally tested in a population from a tertiary institution in North America (Mayo Clinic) and validated subsequently in a paediatric/adolescent population of HCM from the same institution,9 but it has not yet undergone extensive external validation. Herein, we sought to externally evaluate the performance of this AI-ECG algorithm in diverse international cohorts of patients undergoing ECG in clinical practice.
Methods
Study design
The study design was in adherence to the TRIPOD statement.10 This retrospective case–control study consisted of cohorts from geographically diverse tertiary care institutions providing care to patients with HCM. The participating centres and subject enrolment periods in each centre were as follows: the University of Bern, Switzerland (2014–20); Oxford University, UK (2013–21); and Seoul National University, South Korea (2007–20). Each centre contributed data on consecutive adult patients with HCM who had available research authorization. Patients with HCM were eligible for inclusion if they had a definite HCM diagnosis by standard European Society of Cardiology (ESC) and Americal College of Cardiology (ACC) / American Heart Association (AHA) criteria1,11 and had at least one 12-lead ECG available in digital format. Specifically, HCM was defined as LVH ≥15 mm based on echocardiography or cardiac magnetic resonance imaging in the absence of other causes of hypertrophy. In those with family history of HCM or known pathogenic HCM mutation, left ventricular (LV) wall thickness ≥13 mm was sufficient for the definition of HCM. This aligns with the diagnostic approach of HCM in the algorithm derivation cohort.8 All HCM diagnoses were adjudicated with a case-by-case review by cardiologists at the participating institutions utilizing available clinical and imaging information in the patient’s record. The time of HCM diagnosis coincided with the cardiologist’s impression that a patient met diagnostic criteria for HCM. Readily available control groups without HCM with a 12-lead ECG performed as part of clinical practice at each institution were also included (not all-inclusive of all patients with non-HCM evaluated at the institutions during the study period). The inclusion of control subjects relied on the availability of research authorization and digital ECG files for each patient rather than specific patient characteristics or a pre-defined case–control ratio.
Data collection
Standard, 10 s, 12-lead ECGs from cases and controls were acquired in the supine position at a sampling rate of 500 Hz ECGs in all participating centres, and ECG files in csv or xml format were transferred securely to the co-ordinating team at Mayo Clinic for AI-ECG analysis. One ECG per patient was used in this study. For patients with HCM with multiple available ECGs, the first ECG after the clinical diagnosis of HCM was included. Similarly, for control patients with multiple available ECGs, their first available ECG was included. There were no restrictions for ECG inclusion by patient age, year of HCM diagnosis, prior myectomy, and presence of ventricular pacing, bundle branch block (BBB), or other ECG abnormality. Notably, for algorithm development8 ECGs with the presence of ventricular pacing or left bundle branch block (LBBB) were excluded, while these exclusions did not apply in the current study as we wanted to adopt an all-inclusive validation approach. All ECGs were analysed as acquired without selection for tracing quality or any pre-processing. Electrocardiogram machine manufacturers were Schiller in Bern, Burdick in Oxford, and GE in Seoul.
Each ECG tracing in the HCM and control groups was reviewed by a single reviewer (cardiologist) blinded to HCM vs. control status in order to document the following ECG features using pre-defined criteria: normal vs. abnormal ECG, atrial fibrillation or flutter (AF), LVH present (per Sokolow–Lyon criteria), ventricular pacing, right bundle branch block (RBBB), LBBB, inferior or lateral T-wave inversions (TWIs), pathologic Q waves, and presence of artefact that could interfere with ECG interpretation according to the reviewer’s opinion.
Artificial intelligence electrocardiogram model
The Mayo Clinic AI-ECG model for HCM detection has been described previously.8 In brief, 3060 patients with a validated HCM diagnosis were age- and sex-matched to 63 941 non-HCM controls and split into training, validation, and testing groups using a 70:10:20 ratio. Digitally stored, 10-s, 12-lead ECGs acquired with a GE-Marquette machine in the supine position were converted to a 12 × 5000 matrix, and a CNN using the Keras framework with a TensorFlow backend (Google, Mountain View, CA, USA) and Python (Python Software Foundation, Beaverton, OR, USA) was applied. In the matrix, the first dimension is spatial and the second dimension is temporal. Convolutions occurred within each lead and across different leads of the 12-lead recording. After initial training, the model was fine-tuned in the internal validation data set. The optimal probability threshold for binary classification of the AI output as indicating HCM vs. no HCM diagnosis was determined to be 11% (the best combination of sensitivity and specificity or Youden’s index) based on the validation dataset receiver operating characteristic (ROC) curve in that population. The test was considered positive (i.e. AI-ECG indicates that any given ECG belongs to a patient with HCM) when the CNN output probability value was >11%. The optimal model from the training and validation steps was then tested in a separate subset of the dataset deriving an area under the ROC curve (AUC) of 0.96 with sensitivity 87% and specificity 90% for detecting HCM.
Statistical analyses
We report demographic and clinical characteristics of the HCM and control groups in the merged data set combining all three cohorts and in each cohort separately. Categorical variables are reported as absolute numbers and percentages, and continuous variables are reported as median and inter-quartile range (IQR). Two-tailed P-values <0.05 were considered statistically significant. Analyses were conducted using R Statistical Software (version 4.0.3; R Foundation for Statistical Computing, Vienna, Austria). The Institutional Review Boards of Mayo Clinic and of the participating centres approved the study.
The primary analysis was designed to determine the ability of the AI-ECG model to distinguish patients with HCM from non-HCM controls using the 12-lead ECG in the merged cohort (all three sites). In the secondary analysis, cohort-specific diagnostic performance metrics were also derived. Outputs of the AI-ECG model were generated for each HCM and non-HCM ECG representing the AI-ECG-predicted probability for that ECG belonging to a patient with HCM. Importantly, the AI model was applied to the ECG data as initially developed without any further adjustment or refinement and without any demographic or clinical information as model inputs. Summaries of the AI-ECG probabilities of HCM were reported in HCM and control subjects in the merged cohort and in each cohort separately. In order to determine true and false positive and negative detections of cases and controls by the AI-ECG algorithm, we utilized the original optimal probability threshold (11%) established during algorithm derivation, defined as the optimal balance between sensitivity and specificity (Youden’s index).8 Using the HCM status label provided by each participating centre as reference, we calculated accuracy, sensitivity, and specificity. In the secondary analyses, overall and cohort-specific optimal probability thresholds of AI-ECG outputs were also determined in order to calculate these metrics. Receiver operating characteristic curves were created, and the AUCs with 95% confidence intervals (CIs) were estimated. In the merged cohort, we also calculated the performance characteristics in subgroups defined by age, sex, ECG, and HCM characteristics. DeLong’s test was used to test for differences in the AUCs between subgroups. We also assessed algorithm diagnostic performance in an age- and sex-based nearest-neighbour matched cohort using a 1:2 ratio of cases and controls. A matching calliper of ±5 years was used for age.
Results
Cohort characteristics
A total of 773 patients with HCM and 3867 non-HCM controls from routine clinical practice were included across sites. Overall, the median age of patients with HCM and patients with non-HCM was 56 and 65.4 years, respectively (P < 0.001). The proportion of women in the HCM and non-HCM groups was 30.7 and 36.8%, respectively (P = 0.001). The total HCM cohort consisted of 54.6% East Asian, 43.2% White, and 2.2% Black patients. The prevalence of obstructive HCM was 15.7%, while apical HCM comprised 21.9% of cases with most of them originating from the Seoul cohort. Among patients with HCM, median ejection fraction, maximum wall thickness, and LV outflow tract gradient were 65% (IQR 60–70%), 19 mm (IQR 16.1–22 mm), and 6.3 mmHg (IQR 4.2–13 mmHg), respectively. Genetic testing was performed in 405 patients with HCM, and pathogenic/likely pathogenic variants in a gene for sarcomeric HCM were identified in 194 (48%). Detailed characteristics of the HCM cohorts from each participating site are shown in Table 1.
Hypertrophic cardiomyopathy cohort characteristics
| Overall | Bern | Oxford | Seoul | |
|---|---|---|---|---|
| HCM cases | n = 773 | n = 66 | n = 304 | n = 403 |
| Sex | ||||
| Male | 536 (69.3%) | 36 (54.5%) | 236 (77.6%) | 264 (65.5%) |
| Female | 237 (30.7%) | 30 (45.5%) | 68 (22.4%) | 139 (34.5%) |
| Age (years) | 56.0 (47.0, 65.0) | 60.2 (49.4, 70.7) | 52.0 (42.0, 59.0) | 59.0 (51.5, 68.0) |
| Age (years) | ||||
| <40 | 105 (13.6%) | 9 (13.6%) | 64 (21.1%) | 32 (7.9%) |
| 40–59 | 366 (47.3%) | 23 (34.8%) | 170 (55.9%) | 173 (42.9%) |
| 60–79 | 292 (37.8%) | 27 (40.9%) | 69 (22.7%) | 196 (48.6%) |
| ≥80 | 10 (1.3%) | 7 (10.6%) | 1 (0.3%) | 2 (0.5%) |
| Race | ||||
| East Asian | 422 (54.6%) | 1 (1.5%) | 18 (5.9%) | 403 (100.0%) |
| Black | 17 (2.2%) | 0 (0.0%) | 17 (5.6%) | 0 (0.0%) |
| White | 334 (43.2%) | 65 (98.5%) | 269 (88.5%) | 0 (0.0%) |
| Coronary artery disease | 99 (12.8%) | 19 (28.8%) | 5 (1.6%) | 75 (18.6%) |
| Atrial fibrillation | 161 (20.8%) | 37 (56.1%) | 34 (11.2%) | 90 (22.3%) |
| Cerebrovascular event | 98 (12.7%) | 34 (51.5%) | 9 (3.0%) | 55 (13.6%) |
| Diabetes | 108 (14.0%) | 11 (16.7%) | 13 (4.3%) | 84 (20.8%) |
| Hypertension | 268 (34.7%) | 35 (53.0%) | 55 (18.1%) | 178 (44.2%) |
| Sudden cardiac arrest | 27 (3.5%) | 9 (13.6%) | 15 (4.9%) | 3 (0.7%) |
| Implantable cardioverter–defibrillatora | 47 (6.1%) | 15 (22.7%) | 23 (7.6%) | 9 (2.2%) |
| Obstructive phenotype | 121 (15.7%) | 37 (56.9%) | 43 (14.1%) | 41 (10.2%) |
| Apical HCM | 169 (21.9%) | 4 (6.1%) | 21 (6.9%) | 144 (35.7%) |
| Family history of HCM | 189 (24.5%) | 29 (44.6%) | 117 (38.5%) | 43 (10.7%) |
| LVEF (%) | 65.0 (60.0, 70.0) | 65.0 (55.0, 65.0) | 67.0 (61.7, 73.9) | 64.0 (60.0, 68.0) |
| LVEF <50% | 23 (3%) | 7 (10.6%) | 9 (3%) | 7 (1.7%) |
| Resting LVOT gradient (mmHg) | 6.3 (4.2, 13.0) | 20.5 (10.0, 67.5) | 7.8 (5.0, 15.0) | 5.4 (3.8, 9.0) |
| Maximum wall thickness (mm) | 19.0 (16.1, 22.0) | 20.0 (17.0, 23.0) | 20.0 (16.8, 23.2) | 18.0 (16.0, 21.0) |
| Genetic testing performed | 405 (52.4%) | 17 (25.8%) | 304 (100%) | 84 (20.8%) |
| Genetic testing positive | 194 (25.1%) | 12 (18.2%) | 145 (47.7%) | 37 (9.2%) |
| Controls | n = 3867 | n = 3350 | n = 117 | n = 400 |
| Sex | ||||
| Male | 2443 (63.2%) | 2157 (64.4%) | 74 (63.2%) | 212 (53.0%) |
| Female | 1424 (36.8%) | 1193 (35.6%) | 43 (36.8%) | 188 (47.0%) |
| Age (years) | 65.4 (54.2, 75.0) | 67.5 (57.0, 76.3) | 47.0 (30.0, 61.0) | 53.0 (46.0, 60.0) |
| Age (years) | ||||
| <40 | 301 (7.8%) | 223 (6.7%) | 46 (39.3%) | 32 (8.0%) |
| 40–59 | 1059 (27.4%) | 757 (22.6%) | 38 (32.5%) | 264 (66.0%) |
| 60–79 | 1842 (47.6%) | 1711 (51.1%) | 31 (26.5%) | 100 (25.0%) |
| ≥80 | 665 (17.2%) | 659 (19.7%) | 2 (1.7%) | 4 (1.0%) |
Data shown as absolute counts (%) or medians (inter-quartile range).
HCM, hypertrophic cardiomyopathy; LVEF, left ventricular ejection fraction; LVOT, left ventricular outflow tract.
aPrior or future implantable cardioverter–defibrillator implantation.
Artificial intelligence electrocardiogram analysis for hypertrophic cardiomyopathy detection
Across all cohorts, median (IQR) AI-ECG probabilities of HCM were 85% (37–98%) for patients with HCM and 0.3% (0.05–2%) for controls (P < 0.001) (Figures 1 and 2). Among patients with HCM, AI-ECG probabilities were higher for apical compared with non-apical HCM [94% (IQR 75–99%) vs. 79% (IQR 24–97%), P < 0.001], but there were no differences for obstructive vs. non-obstructive HCM [90% (IQR 44–98%) vs. 85% (IQR 35–97%), P = 0.45], those with positive vs. negative genetic testing for sarcomeric mutations [73% (IQR 15–96%) vs. 86% (IQR 22–97%), P = 0.16], and those with vs. without hypertension [83% (IQR 28–97%) vs. 86% (IQR 42–98%), P = 0.41].
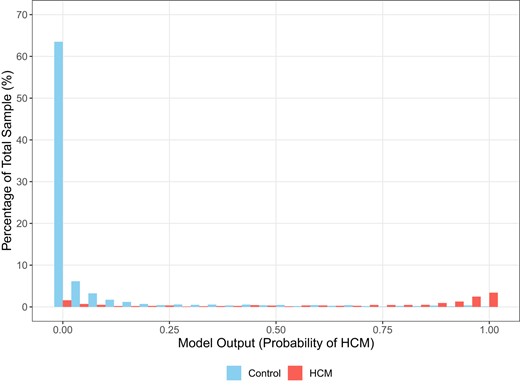
Distribution of artificial intelligence algorithm-derived probabilities of hypertrophic cardiomyopathy in cases and controls as percentages of the total sample.
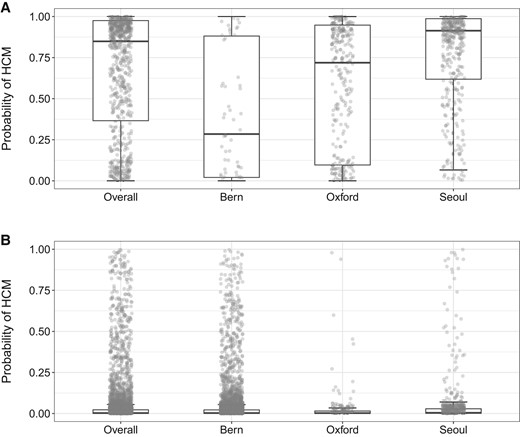
Cohort-specific artificial intelligence algorithm-derived probabilities of hypertrophic cardiomyopathy in (A) hypertrophic cardiomyopathy cases and (B) controls. The box plots show median, inter-quartile range, and max–min values of artificial intelligence scores. Optimal algorithm probability thresholds (based on the Youden index) for detecting hypertrophic cardiomyopathy status were as follows: combined cohort = 18%, Bern = 7%, Oxford = 4%, and Seoul = 18%. The optimal probability threshold in the algorithm’s derivation cohort from Mayo Clinic was 11%.
The AI-ECG model had an AUC of 0.922 (95% CI 0.910–0.934) for HCM detection in the combined study cohort. Applying the optimal AI-ECG probability threshold as defined in the derivation cohort (equal to 11%),8 accuracy, sensitivity, and specificity were 86.9, 82.8, and 87.7%, respectively. In the secondary analysis, the optimal AI-ECG HCM probability threshold based on the Youden index was 18% in the combined cohort. Applying this diagnostic threshold, the AI-ECG model had an accuracy of 89.2%, a sensitivity of 80.6%, and a specificity of 90.9%. Detailed performance characteristics and ROC curves are shown in Table 2 and Figure 3, respectively. In another secondary analysis excluding 15 patients with HCM and 104 control patients with prior septal reduction therapy or ventricular pacing, results were very similar (AUC 0.922, accuracy 86.8%, sensitivity 83%, and specificity 87.6%).
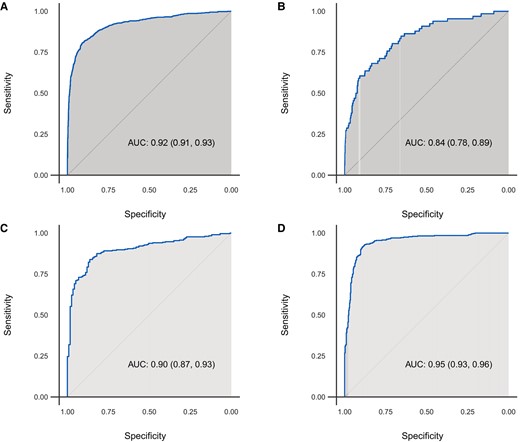
Receiver operating characteristic curves of algorithm performance in the (A) overall, (B) Bern, (C) Oxford, and (D) Seoul cohorts.
Artificial intelligence electrocardiogram model performance metrics by site
| Site | AUC | Optimal probability threshold | Accuracy | Sensitivity | Specificity |
|---|---|---|---|---|---|
| Overall | 0.922 (0.910, 0.934) | 0.11a | 86.9% (85.8%, 87.8%) 4030/4640 | 82.8% (79.9%, 85.4%) 640/773 | 87.7% (86.6%, 88.7%) 3390/3867 |
| 0.18b | 89.2% (88.3%, 90.1%) 4139/4640 | 80.6% (77.6%, 83.3%) 623/773 | 90.9% (90.0%, 91.8%) 3516/3867 | ||
| Bern | 0.835 (0.782, 0.887) | 0.11a | 87.2% (86.0%, 88.3%) 2978/3416 | 62.1% (49.3%, 73.8%) 41/66 | 87.7% (86.5%, 88.8%) 2937/3350 |
| 0.07b | 83.3% (82.0%, 84.5%) 2844/3416 | 68.2% (55.6%, 79.1%) 45/66 | 83.6% (82.3%, 84.8%) 2799/3350 | ||
| Oxford | 0.900 (0.869, 0.931) | 0.11a | 78.4% (74.1%, 82.2%) 330/421 | 73.7% (68.4%, 78.5%) 224/304 | 90.6% (83.8%, 95.2%) 106/117 |
| 0.04b | 84.6% (80.7%, 87.9%) 356/421 | 83.9% (79.3%, 87.8%) 255/304 | 86.3% (78.7%, 92.0%) 101/117 | ||
| Seoul | 0.948 (0.933, 0.964) | 0.11a | 89.9% (87.6%, 91.9%) 722/803 | 93.1% (90.1%, 95.3%) 375/403 | 86.8% (83.0%, 89.9%) 347/400 |
| 0.18b | 90.4% (88.2%, 92.4%) 726/803 | 91.6% (88.4%, 94.1%) 369/403 | 89.2% (85.8%, 92.1%) 357/400 |
95% confidence intervals are shown in parentheses.
aOptimal AI-ECG probability threshold as defined in the algorithm derivation cohort.
bArtificial intelligence electrocardiogram probability threshold as optimized for each cohort using the Youden index method.
In subgroup analyses, AI-ECG model performance was overall better in females compared with males with respective AUCs 0.94 (95% CI 0.92–0.96) and 0.91 (95% CI 0.90–0.93) (P = 0.01) (Figure 4). Also, AUC and sensitivity were higher for patients with apical vs. non-apical HCM, but there were no differences between other examined subgroups (Figure 5).
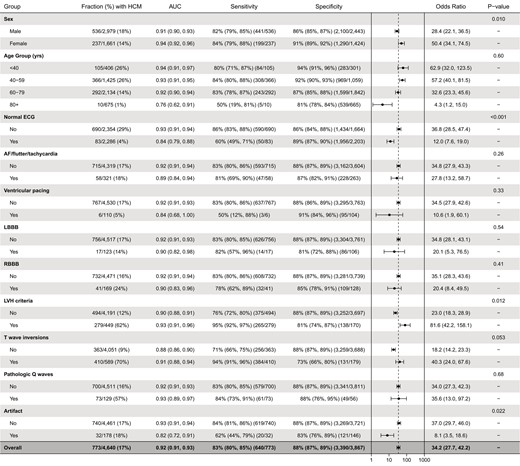
Algorithm performance in age, sex, and electrocardiogram feature subgroups. P-values for within-subgroup comparisons of area under the receiver operating characteristic curves are derived with the DeLong’s test.
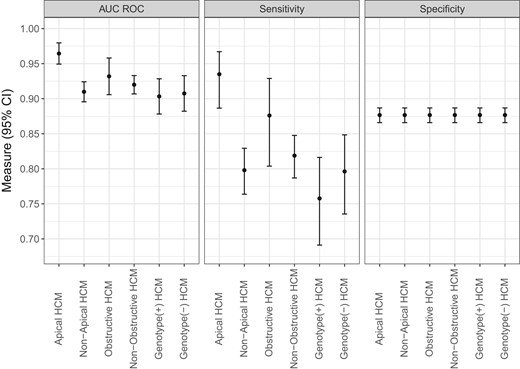
Subgroup performance according to hypertrophic cardiomyopathy characteristics. Results are shown for algorithm performance in each defined subgroup of patients with hypertrophic cardiomyopathy vs. the entire control population. Significant difference in algorithm performance existed only for the apical vs. non-apical hypertrophic cardiomyopathy subgroups. Note that specificity values are identical in the examined subgroups because the control non-hypertrophic cardiomyopathy group is the same across these subgroups.
In an age- and sex-matched analysis (case–control ratio 1:2), a total of 773 patients with HCM and 1546 control patients were included. In this cohort, the AUC of the AI-ECG model was 0.921 (95% CI 0.909–0.934) with accuracy 88.5%, sensitivity 82.8%, and specificity 90.4%, similar to the performance in the non-matched population.
Cohort-specific artificial intelligence electrocardiogram results
The median (IQR) AI-ECG probabilities of HCM for patients with HCM were 29% (2–88%) in the Bern cohort, 72% (10–95%) in the Oxford cohort, and 91% (62–99%) in the Seoul cohort. In comparison, AI-ECG probabilities of HCM for control subjects were 0.2% (0.04–0.2%), 0.2% (0.04–0.1%), and 0.4% (0.1–3%) in the same cohorts, respectively (Figure 2). In site-specific analyses, the AUCs ranged from 0.835 to 0.948. Using the original optimal probability threshold (equal to 11%), sensitivity ranged from 62.1 to 93.1%, while specificity showed lower variation ranging from 86.8 to 90.6% across sites (Table 2 and Figure 3).
Electrocardiogram morphology assessment
Compared with control patients, the HCM group had lower prevalences of normal ECGs and ventricular pacing and higher prevalences of RBBB, LVH, TWIs, and pathologic Q waves (Table 3). There were no statistically significant differences between the two groups in the frequency of AF, LBBB, or ECG tracing artefact. In subgroup analyses defined by these features (Figure 4), the AI-ECG algorithm demonstrated statistically superior performance for HCM detection among abnormal vs. normal ECGs (AUC 0.93 vs. 0.84, P < 0.001), ECGs with vs. without LVH (AUC 0.93 vs. 0.90, P = 0.012), and ECGs without vs. with artefact (AUC 0.93 vs. 0.82, P = 0.022). For ECGs with TWIs, there was a trend towards superior performance compared with ECGs without TWIs (AUC 0.91 vs. 0.88, P = 0.053). No differences in algorithm performance were noted according to the presence of atrial arrhythmia, ventricular pacing, LBBB, RBBB, or pathologic Q waves.
Electrocardiogram characteristics in the hypertrophic cardiomyopathy and control groups
| Patients with HCM (n = 773) | Controls (n = 3867) | Total (n = 4640) | P-value | |
|---|---|---|---|---|
| Normal ECG | 83 (10.7%) | 2203 (57%) | 2286 (49.3%) | <0.001 |
| Atrial fibrillation/flutter/tachycardia | 58 (7.5%) | 263 (6.8%) | 321 (6.9%) | 0.48 |
| Ventricular pacing | 6 (0.8%) | 104 (2.7%) | 110 (2.4%) | <0.001 |
| LBBB | 17 (2.2%) | 106 (2.7%) | 123 (2.7%) | 0.46 |
| RBBB | 41 (5.3%) | 128 (3.3%) | 169 (3.6%) | 0.011 |
| LVH criteria | 279 (36.1%) | 170 (4.4%) | 449 (9.7%) | <0.001 |
| T-wave inversions | 410 (53.0%) | 179 (4.6%) | 589 (12.7%) | <0.001 |
| Pathologic Q waves | 73 (9.4%) | 56 (1.4%) | 129 (2.8%) | <0.001 |
| Tracing artefact | 32 (4.1%) | 146 (3.8%) | 178 (3.8%) | 0.61 |
P-values result from a Wilcoxon rank-sum test (continuous variables) or Fisher’s exact test (categorical variables).
AF, atrial fibrillation; LBBB, left bundle branch block; RBBB, right bundle branch block; LVH, left ventricular hypertrophy.
Normal ECG: sinus rhythm, 50–110 b.p.m., normal intervals, sinus arrhythmia acceptable; bundle branch blocks: complete (QRS >120 ms); LVH per Sokolow–Lyon criteria: S-wave depth in V1 + tallest R-wave height in V5––V6 (whichever is larger) >35 mm; TWIs: inferior or lateral ≥0.1 mV in ≥2 contiguous leads (in those without BBB); pathologic Q waves: ≥1/3 of R-wave or ≥0.3 mV in ≥2 contiguous inferior or lateral leads; artefact: tracing distortion that could interfere with ECG interpretation in the reviewer’s opinion [high-frequency noise, baseline wander, disconnected lead(s), combinations].
Discussion
We report one of the initial attempts for external validation of an AI-ECG algorithm for detecting HCM from the standard 12-lead ECG. The main findings of our study are as follows: (i) overall AI-ECG performance was favourable with an AUC of 0.92, a sensitivity of ∼83%, and a specificity of approximately 88% in the merged cohort, with similar performance noted in an analysis using age and sex matching for cases and controls; (ii) AI-ECG diagnostic performance was good in all sites though site-level variations were present, particularly for sensitivity; (iii) AI-ECG performance was statistically superior in females and those with any ECG abnormality present, including also presence of ECG criteria for LVH; and (iv) ECG tracing artefact was significantly associated with lower AI-ECG algorithm performance, suggesting variability of the tracing quality may have at least partly contributed to the model performance variations across sites.
This study is one component of the validation efforts of the Mayo Clinic AI-ECG HCM algorithm, including a previous study in paediatric patients with HCM where the algorithm demonstrated excellent discrimination performance9 and an internal validation where the algorithm was applied in tandem with clinical factors to optimize detection of new HCM cases in routine clinical practice.12 External validation is essential to rigorous evaluation and ultimate adoption of diagnostic and prognostic AI-based tools.13 In this multicentre study compiling primary ECG data, an AI-ECG algorithm that was developed in a single-centre tertiary care North American cohort performed favourably in patients from geographically diverse institutions in Europe and Asia. This evidence of external validity suggests that the model can be generalized to populations with distinct differences compared with the development cohort. For example, the development cohort consisted of many patients with severe HCM phenotype referred for septal reduction therapies and a low prevalence of apical HCM (<10%).8 The current results demonstrate the validity of the AI-ECG algorithm in cohorts with a lower prevalence of obstructive HCM and a higher prevalence of apical HCM, though it is also noteworthy that AI-ECG-estimated probabilities were not significantly different in patients with obstructive and non-obstructive HCM phenotypes. Furthermore, the demonstration of excellent model performance in a predominantly Asian cohort from South Korea with an AUC of 0.95 is reassuring since only a tiny minority of patients in the derivation cohort self-reported as Asian. Another important finding is the superior diagnostic performance in females when compared with males, a trend previously also observed in the algorithm derivation study. Artificial intelligence electrocardiogram may help address the challenges of delayed diagnosis that potentially leads to worse outcomes of HCM in females.14
Our validation data offer insights into cohort-specific variations of diagnostic performance. Overall diagnostic performance was high in the combined and in the individual cohorts. The relatively lower sensitivity noted in the Bern and Oxford cohorts compared with the Seoul cohort may be attributed to several reasons. The validation cohorts are distinct from the derivation cohort in terms of geographic origin, clinical practice patterns, and HCM phenotypes. Thus, variation in diagnostic performance is to be expected as with any external validation.15 Further, specifically in the Bern cohort, patients were older and there was a higher prevalence of other cardiovascular comorbidities such as coronary disease, AF, stroke, and systolic LV dysfunction which may have confounded AI-ECG performance. Yet, other known or unknown cohort characteristics may weigh more heavily on diagnostic performance than can be easily deduced. Further, we did not re-adjudicate cases and controls for the validity of their HCM and non-HCM status, respectively. Establishing the diagnosis of HCM carries a degree of subjectivity and site-specific diagnostic thresholds for HCM vs. non-HCM hypertrophy, and also, the use of cardiac magnetic resonance imaging for HCM diagnosis may vary. Finally, differences attributable to the different ECG vendors utilized across sites cannot be ruled out.
In a prior investigation of AI-ECG-based detection of HCM, external cross-validation of CNN models among four academic medical centres in the USA and Japan produced AUCs similar to those observed in our study, though notably the model trained in the Japanese cohort demonstrated lower performance when tested in the US cohorts.16 However, when models were trained with a federated learning approach, overall discrimination improved significantly. In the same study, the AI-ECG HCM model trained by federated learning achieved much higher sensitivities (98%) compared with expert review of ECGs by three different cardiologists (73–81%) in detecting any ECG abnormality.
In a recent explainability analysis using saliency maps, we demonstrated that the ventricular repolarization segment of the ECG is the main driver of our algorithm’s determination of HCM status.17 In this validation study, we performed subgroup analyses of ECG features associated with algorithm performance. The presence of ECG artefact had a strong association with false AI-ECG result. In order to follow a most inclusive, real-world approach to ECG interpretation, we did not pre-select or exclude ECGs based on quality. However, it is increasingly recognized that implementation of ECG tracing quality control and potentially refiltering/pre-processing will be important to optimizing performance and reducing the risk of misleading results in the large-scale application of AI-ECG tools.18,19 Unsurprisingly, the presence of electrocardiographic LVH was associated with superior algorithm performance, while performance was slightly lower, yet still favourable, with an AUC of 0.84 among completely normal ECGs supporting the notion that this algorithm can raise suspicion and ultimately lead to HCM diagnosis even when no ECG abnormalities are evident. The original derivation work had excluded ECGs with LBBB and ventricular pacing,8 yet algorithm performance was not significantly lower among the small samples of ECGs with BBBs or ventricular pacing in this study. However, if applied as a screening tool, HCM with concomitant LBBB or ventricular pacing at the time of diagnosis is seldom if ever seen.
This study included patients undergoing ECG for clinical indications in routine practice. The utility of HCM screening in asymptomatic individuals is yet unknown. In epidemiologic studies, HCM prevalence in the general population is estimated as ∼1:200 to 1:50020,21 However, only a fraction of those HCM diagnoses come to attention, usually as a result of symptoms, family screening, or incidental findings.2 Early diagnosis could reduce HCM-related morbidity and mortality by allowing clinicians to implement disease surveillance, SCD risk stratification, and cascade family screening. Electrocardiogram screening in adolescents and young adults is of particular interest. Hypertrophic cardiomyopathy is one of the most common identifiable causes of SCD in young athletes.22,23 However, ECG criteria for HCM detection have shown variable performance and the risk of false positives and subsequent over-testing are concerning.24,25 A fully automated, agnostic, and accurate AI tool leveraging the ubiquitous 12-lead ECG without relying on a priori defined ECG features may lead to improved diagnosis of HCM by directing cardiac imaging to subjects with a high AI-ECG-indicated risk. Due to a relatively low HCM prevalence in unselected general populations, the algorithm’s positive predictive value (PPV) could be low (<10%) when utilizing binary AI-ECG HCM probability cutpoints geared towards an optimal balance of sensitivity and specificity. However, as shown in our derivation study, the PPV is highly dependent on the operating probability cutpoint.8 Raising this probability cutpoint to increase specificity and PPV would be appropriate in a screening application of the algorithm. Reduction of false positive rates could also be achieved by applying the AI-ECG score in conjunction with clinical risk models to identify patients with a higher pre-test probability of HCM.12 The fusion of deep learning analyses of ECG and echocardiogram data may further augment the accuracy of HCM detection as recently proposed.26
Another potential application of such an algorithm is the diagnostic stratification of patients undergoing ECG for any indication in routine clinical practice, with or without HCM symptoms. A diagnostic approach including AI-ECG and conventional clinical factors may help guide dedicated cardiac imaging to establish or rule out HCM.12 The concept of treatment response monitoring with AI-ECG in patients receiving targeted HCM therapies was also recently demonstrated in a clinical trial cohort of mavacamten which was approved for obstructive HCM in the USA in 2022.27 Longitudinal monitoring of HCM therapies could be accomplished by a serial AI-ECG analysis of standard ECGs or patient-operated, home-based ECG recording devices. Further, our AI-ECG HCM tool may be useful for screening of first-degree relatives of affected HCM family members, relatives of patients with sudden death of unknown aetiology, and athletes. These groups require further study.
Limitations
Our study has limitations. First, we had a low prevalence of Black patients with HCM in the included cohorts. Generally, Black patients comprise a small portion (<10%) of international HCM cohorts which may be attributable to differences in disease expressivity and genetic architecture of HCM across races, but also due to inequities of care and underrecognition of the disease in Black patients.28,29 It is also known that LVH is more prevalent in African-Americans, ECG features of LVH differ by race,30,31 and conventional ECG criteria may result in over-referral for suspected cardiac abnormalities in Black athletes.24 The performance of this AI-ECG HCM algorithm in Black patients as well as other underrepresented ethnic/racial subgroups and geographies requires further study. Second, it was not feasible to obtain consecutive control groups inclusive of all patients with non-HCM seen at each site, though it should be emphasized that the control groups were not selected for specific characteristics. Similarly, detailed comorbidity information for the control groups was not available, but the subgroup analyses based on several ECG features presented herein provide insights into algorithm performance across distinct ECG phenotypes. The control groups are representative of patients encountered in routine practice at each institution. From a clinical perspective, this algorithm should ideally be able to distinguish HCM from non-HCM LVH in patients with potential confounding conditions, such as hypertension or aortic stenosis, and this is a focus of further investigation. Finally, the HCM cohorts across the three sites were heterogeneous likely reflecting variations in clinical practice patterns and inherent phenotypic differences across distinct geographic origins, while it should also be noted that we only included patients with available research authorization and digital ECG files which may be partly driving cohort characteristics. Further, a contribution of diagnostic ascertainment bias cannot be fully excluded, particularly due to the retrospective nature of the study. Nevertheless, the algorithm’s favourable performance across these heterogeneous cohorts is also suggestive of its robustness.
Conclusion
In this multicentre, international case–control study, we externally validated a previously developed deep learning AI algorithm for the detection of HCM from the standard 12-lead ECG. These data provide insights to guide the effective implementation of this and other AI-ECG algorithms in geographically and racially diverse cohorts. Future prospective efforts are needed to investigate the value of this algorithm in facilitating detection of HCM in the general population and in specific subgroups within healthcare environments.
Funding
Funding support for data management and statistical analyses was provided by the Department of Cardiovascular Medicine, Mayo Clinic, Rochester, MN, USA.
Data availability
The individual patient data underlying this article cannot be shared publicly due to intellectual property restrictions. However, certain raw data may be shared on reasonable request to the corresponding author.
References
Author notes
Conflict of interest: P.A.F., Z.I.A., P.A.N., M.J.A., and K.C.S. are co-inventors of the HCM AI-ECG algorithm. Mayo Clinic has licensed the algorithm to Anumana, Inc., with potential for commercialization. K.C.S. has received research funding from Anumana, Inc., for work related to the HCM AI-ECG algorithm (via the institution). M.J.A. is also a consultant for Abbott, Boston Scientific, Bristol Myers Squibb, Daiichi Sankyo, Invitae, LQT Therapeutics, and Medtronic. M.J.A. and Mayo Clinic also have licensing agreements with AliveCor, ARMGO Pharma, Pfizer, and UpToDate. S.W. reports research, travel, or educational grants to the institution from Abbott, Abiomed, Amgen, Astra Zeneca, Bayer, Biotronik, Boehringer Ingelheim, Boston Scientific, Bristol Myers Squibb, Cardinal Health, CardioValve, Corflow Therapeutics, CSL Behring, Daiichi Sankyo, Edwards Lifesciences, Guerbet, InfraRedx, Janssen-Cilag, Johnson & Johnson, Medicure, Medtronic, Merck Sharp & Dohm, Miracor Medical, Novartis, Novo Nordisk, Organon, OrPha Suisse, Pfizer, Polares, Regeneron, Sanofi-Aventis, Servier, Sinomed, Terumo, Vifor, and V-Wave. He serves as advisory board member and/or member of the steering/executive group of trials funded by Abbott, Abiomed, Amgen, Astra Zeneca, Bayer, Boston Scientific, Biotronik, Bristol Myers Squibb, Edwards Lifesciences, Janssen, MedAlliance, Medtronic, Novartis, Polares, Recardio, Sinomed, Terumo, V-Wave, and Xeltis with payments to the institution but no personal payments. He is also a member of the steering/executive committee group of several investigator-initiated trials that receive funding by industry without impact on his personal remuneration. B.R. is funded by the BHF Oxford Centre of Research Excellence (RE/18/3/34214). S.N. acknowledges support from the Oxford NIHR Biomedical Research Centre and the Oxford British Heart Foundation Centre of Research Excellence.
