


Abstract
Non-invasive remote patient monitoring is an increasingly popular technique to aid clinicians in the early detection of worsening heart failure (HF) alongside regular follow-ups. However, previous studies have shown mixed results in the performance of such systems. Therefore, we developed and evaluated a personalized monitoring algorithm aimed at increasing positive-predictive-value (PPV) (i.e. alarm quality) and compared performance with simple rule-of-thumb and moving average convergence-divergence algorithms (MACD).
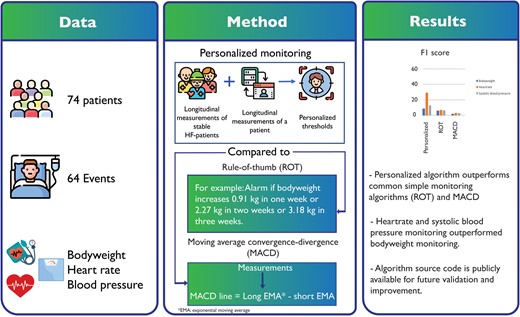
In this proof-of-concept study, the developed algorithm was applied to retrospective data of daily bodyweight, heart rate, and systolic blood pressure of 74 HF-patients with a median observation period of 327 days (IQR: 183 days), during which 31 patients experienced 64 clinical worsening HF episodes. The algorithm combined information on both the monitored patients and a group of stable HF patients, and is increasingly personalized over time, using linear mixed-effect modelling and statistical process control charts. Optimized on alarm quality, heart rate showed the highest PPV (Personalized: 92%, MACD: 2%, Rule-of-thumb: 7%) with an F1 score of (Personalized: 28%, MACD: 6%, Rule-of-thumb: 8%). Bodyweight demonstrated the lowest PPV (Personalized: 16%, MACD: 0%, Rule-of-thumb: 6%) and F1 score (Personalized: 10%, MACD: 3%, Rule-of-thumb: 7%) overall compared methods.
The personalized algorithm with flexible patient-tailored thresholds led to higher PPV, and performance was more sensitive compared to common simple monitoring methods (rule-of-thumb and MACD). However, many episodes of worsening HF remained undetected. Heart rate and systolic blood pressure monitoring outperformed bodyweight in predicting worsening HF. The algorithm source code is publicly available for future validation and improvement.
Introduction
Non-invasive remote patient monitoring (RPM) technologies offer a promising strategy for reducing unplanned hospitalizations, which is common among recently discharged heart failure (HF) patients.1–4 Typically, simple algorithms are used to track those daily measurements alongside usual outpatient clinic care. For example, rule-of-thumb algorithms suggest alerting on an increase of more than 0.9 kg in one day as a sign of HF deterioration5 which is in accordance with the European Society of Cardiology (ESC) and the Heart Failure Association of America (HFSA).6 However, previous studies demonstrated a poor sensitivity and a high false alarm rate in detecting worsening HF using rule-of-thumb algorithms for monitoring HF patients.7,8
Therefore, several studies have sought to provide more advanced algorithms or include blood pressure (BP) and heart rate (HR) to improve the performance.9,10 These studies reported that data-driven approaches to monitor trends in bodyweight (BW), HR, and systolic blood pressure (SBP) outperform rule-based approaches in predicting worsening HF and show high sensitivity and specificity, ranging from 53% to 92%. While these studies have considerably advanced HF prediction in non-invasive telemonitoring systems, the quality of the alarms, reflected by the positive predictive value (PPV), remains low. PPV denotes the percentage of true alarms among all alarms raised and ranged from 1.4% to 8.6%.7,11 As an example, consider a PPV of 5%. A PPV of 5% reflects one out of every 20 alarms is a true alarm. With this level of PPV, raising alarms potentially comes with the risk of causing alarm fatigue and reduced alarm reliability.12
To improve PPV, we propose a novel personalized algorithm in which we provide patient-tailored thresholds and enable monitoring to start immediately by combining short segments of longitudinal measurements of ‘stable HF patients’ (i.e. patients who have been diagnosed with heart failure but are managing their condition effectively without any diuretics increase or admission due to worsening HF episodes) and patient-specific intense longitudinal data using statistical shrinkage principles. Short segments of longitudinal information from ‘stable HF patients’ provide an approximate threshold; overtime, as more data come in, this threshold is updated and increasingly personalized using a linear mixed-effect (LME) model and statistical process control chart (SPC). The LME model estimates a patient-specific mean for each biometric value combining information on both the monitored patient and stable HF patients. The SPC provides a set of personalized thresholds based on the observed variation in the difference between the patient-specific expected (i.e. mean) value and observed value. Updating thresholds allows personalization to the extent supported by the patient’s data. The algorithm is sufficiently flexible for patients under treatment as the continuous updating process additionally enables the algorithm to recalibrate itself after a worsening HF.
In this study, the personalized algorithm is evaluated using a case study of real-world retrospective data of HF patients and compared with two commonly used algorithms.
Methods
Case study
The current case study involves telemonitoring data collected from patients with chronic HF at two centres. All included patients are in secondary or tertiary care, and the two centres served as the primary point of contact for these patients. The local ethics committee approved the study of both the University Medical Centre Utrecht (UMCU), the Netherlands, and the Diakonessen Hospital in Utrecht (DIAK) and was conducted in accordance with Good Clinical Practice and the 2002 Declaration of Helsinki. Participating patients used the EMPOWER telemonitoring system (24Care, Huizen, The Netherlands) starting in November 2017 with a follow-up in March 2021 in one of the two participating hospitals and provided written informed consent to use their data for research purposes. The EMPOWER system deploys automatic transmission of BW, BP, and HR using Bluetooth-enabled hardware to a remote web server. A nurse and cardiologist determined a fixed patient-specific threshold for each patient, which may have changed over time. Patients were given instruction, emphasizing self-care, with early reporting of symptoms. It is important to note that the EMPOWER thresholds are not related to or informed by personalized algorithm we developed in any way. Patients were included if diagnosed with heart failure and had been hospitalized for worsening HF in the past 12 months. Exclusion criteria were: age younger than 18 years, and the total number of daily measurements (in the study period) below 100 for each biometric value. The number of 100 measurements was chosen as this corresponds to the set calibration period, needed to convergence to accurate estimates of the patient-specific parameters of the model (e.g. residual of the model varies around zero; see below).
Patients were asked to measure BW, HR, and BP every day at the same time, preferably before breakfast, after emptying their bladders, wearing no clothing or underwear and shoes. The measurements were automatically transferred and stored securely. If a measurement crossed a manually pre-set threshold, the patient was instructed to contact the hospital. Baseline characteristics and endpoints were manually retrieved from the electronic health record.
Personalized algorithm
Below, we provide a summary of the steps in the personalized algorithm. A more elaborate exposé can be found in Supplementary material online, Appendix S1 and implementation of the algorithm in R is made publicly available at.13
The novel personalized algorithm consists of three steps: (i) estimation of the overall regular longitudinal pattern in stable HF patients, (ii) prediction of the expected biometric values for each patient and the time point given a stable condition, and (iii) screening of irregular observations. In step I, the ‘stable’ longitudinal pattern of each biometric value was obtained using linear mixed effects (LME) modelling on a group of ‘stable HF patients’. The ‘stable HF patients’ included 43 HF patients selected from the patient cohort who were not admitted to the hospital due to worsening HF nor had diuretics increased. We assumed that the group of ‘stable HF patients’ provides an accurate mean and variance estimation of HF patients when they are following routine life without any HF deterioration. In step II, the algorithm predicts a dynamic patient-specific biometric value for monitoring patients who have been admitted due to worsening HF or diuretics increase. Predictions are obtained from the LME model, which combines information on real-time measurements of the monitored patient and short segments of longitudinal measurements (n = 10 measurements per patient) of the ‘stable-patient’ group. As time proceeds, the model parameters depend increasingly on the monitored patient-specific measurements.
In step III, obtained predictions from step II were subtracted from the real-time patient-specific longitudinal data. These values are representing how much a new measurement deviates from the predicted value at each time point. To detect both small and large deviations from stable situations of patients, the algorithm discriminates between more recent measurements and the older ones with a smoothing procedure. For this purpose, differenced values are smoothed using the exponentially weighted moving average (EWMA) approach first. We utilized EWMA to mitigate the effect of noise in our data. This particular method was chosen because it places greater weight on recent observations compared to other smoothing methods. As a result, EWMA enables more rapid detection of changes in the data compared to alternative smoothing techniques. Then, the lower-control-limit (LCL) and the upper-control-limit (UCL) are obtained using an EWMA control chart (see Supplementary material online, Appendix S1). In case these smoothed values exceed defined thresholds (except for BW for which we considered UCL only), the algorithm triggers an alarm as a sign of HF deterioration.
During a calibration period of 100 measurements (during which alarms were already triggered), parameter estimates would be updated with each incoming observation to convergence to accurate estimates of the patient-specific parameters of the model (e.g. residual of the model varies around zero). After the calibration period, patient-specific parameters were fixed over time, but were recalibrated when a hospitalization or diuretics increase occurs. Results from analyses over varying durations of the calibration period are presented in the appendix, indicating that 100 measurement is an optimal choice for the personalized algorithm. An illustration of how the algorithm operates for each biometric value is provided in Figure 1.
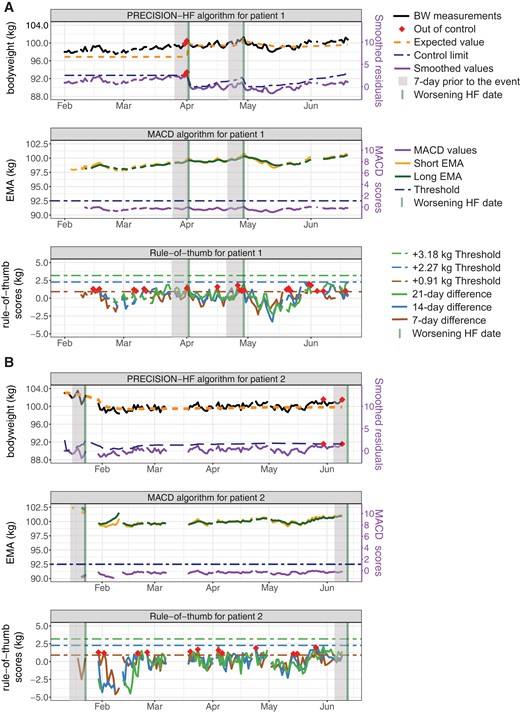
Control limits and out-of-control measurements for two patients when single monitoring of bodyweight is considered. Panel A) comparison of the personalized algorithm, moving average convergence-divergence algorithms algorithm, and rule-of-thumb for patient 1, and panel B) for patient 2, respectively. The rule-of-thumb for this comparison is: an increase of 0.91 kg in 1 week, 2.27 kg in 2 weeks, or 3.18 kg in 3 weeks. One-week before worsening HF is visualized by a shaded grey area. Note that in both patients 1 and 2, only one out of two events is detected when monitoring bodyweight. Alarms are triggered in 3 days, and 1- and 3 days before the detected event for patients 1 and 2, respectively.
Algorithm used for benchmarking
The personalized algorithm was compared to two types of algorithms based on their ability to predict the clinical deterioration of HF. The first type was simple rule-of-thumb algorithms that are extensively reported in the literature.2,5,7,14 These algorithms are based on subtracting the current measurement from a previous measurement that occurred a predefined number of days in the past.15 If this difference exceeds a predefined threshold, the algorithm triggers an alarm. Table 1 shows the rule-of-thumb algorithms that we used in our study as a comparison.
Rule-of-thumb algorithm considered for the comparison
| Bodyweight | Heart rate | SBP |
|---|---|---|
| +0.91 kg in 1w or + 2.27 kg in 2w or +3.18 kg in 3w | <50 BPM or >100 BPM | <100 or drops by 20 mmHg from the previous reading |
| +1 kg in 1d or +2 kg in 2d or −3 kg in 1d and ±2 kg from the baseline | <50 BPM or >80 BPM | <90 or >140 mmHg |
| ± 1.36 kg from the baseline | <55 BPM or >120 BPM | <90 or >180 mmHg |
Kg: kilogram; w: week(s); d: day(s); bpm: beats per minute; SBP: systolic blood pressure
The second type was a moving average convergence-divergence algorithm (MACD).8,15 This algorithm calculates the difference between two exponentially weighted moving averages (EMA), namely short and long-time spans (see Supplementary material online, Appendix S1). The MACD algorithm does not consider noise in the measurements, and it is sensitive to trends instead of short increases. Similar to rule-of-thumb algorithms, it triggers an alarm once the MACD line exceeds a predefined threshold.
Primary endpoint
The primary endpoint of the study was worsening HF. Worsening HF was defined as any unplanned hospital admission due to worsening HF complaints or an increase in diuretics dose prescribed to prevent decompensation, as described by Greene et al.16 Marked episodes of HF deterioration were verified manually by the research team. All other hospital admissions unrelated to this condition have been disregarded for the purpose of analysis.
Statistical analysis and evaluation
Statistical analysis was performed using R (v.4.2.0), and a significance level of 0.05 was used. The Shapiro–Wilk test was used for normality assumption for numerical data, and the continuous variables the mean and standard deviation were considered. Categorical variables were expressed as numbers or percentages. For statistical comparison of categorical variables, the χ 2 test was used, the independent t-test for continuous variables in the case of normal distributions, and the Mann–Whitney U-test in the case of skewed distributions.
The algorithms were compared based on their performance when monitoring either BW, HR, or BP. Each algorithm independently monitored each of these biometric values separately. For each subject, the total observation period was split into weeks, counting backward (each time) before worsening HF was observed or from the last measurement in the patient’s dataset. An alarm was considered ‘true’ when it occurred within 7-days before worsening HF (similar to Ledwidge et al. and Greene et al. 7,17) Alarms generated outside this time frame were considered as false alarms. Observations that occurred within 7-days after worsening HF were discarded in order to allow biometric measurements to return to the baseline. Weeks having fewer than three observations (<60% of expected observation points) were considered incomplete and excluded from evaluation.
For the weekly binned data, the predictive performance of the algorithm was assessed using PPV, sensitivity, specificity, and F1. PPV [true positive/(true positive + false positive)] represents the fraction of true alarms among all alarms triggered and provides information on the quality of the raised alarms. Sensitivity [true positive/(true positive + false negative)] represents the fraction of events detected among all events, and thus, provides information on the quantity of events detected. Specificity (true negative/true negative + false positive) represents the proportion of true negative identified by the model, quantifying model performance on detecting healthy measurements. F1, also known as the F1 score, is a metric used to evaluate the performance of a classification model. It is a measure of the balance between PPV and sensitivity. The F1 score combines these two metrics into a single value, providing an overall assessment of the model’s performance. The F1 score is calculated as the harmonic mean of PPV and sensitivity (Eq. 1). It ranges from 0 to 1, where 1 indicates perfect PPV and sensitivity, and 0 indicates poor performance.
To compare the performance of the personalized algorithm with other algorithms statistically, we have used DeLong test.18 The test is used for comparing the performance of two models based on the receiver operating characteristic (ROC) curves. It evaluates the null hypothesis that there is no difference in the areas under the ROC curves (AUC) of the two models, meaning their performance is essentially the same.
Hyperparameter optimization
Both the MACD and the personalized algorithms were optimized regarding their18 modifiable parameters. For monitoring BW with the MACD algorithm, the long-term window size representing the number of days over which the long-term average should be applied was varied between 5 and 50 days with steps of one day, while the short-term was varied between 2 and 10 days with steps of one day. The threshold for worsening HF detection varied from 1 kg with steps of 0.5 kg. In the personalized algorithm, the following parameters require tuning: coefficient of the width of control limits in part II of the algorithm, ranged between 1 and 6, and in part III ranged between 1 and 9 in increments of 0.5. The smoothing parameter in the EWMA approach was varied between 0.2 and 0.8 with an increase of 0.2 at each run.
In optimizing algorithms designed to detect an event, in our case worsening HF, there is always a trade-off between sensitivity (i.e. the amount of worsening HF instances that are detected), PPV (i.e. the quality of the alarm raised: how many of the alarms signal a worsening HF instance and how many are false alarms), and false-positive alarm rate per patient per year. As such, we evaluated our novel algorithm for two iterations, algorithm S which is optimized for sensitivity, and algorithm P which is optimized for PPV, respectively.
Results
Patient outcomes
Out of 90 patients, 16 patients were excluded from the analysis for the following reasons: 14 patients had fewer than 100 total observations, one patient only measured BW, and one patient had fewer than three observations in a week before its only case of worsening HF. In total, 74 patients were included for analysis with 64 worsening HF instances occurred in 31 patients, of whom 19 were unplanned admissions, and 45 had an increase in diuretic dose. In total, 1516 weeks were evaluated after the exclusion of those with missing values (11 weeks). The average number of measurement days per patient was 279 128 days. The median value of missing rate for the included patients in the ‘stable HF group’ and monitored patients were 13% and 17.5%, respectively. One patient received a left ventricular assist device, two patients received a heart transplant and three patients died shortly after using the EMPOWER system. Baseline characteristics of patients are provided in Supplementary material online, Table S1.
PPV and sensitivity of the simple and the personalized algorithms
The PPV-sensitivity curves depicted in Figure 2 are generated by utilizing the various parameter settings for the personalized and MACD described in Section 2.5. Table 2 reports sensitivity, PPV, specificity, accuracy, AUC, F1 score, true positives, false positives, true negatives, false negatives, and false-positive alarm rate (FAR) per patient per year of the proposed approach for algorithms S (optimized for Sensitivity) and P (optimized for PPV). Each algorithm monitored each biometric value separately.
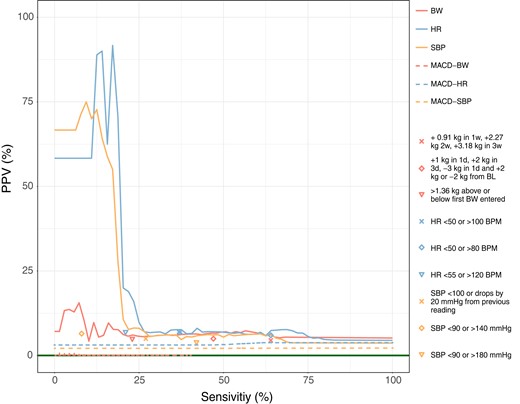
Positive-predictive-value-sensitivity curves for bodyweight, heart rate, and systolic blood pressure measurements for the personalized and moving average convergence-divergence algorithms algorithms are depicted with solid lines. The points represent the different rule-of-thumb algorithms considered. BL is an abbreviation for baseline. The solid horizontal line in dark green represents the random performance level and was obtained by dividing 64 worsening heart failure episodes by 1516, a number of weeks that algorithms evaluated, and is equal to 4.22%.
Sensitivity, positive-predictive-value, specificity, accuracy, AUC, TP, FP, TN, FN, and FAR for single biometric monitoring of bodyweight, heart rate, and systolic blood pressure
| Algorithm P | Algorithm S | |||||
|---|---|---|---|---|---|---|
| Bodyweight | Heart rate | Systolic blood pressure | Bodyweight | Heart rate | Systolic blood pressure | |
| Sensitivity | 7.0 | 17.0 | 9.0 | 57.0 | 69.0 | 61.0 |
| Positive-predictive-value | 15.7 | 91.7 | 75.0 | 7.3 | 7.6 | 6.4 |
| Specificity | 93.0 | 99.9 | 91.0 | 67.0 | 63.0 | 60.0 |
| Accuracy | 73.8 | 76.8 | 96.0 | 66.0 | 63.2 | 60.5 |
| AUC | 52.6 | 59.0 | 54.6 | 61.1 | 60.0 | 60.0 |
| F1 | 8.6 | 28.9 | 25.6 | 9.8 | 13.1 | 8.5 |
| TP | 4 | 11 | 6 | 36 | 44 | 39 |
| FP | 25 | 1 | 2 | 480 | 538 | 582 |
| TN | 1427 | 1451 | 1450 | 972 | 914 | 870 |
| FN | 60 | 53 | 58 | 28 | 20 | 25 |
| FAR | 0.020.06 | 0.00 ± 0.01 | 0.01 ± 0.01 | 0.32 ± 0.12 | 0.35 ± 0.10 | 0.38 ± 0.11 |
| DeLong test p-value (comparing with rule-of-thumb)a | <0.01 | <0.01 | 0.01 | |||
| DeLong test p-value (comparing with moving average convergence-divergence) | <0.01 | <0.01 | <0.01 | |||
AUC: area under the ROC curve; TP: true positive, FP: false positive, TN: true negative, FN: false negative, FAR: false-positive alarm rate per patient per year, DeLong test P-value (comparing the AUC of the personalized and benchmark algorithm for each biometric measurement).
aFor DeLong tests the whole area under receiver operator curves is considered, resulting in one combined P-value for both algorithms P and S.
Monitoring HR using the personalized algorithm optimized for PPV (algorithm P), resulted in high PPV (91.7%), meaning that about 92.0% of alarms raised were true alarms. At this level of PPV, the algorithm succeeded to detect 17.0% of worsening HF episodes. The related F1 score was 28.9%. When monitoring only SPB, the results showed a PPV of 75.0%, sensitivity of 9.0%, and an F1 score of 25.6%. For BW monitoring, the highest attainable PPV (15.7%) was lower than SBP and HR while detecting only 7.0% of the worsening HF episodes with an F1 score of 8.6%. Monitoring using the personalized algorithm resulted in a high level of specificity for all biometric values, which indicates that the algorithm correctly identified a large fraction of the negative cases (93.0%, 99.9%, and 91.0% for BW, HR, and SBP, respectively). Among the biometric values, SBP outperformed BW and HR in terms of accuracy, showing the highest percentage of correctly predicted measurements out of all measurements. The expected number of false positive per patient per year was lower for HR than SBP, and BW (0.00, 0.01, and 0.02, respectively).
Zooming in on the personalized algorithm performance optimized for sensitivity (algorithm S), monitoring HR resulted in detecting 69.0% of the worsening HF episodes, however only obtaining a PPV of 7.6% with F1 score of 13.1%. Successfully able to detect 61.0% and 57.0% of worsening HF, SBP, and BW had a PPV value of 6.4% and 7.3%, respectively. When comparing the F1 scores, the results were 8.5% for SBP and 9.8% for BW. Highest accuracy (66.0%) and specificity (67.0%) were obtained using BW monitoring. At this level, FAR was lower for BW (0.32) in comparison to HR (0.35) and SBP (0.38). HR and SBP monitoring resulted in a specificity of 63.0% and 60.0%, respectively. Table 2 presents the P-values obtained from DeLong test, which allow for the comparison of methods. The results indicate that the personalized algorithm outperforms the other two methods.
Considering the optimized parameters setting for MACD algorithm in,8,15 we observe the followings. The MACD optimized set proposed by8 with , days with a threshold of 2 kg resulted in a sensitivity of 23.1% and PPV of 0.1%. Applying optimized parameters from15 with , days with a threshold of 0.62 kg results in a sensitivity of 7.2% and a PPV of 0.2%. Optimizing on PPV for the current sample, MACD was able to attain a PPV of 0.2% with a sensitivity of 1.0%. When optimizing on sensitivity, MACD was able to attain a sensitivity of 40.0% with a PPV of 0.1%. In addition, the personalized approach also performed better than the rule-of-thumb algorithms in both algorithms P and S in terms of PPV and sensitivity.
Discussion
Non-invasive telemonitoring is increasingly adopted as an appealing supplement to HF patient care. In order to create an efficient non-invasive RPM system that can be used alongside usual out-clinic patient care, the rate of unnecessary false alerts should be decreased in parallel with enhancing the early detection of worsening HF. When considering false alarms to avoid alarm fatigue and increase the reliability of the alarms, it’s vital to not only evaluate the false alarms in comparison to the total number of non-events (i.e. specificity), but also in comparison to the total number of alarms (i.e. PPV).12 That is, out of all alarms raised, how many of the alarms truly signal a worsening HF instance. For this purpose, we proposed a personalized remote monitoring algorithm for the daily monitoring of HF patients that uses flexible patient-tailored thresholds. We evaluated the performance for monitoring BW, HR, and SBP using real-world retrospective data.
Evaluation and comparison between algorithms using PPV-sensitivity showed that the personalized algorithm, in which thresholds are more sensitive to patient-specific deviations instead of population-wide variations, outperformed the MACD and rule-of-thumb algorithms on all monitored biometric measurements. That is, the patient-specific algorithm was able to reach a high PPV of 91.7% and a sensitivity of 17.0%. While personalized algorithm did show an improvement in HF worsening detection in addition to a high PPV, many episodes of worsening HF remain undetected. As a result, the personalized algorithm is a helpful RPM for detecting events that are most likely to induce HF deterioration, with high alarm reliability. Both monitoring HR and SBP outperformed monitoring BW.
Considering HR or SBP in remote HF monitoring
In our single biometric monitoring setting when either HR or SBP was considered, higher PPV was attained in comparison to BW, while detecting about one-sixth (HR) or one-tenth (SBP) of the worsening HF events. The PPV-sensitivity curve showed a steep drop following the highest attainable PPV value in HR and SBP monitoring. This makes the trade-off between PPV and sensitivity rigid: there is little room for compromise between either high PPV with low sensitivity or vice versa.
Body weight in remote HF monitoring
Monitoring BW, the personalized algorithm outperformed the simple algorithms, albeit with lower performance compared to HR and SBP. Possible explanations include the following. One, rapid weight gain, which has been reported as an indicator of worsening HF, is only responsible for a small proportion of events. Prior studies stated that rapid weight gain is only responsible for 9% of deteriorations.9,19 Second, frequent weight gain events could interfere with meaningful information since BW measurements may contain noise.5,9 For example, it is difficult to determine whether weight gain is a sign of worsening HF or is due to the normal fluctuation of BW.15,20 Third, measuring BW during later times of the day or wearing clothes could lead to noisy measurements. Four, patients may lose weight because of unseen simultaneously occurring cachexia and fluid gain because of HF, leading to stable BW.21 These findings could partly explain many false positive alarms of BW monitoring in all algorithms compared.
Comparison with other algorithms in literature
Previously published sophisticated weight-based monitoring algorithms include HeartPhone7 and HeartPredict.11 The HeartPhone weight monitoring algorithm utilizes moving averages applied to daily weight data to generate alerts when deviations from the norm for individual patients occur. The highest obtained sensitivity level with it (82.0%) was accompanied by a PPV of 3.4% and specificity of 68.0%. The HeartPredict algorithm uses multivariate time series of weight and self-reported symptoms (e.g. assessment of symptoms such as dyspnoea, orthopnea, cough, oedema, fatigue, fever, palpitations, and weakness) to predict future heart failure (HF) episodes, with a balanced random forests classification model providing a risk score. The highest obtained sensitivity level with HeartPredict (63.0%) was accompanied by a PPV of 8.5% and specificity of 86.0%. Although a higher percentage of worsening HF episodes was detected in both HeartPhone and HeartPredict in comparison to the novel algorithm, PPV and specificity were lower with a very large deviation when comparing to HR-based monitoring (BW-based PPV and specificity of the novel algorithm was 15.7% and 93.0%, respectively, HR based PPV and specificity of the novel algorithm was 91.7% and 99.9%, respectively). This shows that although the novel algorithm detected less worsening HF episodes compared to other algorithms, a substantially larger fraction of the alarms are true alarms, and model ability in predicting correctly no alarm is higher. However, for a fair comparison of these algorithms with the proposed approach, they should be applied on the same dataset, same evaluation method (e.g. 7-day time window as the binning threshold and comparing PPV-sensitivity scores), and confusion matrices should be provided. However, these datasets are not accessible, and therefore, a direct comparison is not possible.
Strengths and limitations
The proposed algorithm outperformed conventional methods. With this new algorithm, the problem of estimating (patient-specific) regular longitudinal patterns, where not much data is generated by the patient yet, was solved using the ‘stable HF patients’ group. Control limits were tailored to their observations to decrease the rate of unnecessary false alarms. The method employs an updating procedure in which estimations will be updated after worsening HF to adapt to new baselines.
This study has certain limitations. One limitation of our implementation in practice is that a patient or a healthcare professional needs to notify the system to update after the occurrence of worsening HF. This is important since diuretic changes, affect the baseline of BW. Second, a challenge that has not been addressed is missing values. Missing values in univariate time-series with real-time applications can decrease the prediction power of the algorithm. Patients sometimes stopped to measure their biometrics before worsening HF, possibly because they felt unwell. Therefore, missing data patterns may also be informative (missing not at random), leading to a challenging issue in data analysis for any monitoring system. Third, it is possible that the value above or below threshold could occur as a transient deflation. This can be clinically true, but we did not have access to evident symptoms, and patient’s questionnaire for an indication of HF deterioration as defined in addition to the outpatient clinic visits and admissions. Hence, algorithms may not detect worsening HF.
It is crucial to acknowledge that the existing and previous research has highlighted the need to address the uncertainty about whether patients adhere to the measurement requirements. In some situations, the patient measured BW incorrectly, wearing too many clothes or not directly in the morning as instructed. This aspect may have had an effect on the results as it contributed to a higher number of positive alarms. To be able to distinguish between measurement errors and deviations as a result of worsening HF, a much larger labelled dataset is needed. Furthermore, there was a significant variation in the follow-up duration among the patients, leading to a higher level of heterogeneity between them, and could potentially have had an impact on the results obtained.
It should be also noted that majority of our patient cohort is registered through a tertiary hospital with focus on end-stage heart failure, therefore, predominantly HFrEF patients are included in the study. While this patient population provides valuable insights into this specific subgroup, it is essential to recognize that the findings may be subject to selection bias and may have limitations when it comes to generalizing the results to broader populations with different heart failure aetiologies or disease stages.
During the data collection process, heart rhythm was not recorded and hence we could not distinguish between sinus rhythm and atrial fibrillation. We assumed a sinus rhythm for each HR measurement. However, if atrial fibrillation were to be present, most likely an alarm was triggered due to increased HR. As atrial fibrillation is related to decompensation,22 we do not consider these alarms an issue. Hence, we do not counter advise the use of the personalized algorithm in patients with atrial fibrillation. However, future studies are required to confirm the association between atrial fibrillation and alarms when monitoring HR.
Future directions
Looking towards the future, it is important to highlight that our study primarily focused on an internal cohort. To ascertain the robustness of our personalized algorithm, it would be beneficial to conduct a comparison with an external dataset. Furthermore, it is crucial to keep in mind that when applying this algorithm to new patient populations (e.g. from different clinics or hospitals), the set of thresholds may need to be re-evaluated and optimized accordingly. Also, the length of the time window used to distinguish between false and positive alarms would be worth further exploring, as this will enable a more comprehensive understanding of the optimal time frame for accurate alarm classification and enhance the reliability of the findings.
Additionally, a finalized personalized algorithm needs to be tested prospectively before large-scale implementation. This requires a large randomized controlled trial (RCT), where patients are assigned to either remote monitoring using methods such as the rule-of-thumb or MACD, or remote monitoring using the personalized algorithm. In this RCT, the number of hospitalizations and deaths should be compared. Beforehand, the performance of the algorithm can be enhanced.
The developed patient-specific algorithm obtained high PPV while the detection rate was low. To further enhance the algorithm, a higher frequency dataset where measurements are gathered throughout the day would be desired. Continuous measurements could provide information on patient-specific circadian rhythmicity over the course of the day, and in return, daily fluctuation can be captured which can make the threshold more precise to increase the detection rate.23 For example, wearable devices recently proved to be a low-cost non-invasive monitoring tool to predict the deteriorations of HF patients, as they allow continuous HR measurement.10 These devices can eliminate limitations of the current research by collecting HR and SBP measurements automatically. Wearables also can provide more information on oxygen level, patient questionnaire, electrocardiogram (ECG) waves, temperature, etc. which could help the algorithm to early detect HF worsening more efficiently.10 These types of devices, alongside reminders on mobile phones, could potentially improve the compliance of patients. To accommodate this high frequent measurements, multivariate modelling can be employed to simultaneously monitor patterns in more than one biometric value at a same time.10
It is crucial to highlight that further research is required to ascertain the optimal trade-off between PPV and sensitivity, considering workload and patient safety. This investigation entails exploring appropriate levels of PPV, sensitivity, specificity, and false alarm rates for various healthcare facilities while considering factors such as patient population size and the availability of clinical staff.
Conclusion
RPM systems for HF patients may play a central role in the care of patients with mild-to-moderate HF. Monitoring HR or systolic BP using personalized algorithm resulted in a high PPV of detecting worsening heart failure up to 92.0%. However, numerous episodes of HF worsening went undetected, indicating that it is unviable in its current form. Incorporating more frequent measurements as well as other biometric values may result in algorithm improvements. Monitoring BW with the current point of reference needs to be re-evaluated.
Lead author biography

Mehran Moazeni is a Ph.D. student at the Department of Statistics, Utrecht University, and the Department of Cardiology, Utrecht Medical Center (The Netherlands). Besides research in clinical settings, Moazeni is currently involved in several research topics, such as real-time remote patient monitoring, the extended application of machine learning in clinical activities, and real-time classification problems.
Supplementary material
Supplementary material is available at European Heart Journal – Digital Health.
Funding
The project is funded by the Health~Holland LSI-TKI PPP project EMPOWER (No. LSHM 19022) and the Health~Holland LSI-TKI PPP project LVAD-LVAD (No. LVAD-LVAD LSHM19035), authors M.M. and L.N., https://www.health-holland.com/funding-opportunities/tki-match.
Data availability
An open access implementation of the personalized algorithm (and MACD) algorithm in R is available at.13 The data underlying this article cannot be shared publicly due to the privacy of individuals that participated in the study. The data will be shared on reasonable request with the corresponding author. No new data were generated or analyzed in support of this research.
References
Author notes
Conflict of interest: M.M., L.N., M.B., J.H., F.H.R., D.L.O., F.W.A, and E.A. report no competing interests. L.W.L. received consultancy fees from Medtronic, Abbott Vifor, Novartis, outside the submitted work.
