


Abstract
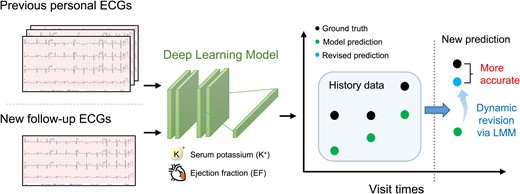
Deep learning models (DLMs) have shown superiority in electrocardiogram (ECG) analysis and have been applied to diagnose dyskalaemias. However, no study has explored the performance of DLM-enabled ECG in continuous follow-up scenarios. Therefore, we proposed a dynamic revision of DLM-enabled ECG to use personal pre-annotated ECGs to enhance the accuracy in patients with multiple visits.
We retrospectively collected 168 450 ECGs with corresponding serum potassium (K+) levels from 103 091 patients as development samples. In the internal/external validation sets, the numbers of ECGs with corresponding K+ were 37 246/47 604 from 13 555/20 058 patients. Our dynamic revision method showed better performance than the traditional direct prediction for diagnosing hypokalaemia [area under the receiver operating characteristic curve (AUC) = 0.730/0.720–0.788/0.778] and hyperkalaemia (AUC = 0.884/0.888–0.915/0.908) in patients with multiple visits.
Our method has shown a distinguishable improvement in DLMs for diagnosing dyskalaemias in patients with multiple visits, and we also proved its application in ejection fraction prediction, which could further improve daily clinical practice.
Introduction
Electrocardiography (ECG) is commonly used to diagnose cardiovascular diseases (CVDs), which are the leading cause of death worldwide.1 Recently, deep learning model (DLM)-enabled ECG systems have shown good prospects for diagnosing cardiac-related diseases2–4 and even for predicting death.5 In these studies, the collection of ECG data for DLMs was retrospective, and patients underwent multiple measurements under various clinical situations. However, the standard training process of DLMs usually assumes independence in training samples.6 Previous DLM-enabled ECG studies did not develop DLMs utilizing the information of follow-up ECGs and avoided the impact of patients who had more ECGs in evaluating the performance of the model.5,7 Repeated measurements are common in real-life scenarios but not taken into account by models that accept only single time points as inputs.
Short- and long-term ECG monitoring is often recommended for providing diagnostic and prognostic information on heart diseases,8 which involves multiple measurements and analyses for each patient. Serum potassium (K+) level is an important clinical biomarker that requires monitoring in healthcare scenarios, such as haemodialysis management.9 The change in K+ level may be dynamic within 1–2 h after a given therapy.10 Deep learning models have shown promise for uncovering important dyskalaemias on ECGs, and the accuracy of DLMs has exceeded the average clinician’s accuracy for diagnosing dyskalaemias.11 However, a comprehensive approach of DLMs that can integrate patient-level information to monitor K+ levels via ECGs is still lacking. The need for K+ monitoring represents the potential applications of DLM-enabled ECG, and we should develop longitudinal DLMs for these scenarios.
Previous research has shown that the prediction by DLMs is significantly different in patients with certain diseases such as old myocardial infarction (MI).12 We hypothesized that DLMs with the standard training process would underestimate or overestimate the clinical outcomes in patients with various specific characteristics such as old MI. This prediction error may permanently exist at the personal level and could cause a prediction bias, which can be used to revise future predictions for each patient. A linear mixed model (LMM) is typically used to adjust the effect of data dependency from individuals.13 The random effects of the LMM can be used to analyse the prediction error at the patient level. Incorporating the personal information of previous examinations has been shown to improve the ability to predict future haemoglobin levels14 and haemoglobin A1c,15 and the random-effect structure of LMMs could provide better accuracy, especially with more frequent visits. Thus, we could revise the prediction of DLMs based on repeated measurements, which is similar to using new evidence to correct human answers.
To the best of our knowledge, this is the first study to revise the prediction using DLMs based on repeatedly measured patient data. This study aimed to use the LMM, revise the prediction by the DLM, and improve the predictive ability for K+ monitoring by DLMs via ECG. This method could develop a personalized baseline by the LMM based on a small amount of prior-labelled ECG and might not require longitudinal changes in previous measurements. We will use the combination of LMM and DLM to construct a personalized artificial intelligence (AI) and further validate whether it can improve the accuracy of predicting dyskalaemias in patients with multiple visits.
Methods
Data preprocessing
We conducted a multisite retrospective study at two hospitals in the Tri-Service General Hospital system. This study was approved by the institutional review board of Tri-Service General Hospital, Taipei, Taiwan (IRB No. C202105049), and an informed consent waiver was granted because we used de-identified data collected retrospectively and encrypted from the hospital to the data controller. This article was written following the Transparent Reporting of a Multivariable Prediction Model for Individual Prognosis or Diagnosis guidelines16 which are elaborated in Supplementary material online, Appendix S4. Patients did not receive any treatments due to this study, and there is no risk group in this study.
The generation process is shown in Supplementary material online, Figure S1A. The data collected from the first hospital, which is an academic medical centre, were used for developing model and internal validation. The data collected from the second hospital, which is a community hospital, were used for external validation. Once patient data were collected, the first visit site for each patient was used to determine which hospital they belonged to and to ensure that the same patient does not appear in both hospitals. We used the de-identified data to develop and validate models after patients were assigned to the first or second hospital. Two hospitals were considered in this study. Hospital A was the first site, which is an academic medical centre (NeiHu General Hospital at NeiHu District), and hospital B was the second site, which is a community hospital (Tingzhou Branch Hospital at Zhongzheng District). We collected the ECG data set with the corresponding serum potassium (K+) test based on echocardiogram data from 1 January 2011 to 31 December 2020 for the following experiments. They were separately opened and operated in 1999 and 1946, although they were in the same system.
To collect the ECG data set with K+ in hospital A, 116 646 patients who had at least one ECG record and corresponding serum K+ test during the study period were considered. To ensure that the number of patients needed to establish personalized AI was sufficient, we used ∼90% of the patients to construct DLMs and LMMs and used ∼10% for internal validation. A total of 103 091 patients were included in the model construction, which were further divided into the development set (87.5% of the sample) and the tuning set (12.5%). Among them, there were 147 474 ECG records with corresponding K+ in the development set and 20 976 ECG records with corresponding K+ in the tuning set. For internal validation, 37 246 ECGs with corresponding K+ levels from 13 555 patients were included in the internal validation set, which were used to evaluate the accuracy of K+ monitoring and further analyses. There was no overlap among the data sets. In hospital B, there were 47 604 ECGs with corresponding K+ tests from 22 058 patients in the external validation set.
Standard 12-lead ECGs that were collected using a Philips machine (PH080A, Philips Medical Systems, Andover, MA, USA) at 500 Hz for 10 s (5000 sequence signals for each lead) were used. Serum K+ test was performed using indirect ion-selective electrode methods in the laboratory. Sample with evidence of haemolysis and plasma K+ interference indices were excluded to prevent pseudohypokalaemia/pseudohyperkalaemia. The information about department that patient ever visited and had an ECG measurement was recorded in the data controller. There are four categories of visited department, which are outpatient department (OPD), physical examination centre (PEC), inpatient department (IPD), emergency room, and unknown. An ECG measurement only has one category, and patient may have ECGs measured from a mix of visited department. There may be more than one ECG record within a short period, corresponding to a single clinical examination. To avoid repeated use of one K+ test, we selected the first ECG within the period of time for analysis. An illustration of the selection of the corresponding ECG signal is shown in Supplementary material online, Figure S1B. The first ECG within 2 h of a K+ test was collected as samples in the corresponding data set. The corresponding time interval was chosen to maximize the sample size based on a previous study,11 and the ECG may be able to reflect the K+ within these time intervals. We included the patients had <2 ECGs in our study because these samples benefit for DLM by increasing the sample size of training data, and the follow-up ECGs is need for constructing LMMs.
Deep learning model implementation
We designed a convolution neurone network with dense connections between layers to predict K+. We used the standard 12-lead ECGs as model input. The DLM had an architecture of 61 convolutional layers and an attention mechanism11 for extracting features.
We designed our models with 12 ECG lead blocks and shared weights as ECG12Net.11 The model architecture is shown in Supplementary material online, Figure S2. We randomly resized a range of heart rates in a uniform distribution from 0.9 to 1.1 heart rates as in previous research11 and randomly cropped a length of 4500 sequences of ECG signals as the input of the model in the training process. We extended the module with additional specific nonshared neurone layers after each ECG lead block. This provides a model with the ability to extract features from each ECG lead. The number of temporal features for each ECG block was 19 because the downsampling size was 256. These features of each ECG lead would be integrated with the routing-by-agreement algorithm instead of general pooling methods, such as global average pooling. The output dimension of each lead was 1 × 1 × 128 after integration of the routing-by-agreement. After the integration of temporal features, the feature maps of the 12 ECG leads are weighted and summed with the attention blocks as ECG12Net. To prevent the model from predicting with a few parts of the ECG lead, a dropout layer was added to each lead before the weighted sum. The dropout rate was set to 0.5. Finally, the weighted sum is followed by a linear module, which is a fully connected layer with sigmoid functions. The number of blocks in the fully connected layer in the linear module is the level of the converted ordinal variable. We designed neural network to predict K+ as ordinal variables. Category-wise encoding technology was used to encode labels,17,18 which convert the continuous variables into ordinal variables. The details of category-wise encoding technology and training procedures of DLM are shown in Supplementary material online, Appendix S1. The DLMs were implemented using the MXNet package (R package version 1.3.0).
Linear mixed model
Dynamic revision from deep learning model
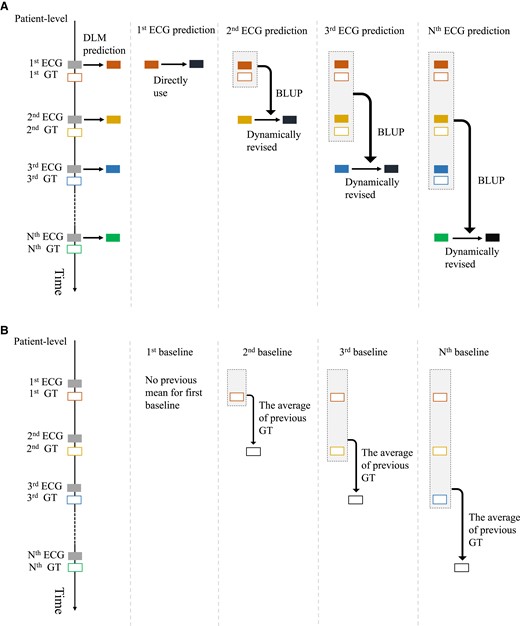
Procedure of patient-level prediction with the deep learning model and the calculation of baseline for prediction. (A) The workflow of dynamic revision with the best linear unbiased prediction. The deep learning model predictions via electrocardiogram are revised with the personal best linear unbiased prediction that involved using previous predictions and corresponding ground truth. The black box indicates the dynamic revision of deep learning model prediction. (B) The calculation of the previous mean value for baseline. The previous mean value is the average value of the previous ground truth values from each patient, which is only on the follow-up electrocardiograms.
We did not revise the first prediction because there was no P0,k. The predictions after the first prediction are revised sequentially based on Pi,k (i = 1,2,3,…). For example, the second prediction is revised with the personal coefficients P1,k, which are calculated in the first prediction, and the third prediction is revised with the personal coefficients P2,k, which are calculated in the first to second prediction. When patients have multiple measurements of K+, each subsequent prediction of DLMs is revised with personal BLUP, which is calculated based on previous data. The details of dynamic revision are provided in Supplementary material online, Appendix S1. Example codes and more information are available at https://github.com/Imshepherd/dynamic-revision-of-deep-learning-model.
Statistical analysis
Patient characteristics and corresponding annotation were compared between the development, tuning, internal validation, and external validation sets. Patient characteristics were also compared between patient with equal or more than two ECGs and only one ECG. These P values refer to analysis of variance or chi-square tests, appropriately. We did not impute any missing value because we collected ECGs which had a corresponding annotation of K+ and the mainly analysis is for K+.
The area under the receiver operating characteristic curve (AUC) analysis was the primary outcome used to assess the performance for diagnosing diseases with direct prediction from DLMs and dynamic revision using BLUP. K+ levels is important to be discretized into hypo/hyperkalaemia for clinical purpose, such as clinical treatment.21 Our DLMs were optimized to estimate the values of serum K+, and the estimated K+ (as continuous variable) was used to identify patients with hypo/hyperkalaemia. According to guideline,21 we defined hypokalaemia as a K+ level <3.5 mEq/L (as categorical variable) and defined hyperkalaemia as a K+ level >5.5 mEq/L (as categorical variable). The confidence intervals for the AUCs and significant differences between the AUCs of the model were determined using the DeLong method. The second analysis used Pearson’s correlation and mean absolute error (MAE) to evaluate the ability of estimating K+ which is also needed in clinical practice.22,23
We further analysed whether other comorbidities contain information that can improve both direct prediction and predictions with dynamic revision. The AUC, MAE, and Pearson’s correlation were used to compare the performance of the direction prediction, the direction prediction with additional lab tests, dynamic revision, and dynamic revision with additional label tests. The abnormality of serum Na and Bicarb that might associated with K+ in chronic kidney disease (CKD) patients,24 and serum Na and Bicarb therefore were used as the additional label tests. The multivariable regression model for the direction prediction with additional lab tests included the estimated K+ from DLM, serum Na, and Bicarb, and this model was constructed on the tuning set. For dynamic revision with additional label tests, the corresponding serum Na and Bicarb tests were used as the additional independent variables for fixed effects and random effects in LMM and BLUP.
In analysis of AUC, MAE, Pearson’s correlation, AUPRCs, and F1 scores, the significant difference was compared among the mean value, previous value, previous mean value, direct prediction, and dynamic revision in follow-up ECGs because our dynamic revision method revised the prediction of DLM in follow-up ECGs. The significance levels were set at 0.005 (0.05/10) based on Bonferroni correction. We did not adjust other covariates, such as age and gender, because we focused on the improvement of DLM in this study.
Results
Table 1 summarize the demographics of the patients for the ECG data set with K+. Patients had a mean (standard deviation) age of 56.5 (18.8), 59.2 (19.0), 59.0 (17.3), and 59.7 (20.7) years at baseline, and the median (interquartile range) number of ECGs per patient was 2 (2–3), 2 (2–2), 3 (2–5), and 3 (2–4) for patients with multiple visits in the development, tuning, internal validation, and external validation sets, respectively. A total of 14.9, 15.3, 14.0, and 13.7% of ECGs had a corresponding hypokalaemia, and a total of 1.5, 1.7, 2.0, and 1.7% of ECGs had a corresponding hyperkalaemia in the development, tuning, internal validation, and external validation sets, respectively.
Patient characteristics in the development, tuning, internal validation, and external validation sets for an electrocardiogram data set with K+
| Development set | n | Tuning set | n | Internal validation set | N | External validation set | N | P-value | |
|---|---|---|---|---|---|---|---|---|---|
| Patients (n) | 93 706 | — | 18 825 | — | 13 555 | — | 22 058 | — | — |
| ECGs (n) | 147 474 | — | 20 976 | — | 37 246 | — | 47 604 | — | — |
| Visited department (based on ECG) | <0.001 | ||||||||
| OPD/PEC | 136 898 (92.8%) | — | 19 512 (93.0%) | — | 31 836 (85.5%) | — | 42 742 (89.8%) | — | — |
| IPD/ER | 10 576 (7.2%) | — | 1464 (7.0%) | — | 5410 (14.5%) | — | 4862 (10.2%) | — | — |
| Unknown | 0 (0%) | — | 0 (0%) | — | 0 (0%) | — | 0 (0%) | — | — |
| Demography (baseline) | |||||||||
| Age (years) | 56.5 ± 18.8 | 93 706 | 59.2 ± 19.0 | 18 825 | 59.0 ± 17.3 | 13 555 | 59.7 ± 20.7 | 22 058 | <0.001 |
| Gender (male) | 47 121 (50.3%) | 93 706 | 9608 (51.0%) | 18 825 | 6846 (50.5%) | 13 555 | 10 995 (49.8%) | 22 058 | 0.108 |
| Height (cm) | 163.1 ± 9.3 | 57 536 | 162.6 ± 9.2 | 12 472 | 162.7 ± 8.9 | 9665 | 163.4 ± 9.1 | 11 347 | <0.001 |
| Weight (kg) | 64.5 ± 14.0 | 57 536 | 64.0 ± 13.9 | 12 472 | 64.6 ± 13.7 | 9665 | 64.8 ± 13.9 | 11 347 | <0.001 |
| SBP (mmHg) | 136.3 ± 27.2 | 33 843 | 136.7 ± 27.3 | 7448 | 137.5 ± 26.9 | 5177 | 140.2 ± 27.6 | 6224 | <0.001 |
| DBP (mmHg) | 80.0 ± 16.9 | 33 843 | 79.4 ± 17.1 | 7448 | 80.8 ± 16.4 | 5177 | 75.7 ± 17.0 | 6224 | <0.001 |
| Comorbidity (baseline) | |||||||||
| DM | 12 758 (13.6%) | 93 706 | 3584 (19.0%) | 18 825 | 2881 (21.3%) | 13 555 | 4860 (22.0%) | 22 058 | <0.001 |
| HTN | 20 527 (21.9%) | 93 706 | 5705 (30.3%) | 18 825 | 5075 (37.4%) | 13 555 | 8690 (39.4%) | 22 058 | <0.001 |
| HLP | 16 510 (17.6%) | 93 706 | 4494 (23.9%) | 18 825 | 4288 (31.6%) | 13 555 | 6786 (30.8%) | 22 058 | <0.001 |
| CKD | 10 286 (11.0%) | 93 706 | 3768 (20.0%) | 18 825 | 2226 (16.4%) | 13 555 | 3562 (16.1%) | 22 058 | <0.001 |
| AMI | 1416 (1.5%) | 93 706 | 511 (2.7%) | 18 825 | 270 (2.0%) | 13 555 | 284 (1.3%) | 22 058 | <0.001 |
| STK | 8659 (9.2%) | 93 706 | 2395 (12.7%) | 18 825 | 1671 (12.3%) | 13 555 | 3003 (13.6%) | 22 058 | <0.001 |
| CAD | 10 770 (11.5%) | 93 706 | 3121 (16.6%) | 18 825 | 2786 (20.6%) | 13 555 | 4221 (19.1%) | 22 058 | <0.001 |
| HF | 3497 (3.7%) | 93 706 | 1316 (7.0%) | 18 825 | 1007 (7.4%) | 13 555 | 1570 (7.1%) | 22 058 | <0.001 |
| Afib | 1918 (2.0%) | 93 706 | 742 (3.9%) | 18 825 | 526 (3.9%) | 13 555 | 816 (3.7%) | 22 058 | <0.001 |
| COP | 7744 (8.3%) | 93 706 | 2252 (12.0%) | 18 825 | 1873 (13.8%) | 13 555 | 3835 (17.4%) | 22 058 | <0.001 |
| K+ (mmol/L) | |||||||||
| On first ECGs | 3.9 ± 0.5 | 93 706 | 3.9 ± 0.6 | 18 825 | 3.9 ± 0.5 | 13 555 | 3.9 ± 0.5 | 22 058 | <0.001 |
| On second ECGs | 4.0 ± 0.6 | 25 895 | 4.0 ± 0.7 | 1675 | 4.0 ± 0.6 | 6608 | 4.0 ± 0.6 | 8521 | <0.001 |
| On third ECGs | 4.0 ± 0.7 | 11 373 | 4.1 ± 0.8 | 333 | 4.0 ± 0.6 | 4055 | 4.0 ± 0.6 | 4774 | 0.015 |
| On greater than or equal to fourth ECGs | 4.1 ± 0.7 | 16 500 | 4.0 ± 0.7 | 143 | 4.1 ± 0.7 | 13 028 | 4.1 ± 0.7 | 12 251 | 0.313 |
OPD, outpatient department; PEC, physical examination centre; IPD, inpatient department; ER, emergency room; SBP, systolic blood pressure; DBP, diastolic blood pressure; DM, diabetes mellitus; HTN, hypertension; HLP, hyperlipidaemia; CKD, chronic kidney disease; AMI, acute myocardial infarction; STK, stroke; CAD, coronary artery disease; HF, heart failure; Afib, atrial fibrillation; COPD, chronic obstructive pulmonary disease; K+, serum potassium.
We first assessed the performance for diagnosing dyskalaemia with direct prediction from DLM and dynamic revision using BLUP. Figure 2 shows that dynamic revision using BLUP significantly improved the DLM predictions, which provided the highest overall AUCs of 0.756/0.737 and 0.915/0.919 for detecting hypokalaemia and hyperkalaemia in the internal/external validation sets, respectively. Because the results of follow-up examinations may be correlated with previous records at the individual-patient level, we used the previous value and previous mean value as a comparison for diagnosing these diseases in the follow-up ECGs. Dynamic revision using personal BLUP provided significantly better AUCs than the previous mean value as a prediction for diagnosing hypokalaemia and hyperkalaemia on follow-up ECG. We also analysed the capability of dynamic revision for estimating the values of K+, and the MAE and Pearson correlations were calculated and compared with the baseline (Figure 2). We used the mean value as the baseline for continuous predictions of K+ and used the previous mean value as a baseline comparison in the follow-up ECG. Using dynamic revision with BLUP, the overall MAEs for predicting K+ were 0.356/0.355 vs. the mean value (0.433/0.419) in the internal and external validation sets, respectively. The results also demonstrated that our dynamic revision had an MAE improvement (0.363/0.366) compared with the direct use of DLM (0.410/0.407) for follow-up ECGs in the internal/external validation set. Moreover, we found that the overall correlations for using dynamic revision (0.598/0.564) were better than direct prediction (0.500/0.478) in the internal/external validation set. Identical trends were observed in the follow-up ECGs, which showed that the performance of the dynamic revision was superior to the mean value, previous mean value, and direct DLM predictions. In summary, these analyses demonstrated the superiority of integrating personal information using BLUP compared with using direct DLM prediction, and integrating this information is crucial for monitoring K+.

Performance of diagnosing hypokalaemia and hyperkalaemia and estimating serum potassium. Hypokalaemia was defined as a serum potassium level <3.5 mEq/L. Hyperkalaemia was defined as a serum potassium level >5.5 mEq/L. The baseline value predicted the mean value for all patients. The previous value was calculated using the most recent examination result for each patient. The previous mean value was calculated using the mean value of the previous examination result for each patient. The deep learning model (directly) is the original prediction from deep learning models, and the deep learning model (dynamic) is the dynamic revision of deep learning model prediction with the personal best linear unbiased prediction.
We also reported the performance using the AUPRCs and F1 scores in Figure 3. The AUPRCs of dynamic revision for diagnosing hypokalaemia and hyperkalaemia (0.399/0.387 and 0.355/0.297) is superior than the direct use of DLM (0.341/0.343 and 0.247/0.255) in the internal/external validation sets, respectively. The trend of better performances of F1 scores was maintained. The superiority of dynamic revision remains unchanged under the condition of imbalanced classification.
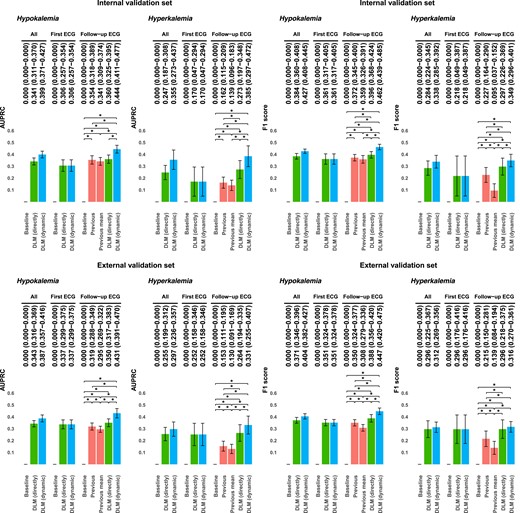
Area under the precision recall curves and F1 scores of the models for diagnosing hypokalaemia and hyperkalaemia. Hypokalaemia was defined as a serum potassium level <3.5 mEq/L. Hyperkalaemia was defined as a serum potassium level >5.5 mEq/L. The baseline value predicted the mean value for all patients. The previous value was calculated using the most recent examination result for each patient. The previous mean value was calculated using the mean value of the previous examination result for each patient. The deep learning model (directly) is the original prediction from deep learning models, and the deep learning model (dynamic) is the dynamic revision of deep learning model prediction with the personal best linear unbiased prediction.
We analysed the impact of the number of follow-up ECGs on the performance of dynamic revision. Figure 4 shows that the performance of the DLM with dynamic revision usually increases as the number of repeat visits increases. We further analysed the improvement of DLM using BLUP in personal level. Supplementary material online, Figure S3 shows personal examples of estimating K+ in different scenarios, such as overestimation and underestimation by the DLM predictions. The advantage of dynamic revision is that it addresses different types of prediction bias in follow-up data. Using personal BLUP could effectively integrate the information of previous predictions and ground truths to reduce the prediction error, especially with more visits. However, it is very difficult to dynamically revise every prediction using the DLM when the variance of the previous ground truths is too large. To analysis the clinical scenario that our method could benefit for, we provided the information of department that patient ever visited and had an ECG measurement in these personal examples. Results showed that our method may not only benefit to patient in IPD but also benefit for patient visited in OPD. In summary, dynamic revision of DLM could provide better performance in most cases of follow-up ECGs.
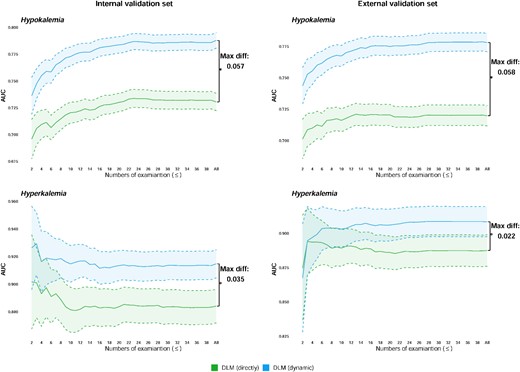
Impact of the number of follow-up electrocardiograms for diagnosing hypokalaemia and hyperkalaemia using best linear unbiased prediction. The performances of the deep learning model on the sample less than or equal to the indicated numbers were analysed. The green colour indicates the prediction directly from the deep learning model, and the blue colours indicate the prediction that is dynamically revised with the personal best linear unbiased prediction.
Discussion
We propose a novel DLM-enabled ECG system to dynamically predict K+ levels. The overall AUCs for detecting hypokalaemia (0.716–0.756) and hyperkalaemia (0.889–0.915) were significantly improved in the internal validation set and were also improved in the external validation set. Our methodology provides better accuracy in estimating the K+ values. Previous studies have attempted to estimate K+ level based on T-wave features using machine learning method, which had MAEs of 0.50 ± 0.4225 and 0.46 ± 0.3926 and reported that these accuracies of estimating K+ could be a clinically acceptable resolution. Other study that combined T wave and QRS morphology markers using machine learning method to predict K+ values has an MAE improvement (0.539) compared with only using T wave (0.631).27 Our method had an MAE improvement (0.363/0.366) compared with the direct use of DLM (0.410/0.407) for follow-up ECGs in the internal/external validation set. Although an improvement in MAE of ∼0.1 for K+ values may have limited clinical impact, dynamic revision method empowers DLM-enabled ECGs as a more accurate non-invasively tool for K+ monitoring. Importantly, our method had better AUPRCs of 0.399/0.387 and 0.355/0.297 for detecting hypokalaemia and hyperkalaemia in the internal/external validation sets, respectively, compared with the direct use of DLM (0.341/0.343 and 0.247/0.255). The AUPRC has more informative than the AUC under the condition of imbalanced classification. These results demonstrated that our method could improve the ability of DLM-enable ECG for diagnosing dyskalaemias in patients with multiple visits.
The advantage of LMM is that it estimates the variance in the hierarchical data, which can be used to address the dependency of data that are not considered in most DLMs for diagnosing disease.28,29 In repeated data format analyses with DLM, the recurrent neural network (RNN) may be a popular method for integrating information from multiple time points. However, it is difficult to directly use it in medical DLM development because of the limited amount of clinical data. In our data, 90.4% of patients had ≤3 annotated ECGs in the dyskalaemia data sets. Our dynamic revision could improve the accuracy in patients who only had ≤3 annotated ECGs, and not all patients had drastic changes in their K+. Importantly, LMM, which is a lightweight model, is easy to apply to each patient in real-world practice. Therefore, the success of our method may be attributed to the development of a personalized baseline for each patient, which might not benefit from looking for longitudinal changes such as diagnosing MI based on the ECG changes.30 Moreover, the other DLM-based method to deal with follow-up data, the RNN, is limited by missing values31 and the small sample size,32 which is also not suitable for standard 12-lead ECG follow-up. Considering the above limitations, a previous study also used LMM to improve the accuracy of DLM in the medical records scoring system.33
The key to improving the accuracy of the LMM is to integrate previous information. Even without using DLM as a classifier, using a previous mean could achieve AUCs >0.70 and 0.78 for detecting hypokalaemia and hyperthermia, respectively. Patients with a history of CVD or heart failure (HF) are more likely to develop hypokalaemia,34 and CKD may be a predictor of hyperkalaemia.35 These studies revealed specific risk of dyskalaemias in particular patient populations. Other comorbidities may also contain information that could improve predictions, such as the abnormality of serum Na and Bicarb that might associated with K+ in CKD patitents and were co-measured with K+.24 Therefore, we used these additional relevant laboratory tests with and without dynamic revision (see Supplementary material online, Appendix S2), and the results showed that serum Na and Bicarb could improve performance for diagnosing hypo/hyperkalaemia. The trend of better performance in the dynamic revision of the DLM was still maintained. This information may not always be assessable in clinical practice,36 limiting the number of previous records. However, using the additional lab measurements would still increase the applicability of our proposed method with a better performance for diagnosing dyskalaemia in clinical practice. Moreover, patients who have undergone more than two ECGs may have a higher chance of having abnormalities (see Supplementary material online, Table S4). Our LMM strategy of integrating previous personal information provided more accurate predictions and can further improve the accuracy of DLM-enabled ECG by increasing the number of previously annotated ECGs signals, especially in patients with >5 previous data points.
In clinical practice, a previous study has suggested that patients with HF should be carefully monitored with K+ when receiving aldosterone antagonists because there might be a risk of hyperkalaemia.37 Not only accurately diagnosing dyskalaemia but also appropriately monitoring the value of K+ is important.38 Not only concerning about the risk of hypokalaemia with a K+ <3.5 mEq/L, the risk of sudden cardiac death might increase in HF patients when they have a K+ <4.5 mEq/L.22 Moreover, in patients with end-stage renal disease undergoing haemodialysis therapy, K+ also needs to be controlled within a normal range to prevent potentially fatal arrhythmias.23 However, a previous study has shown that some patients might not receive the recommended follow-up of K+, although the need for monitoring is essential.39 Therefore, our method that improves the accuracy of estimating K+ via DLM-enabled ECG may enable ECG as a noninvasively K+ monitoring tool to benefit these clinical scenarios. Moreover, our method will benefit not only patients who request for labs in IPD, but also those who visit OPD. For example, it is important to routinely monitor K+ to identify the risk of hyperkalaemia in patients with angiotensin-converting enzyme inhibitors.40 Hyperkalaemia may occur up to 6.98–11% of patients in OPD.41 In our analysis of personal examples, the results revealed that our method improved the prediction for patients who routinely visit OPD/PEC. However, despite our method improving the performance of AI-ECG for diagnosing hypokalaemia, the AUC of <0.8 might not be good enough for clinical usage and thus requires improvement. Furthermore, we preliminarily explored whether the personal BLUP could be used to enhance the performance on different types of outcome, such as ejection fraction (EF) monitoring, which is another potential application of DLM-enabled ECG in clinical practice (see Supplementary material online, Appendix S3). The trend of better performance in the dynamic revision of DLM for monitoring EF was still maintained.
The limitations of this study should be acknowledged. First, the number of patients in our data set was unbalanced, and the time intervals between the follow-up examinations fluctuated. Moreover, we lacked treatment data and therapy data to exclude ECGs that had an intervention before the corresponding annotations. A well-designed long-term follow-up prospective study should be conducted to validate the effects of this dynamic revision method. Second, despite the statistical differences in patient characteristics and clinical outcomes among the development, tuning, and validation sets, our method still demonstrated its robustness in improvement in the DLM. However, further studies should be conducted to verify the performance of our method in external validation in other countries. Third, this study only validated the improvement in dynamic revision of follow-up K+ and EF predictions. More extensive validation and evaluation of other biomarkers should be conducted.
Conclusions
We proposed a novel strategy for dynamically revising the prediction of the DLM, and this method showed impressive performance enhancement on follow-up ECGs. The DLM and LMM can be integrated as powerful DLM-enabled ECG systems for short- and long-term monitoring. Moreover, our strategy provides opportunities for enhancing performance in hospitals with automatic annotations, which could increase the accuracy in patients with more revisits. This personal dynamic prediction method may have the potential to be precisely applied to monitoring other important biomarkers.
Supplementary material
Supplementary material is available at European Heart Journal – Digital Health.
Acknowledgements
We would like to express special thanks to professors Shih-Hua Lin at Tri-Service General Hospital for his support, consultancy, and valuable discussions on this paper.
Funding
This study was supported by funding from the Ministry of Science and Technology, Taiwan (MOST 109-2314-B-016-026 to C.L., MOST 110-2314-B-016-010-MY3 to C.L., and MOST 110-2321-B-016-003 to C.-H.W.) and Medical Affairs Bureau (MND-MAB-C13-112050 to C.L., MND-MAB-D-111045 to C.L., and MND-MAB-110-113 to C.L.).
Data availability
The data analysed in this study are not publicly available due to privacy and security concerns. The data may be shared with a third party upon execution of a data sharing agreement for reasonable requests, and such requests should be addressed to C.L.
References
Author notes
Conflict of interest: None declared.
