


Abstract
The real-world effectiveness of the artificial intelligence model based on electrocardiogram (AI-ECG) signals from portable devices for detection of left ventricular systolic dysfunction (LVSD) requires further exploration.
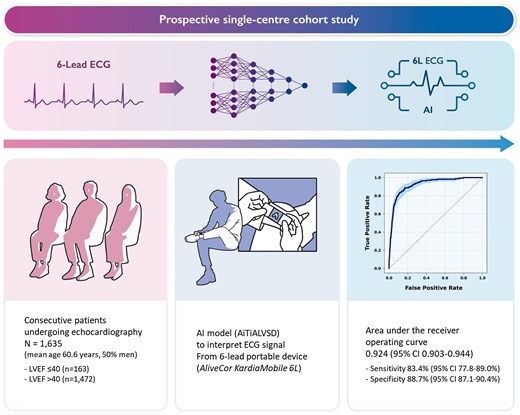
In this prospective, single-centre study, we assessed the diagnostic performance of AI-ECG for detecting LVSD using a six-lead hand-held portable device (AliveCor KardiaMobile 6L). We retrained the AI-ECG model, previously validated with 12-lead ECG, to interpret the 6-lead ECG inputs. Patients aged 19 years or older underwent six-lead ECG recording during transthoracic echocardiography. The primary outcome was the area under the receiver operating characteristic curve (AUROC) for detecting LVSD, defined as an ejection fraction below 40%. Of the 1716 patients recruited prospectively, 1635 were included for the final analysis (mean age 60.6 years, 50% male), among whom 163 had LVSD on echocardiography. The AI-ECG model based on the six-lead portable device demonstrated an AUROC of 0.924 [95% confidence interval (CI) 0.903–0.944], with 83.4% sensitivity (95% CI 77.8–89.0%) and 88.7% specificity (95% CI 87.1–90.4%). Of the 1079 patients evaluated using the AI-ECG model based on the conventional 12-lead ECG, the AUROC was 0.962 (95% CI 0.947–0.977), with 90.1% sensitivity (95% CI 85.0–95.2%) and 91.1% specificity (95% CI 89.3–92.9%).
The AI-ECG model constructed with the six-lead hand-held portable ECG device effectively identifies LVSD, demonstrating comparable accuracy to that of the conventional 12-lead ECG. This highlights the potential of hand-held portable ECG devices leveraged with AI as efficient tools for early LVSD screening.
Introduction
The growing prevalence of heart failure is a critical public health issue, conferring a significant economic burden on individuals and societies globally.1 Over the last three decades, the treatment of heart failure has shown remarkable progress, such as reducing hospitalizations and improving survival.2 Furthermore, pharmacological treatments during the asymptomatic stage have effectively reduced the incidence of hospitalizations for heart failure despite the presence of left ventricular systolic dysfunction (LVSD), which further emphasizes the critical need for screening for this condition.3,4
Consequently, there are ongoing efforts to develop biomarkers that can screen for LVSD for early initiation of treatment. B-type natriuretic peptide (BNP) and N-terminal pro-BNP (NT-proBNP) are commonly used biomarkers for screening and their use is supported by the contemporary guidelines.5,6 However, the effectiveness of BNP in community-level screening for LVSD has been suboptimal and moreover, necessitates a hospital visit for blood draw.7
Recent advances in artificial intelligence (AI) have profoundly impacted the field of cardiology, particularly enhancing diagnostic and classification methods through AI-assisted electrocardiograms (ECGs). The development of AI algorithms capable of analysing hidden patterns in ECGs has demonstrated the potential of AI to support and enhance conventional diagnostic methodologies. Notably, 12-lead ECGs could be used for screening or diagnosing conditions such as low left ventricular ejection fraction (LVEF), myocardial infarction, or aortic stenosis.8–10
Despite the enthusiasm surrounding the possible integration of AI into cardiac care, research into the application and effectiveness of portable or wearable ECG devices in the real-world remains relatively limited. While portable devices offer promising avenues for community-level cardiac monitoring, the extent to which these technologies can support the early detection of LVSD is not yet fully understood.11 This gap underscores the need for further investigation into the effectiveness of AI models based on ECG signals (AI-ECG) from portable devices for detection of LVSD in the real-world.
In this study, we hypothesized that the AI-ECG from the six-lead portable ECGs would effectively detect patients with LVSD. The overall aim of this study was to prospectively validate the performance of our recently developed AI-ECG model using the portable ECG system through a real-world patient cohort undergoing transthoracic echocardiography.
Methods
Consent
This prospective, single-centre cohort study recruited consecutive patients from Seoul National University Hospital undergoing transthoracic echocardiography between May 2022 and June 2023 (Figure 1). All participating patients provided written informed consent. The study complied with the Declaration of Helsinki and the protocol was approved by the institutional review board at Seoul National University Hospital (No. 2203-156-1310).
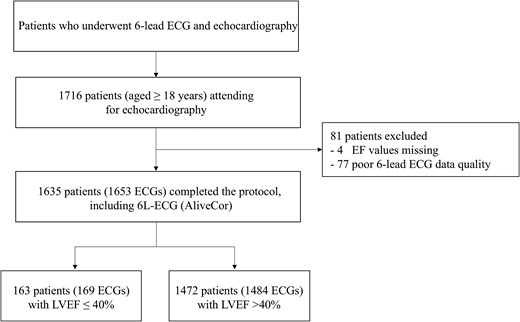
Study flow of the study participants.
Study participants
All adults aged 19 years or older who underwent echocardiography were invited for inclusion. Exclusion criteria included missing data in one or more leads of the six-lead ECG, a gap of 1 s or more in any ECG lead data, and missing echocardiography results, making it impossible to confirm the LVEF.
Study outcome
The primary outcome of the study was the diagnostic performance of the AI-ECG algorithm in identifying patients with LVSD based on ECG signals collected using the portable six-lead system (AliveCor KardiaMobile 6L). The LVSD was defined as an LVEF of ≤40% on echocardiography, with preferential use of modified biplanar Simpson’s method.12 Performance was assessed using the area under the receiver operating characteristic curve (AUROC) and the area under the precision-recall curve (AUPRC), along with sensitivity, specificity, positive predictive value (PPV), and negative predictive value (NPV). These metrics were calculated using a prespecified threshold derived from prior research, determined by the Youden index.13 The model performance was also tested in classifying the LVEF levels of ≤35% and ≤50%. Furthermore, we developed a regression framework to estimate the numerical values of LVEF.
Artificial intelligence model based on the electrocardiogram signals
We have been investigating an AI-ECG model for detecting LVSD in adults since 2019, leading to the development of AiTiA left ventricular systolic dysfunction (AiTiALVSD; version 1.00.00; Medical AI Co., Ltd, Seoul, Korea).13 The model design for 12-lead AI-ECG has been previously described.14 Briefly, AiTiALVSD was developed using a residual neural network (ResNet) architecture. The input data consisted solely of digital signals of ECGs, without incorporating any additional clinical variables. The software produced an LVSD probability score, presented as a decimal value ranging from 0 to 100, with precision to the first decimal place. This AI model was developed using 55 163 retrospectively collected ECGs from 22 765 patients to detect LVSD and showed an AUROC of 0.843 [95% confidence interval (CI) 0.840–0.845] and 0.889 (95% CI 0.887–0.891) in internal and external validation datasets, respectively.13 This AI algorithm was approved as an ‘Innovative Medical Device’ by the Korean Ministry of Food and Drug Safety, which is a designation comparable to the Priority Medicines in the European Association or the ‘Breakthrough Device Program’ in the USA.
In this study, we tuned the existing AiTiALVSD, originally developed for 12-lead ECG data, to accommodate 6-lead (I, II, III, aVR, aVL, and aVF) and single-lead (lead I) ECG formats by adjusting only the input layer of the model. Each model was retrained on the same dataset used to develop AiTiALVSD. Aside from the difference in the number of leads, every ECG sample underwent the same preprocessing steps used for the original 12-lead setup, ensuring a uniform data structure. Specifically, AiTiALVSD can accept standard ECG samples that include only eight leads (I, II, and V1–V6) by generating the remaining limb leads (III, aVR, aVL, and aVF) via Einthoven’s equations. Likewise, the six-lead model applies the same approach to derive additional limb leads from Leads I and II when necessary. Because ECG devices may record signals at different sampling rates, all signals were resampled to a fixed rate. This setup facilitates a direct comparison of how varying the number of leads influences performance, as the models share the same underlying dataset, preprocessing methods, and core design.
Data acquisition and analysis
All patients enrolled in this study had a six-lead ECG recorded using the hand-held portable AliveCor KardiaMobile device (AliveCor, San Francisco, CA, USA) during their echocardiography sessions. Of note, the six-lead ECG of the AliveCor KardiaMobile 6L received approval in Korea from the Korean Ministry of Food and Drug Safety in 2020, and by authorities in the USA and Europe. The conventional 12-lead ECG data were collected in the supine position at a sampling rate of 500 Hz and were obtained in the XML format by the MUSE ECG system (GE Healthcare, Wauwatosa, WI, USA). Laboratory data, including NT-proBNP, were acquired at the discretion of the physician. The data underlying this article will be shared on reasonable request to the corresponding author.
Statistical analysis
The AI-ECG model performance on the six-lead portable ECG was compared with that on the conventional resting 12-lead ECG and NT-proBNP. In addition, several subgroup analyses were conducted, categorized by age, sex, hypertension, diabetes, ischaemic heart disease, stroke, and heart failure. For an exploratory analysis, we also compared LVEF predicted by a regression-based AI-ECG model with that obtained through echocardiography. A scatter plot was generated to visualize the relationship between the real LVEF by echocardiography and AI-ECG predicted LVEF value. This model was implemented using the transfer learning method, and the activation function of the last node of the AI algorithm was changed from a sigmoid one to a linear one to generate the predicted LVEF values. Pearson’s correlation coefficient was calculated to quantify the linear relationship between the two LVEF values. To comprehend the AI-ECG model and compare it with the existing medical knowledge, it was essential to identify regions that significantly influenced the decision of the developed model. We utilized a gradient-weighted class activation mapping through a saliency method for this purpose.15
Baseline characteristics were presented as either mean ± standard deviation or median (interquartile range) for continuous variables, and as counts (percentages) for categorical variables. The χ2-test or Fisher’s exact test was utilized for comparing categorical variables, while Student’s t-test or the Mann–Whitney U-test was employed for continuous variables. To assess the regression model, we employed the mean absolute error (MAE) as the metric for evaluation. All statistical analyses were conducted using R software (version 4.1.0; R Foundation, Vienna, Austria) and Python (version 3.8; Python Software Foundation, Wilmington, DE, USA). P-values <0.05 were considered statistically significant.
Results
Baseline characteristics
Over the study period, 1716 consecutive adult patients were recruited, of whom 81 were excluded due to poor ECG data quality or missing LVEF values on echocardiography. The mean age of the study participants was 60.6 ± 13.2 years, and 50% were male. There were 163 out of 1635 participants with LVEF ≤40%. These participants were more likely to be older and had more comorbidities, such as hypertension, diabetes, ischaemic heart disease, and heart failure, when compared with those without LVSD. Approximately 65.3% (n = 1079) of study participants were identified to have resting 12-lead ECG taken within a median interval of 2 days (interquartile range, 1–9) from the date of echocardiography (Table 1).
Baseline characteristics of the study participants
| Entire participants | LVSD (LVEF ≤ 40%) | Non-LVSD (LVEF > 40%) | P-value | |
|---|---|---|---|---|
| Number of patients, n | 1635 | 163 | 1472 | |
| Age, year | 60.6 ± 13.2 | 64.0 ± 13.9 | 60.2 ± 13.0 | <0.001 |
| Male, n (%) | 817 (50.0) | 133 (78.7) | 684 (46.1) | <0.001 |
| Past medical history | ||||
| Hypertension | 1151 (70.4) | 160 (94.7) | 991 (66.8) | <0.001 |
| Diabetes mellitus | 570 (34.9) | 108 (63.9) | 462 (31.1) | <0.001 |
| Ischaemic heart disease | 516 (31.6) | 88 (52.1) | 428 (28.8) | <0.001 |
| Stroke | 116 (7.1) | 16 (9.5) | 100 (6.7) | 0.785 |
| Heart failure | 293 (17.9) | 137 (81.1) | 156 (10.5) | <0.001 |
| Smoking | 0.169 | |||
| None smoker | 593 (36.3) | 46 (27.2) | 547 (36.9) | |
| Former smoker | 254 (15.5) | 44 (26.0) | 210 (14.2) | |
| Current smoker | 160 (9.8) | 22 (13.0) | 138 (9.3) | |
| Unknown | 646 (39.5) | 57 (33.7) | 589 (39.7) | |
| Laboratory findings | ||||
| Haemoglobin (g/dL) | 13.0 ± 2.0 | 13.4 ± 2.2 | 13.0 ± 2.0 | 0.021 |
| Creatinine (mg/dL) | 1.5 ± 2.4 | 1.7 ± 2.4 | 1.4 ± 2.4 | 0.110 |
| eGFR (mL/min/1.73 m2) | 73.2 ± 27.9 | 61.4 ± 29.3 | 74.4 ± 27.5 | <0.001 |
| B-type natriuretic peptide (pg/mL) | 760.2 ± 1765.5 | 2066.0 ± 2950.2 | 316.9 ± 694.5 | <0.001 |
| N-terminal pro-B-type natriuretic peptide (pg/mL) | 2129.2 ± 6273.7 | 4259.0 ± 8181.1 | 1499.6 ± 5445.7 | <0.001 |
| Echocardiographic parameters | ||||
| Left ventricular end-diastolic diameter (mm) | 48.5 ± 6.7 | 59.6 ± 7.3 | 47.2 ± 5.3 | <0.001 |
| Left ventricular end-systolic diameter (mm) | 31.2 ± 6.7 | 48.7 ± 6.7 | 29.9 ± 4.7 | <0.001 |
| Interventricular septal thickness (mm) | 9.5 ± 1.8 | 9.5 ± 1.9 | 9.5 ± 1.8 | 0.994 |
| Left ventricular posterior wall thickness (mm) | 9.3 ± 1.5 | 9.7 ± 1.4 | 9.2 ± 1.5 | 0.001 |
| Left atrial diameter (mm) | 40.4 ± 8.2 | 45.8 ± 9.2 | 39.8 ± 7.8 | <0.001 |
| Aortic diameter (mm) | 33.3 ± 7.6 | 34.7 ± 4.2 | 33.2 ± 7.9 | 0.014 |
| Left atrial volume (mL) | 63.7 ± 37.9 | 89.9 ± 46.7 | 60.7 ± 35.5 | <0.001 |
| Left atrial volume index (mL/m2) | 38.4 ± 22.2 | 52.7 ± 28.4 | 36.9 ± 20.9 | <0.001 |
| Mitral inflow E (m/s) | 0.7 ± 0.3 | 0.7 ± 0.3 | 0.7 ± 0.3 | 0.305 |
| Mitral inflow A, (m/s) | 0.7 ± 0.3 | 0.6 ± 0.2 | 0.7 ± 0.4 | 0.030 |
| Mitral inflow DT (msec) | 204.6 ± 66.4 | 188.7 ± 76.1 | 206.1 ± 65.2 | 0.003 |
| Mitral inflow E/A | 1.0 ± 0.6 | 1.2 ± 0.9 | 1.0 ± 0.6 | 0.011 |
| Mitral annular medial e′ (cm/s) | 6.8 ± 2.3 | 4.2 ± 1.2 | 6.9 ± 2.3 | <0.001 |
| Mitral annular medial a′ (cm/s) | 8.4 ± 2.0 | 6.4 ± 1.5 | 8.5 ± 2.0 | <0.001 |
| Mitral annular medial s′ (cm/s) | 7.2 ± 1.7 | 4.3 ± 1.2 | 7.3 ± 1.6 | <0.001 |
| Mitral valve E/e′ (medial) | 10.8 ± 6.1 | 16.0 ± 6.7 | 10.6 ± 6.0 | <0.001 |
| Pulmonary artery systolic pressure (mmHg) | 32.0 ± 8.1 | 38.5 ± 13.4 | 31.2 ± 6.7 | <0.001 |
| Left ventricular outflow tract diameter (mm) | 21.3 ± 5.1 | 22.0 ± 2.1 | 21.2 ± 5.3 | 0.072 |
| Sinus Valsalva diameter (mm) | 33.7 ± 8.8 | 34.9 ± 4.3 | 33.6 ± 9.2 | 0.076 |
| ST junction (mm) | 27.1 ± 3.8 | 27.71 ± 3.6 | 27.1 ± 3.8 | 0.050 |
| Ascending aorta diameter (mm) | 34.1 ± 4.7 | 34.8 ± 2.7 | 34.0 ± 4.8 | 0.548 |
| Left ventricular mass (g) | 161.8 ± 56.3 | 231.1 ± 61.5 | 154.8 ± 50.8 | <0.001 |
| Left ventricular mass index (g/m2) | 95.0 ± 30.1 | 134.6 ± 35.2 | 90.9 ± 26.5 | <0.001 |
| Left ventricular ejection fraction (%) | 56.7 ± 10.4 | 31.6 ± 6.3 | 59.5 ± 6.0 | <0.001 |
| Six-lead echocardiography interval (days) | 0.3 ± 4.0, 0 (0–0) | 1.4 ± 8.8, 0 (0–0) | 0.15 ± 3.0, 0 (0–0) | <0.001 |
| Twelve-lead echocardiography interval (days) | 11.1 ± 19.9, 2 (1–9) | 10.6 ± 19.8, 2 (1–8) | 11.13 ± 19.9, 2 (1–9) | 0.792 |
| Electrocardiographic parameters (12-lead) | ||||
| Heart rate (b.p.m.) | 71.9 ± 14.0 | 77.1 ± 16.0 | 71.1 ± 13.6 | <0.001 |
| PR intervala (msec) | 167.4 ± 28.9 | 172.7 ± 34.3 | 166.8 ± 28.1 | 0.050 |
| P wave durationa (msec) | 112.0 ± 13.2 | 110.3 ± 18.5 | 112.2 ± 12.4 | 0.162 |
| QT interval (msec) | 411.0 ± 42.3 | 425.2 ± 55.2 | 409.1 ± 39.9 | <0.001 |
| QRS duration (msec) | 98.2 ± 21.6 | 115.7 ± 29.6 | 95.8 ± 19.1 | <0.001 |
| QRS duration | <0.001 | |||
| ≥ 120 msec | 119 (11.0) | 43 (32.8) | 76 (8.0) | |
| < 120 msec | 958 (88.8) | 88 (67.2) | 870 (91.8) | |
| QTc interval (msec) | 444.0 ± 35.5 | 474.1 ± 44.2 | 439.8 ± 32.0 | <0.001 |
| P axisa | 49.8 ± 22.4 | 54.9 ± 19.4 | 49.2 ± 22.7 | 0.016 |
| R axis | 34.0 ± 45.2 | 17.4 ± 68.5 | 36.3 ± 40.4 | <0.001 |
| T axis | 52.1 ± 48.1 | 79.24 ± 80.8 | 48.4 ± 40.3 | <0.001 |
| Left bundle branch block | 17 (1.6) | 7 (5.3) | 10 (1.1) | 0.008 |
| Right bundle branch block | 66 (6.1) | 12 (9.2) | 54 (5.7) | 0.662 |
| Left anterior fascicular block | 12 (1.1) | 4 (3.1) | 8 (0.8) | 0.276 |
| Atrial fibrillation/flutter | 109 (10.1) | 24 (18.3) | 85 (9.0) | 0.025 |
| Pacemaker rhythm | 30 (2.8) | 10 (7.6) | 20 (2.1) | 0.011 |
| AiTiALVSD-12L score | 10.1 ± 21.7 | 54.1 ± 29.3 | 4.0 ± 10.5 | <0.001 |
| AiTiALVSD-6L score | 16.5 ± 19.4 | 51.2 ± 21.3 | 12.6 ± 14.6 | <0.001 |
ECG, electrocardiogram; DT, deceleration time; eGFR, estimated glomerular filtration rate.
aP wave measurements or PR intervals were obtained from 970 patients with valid P waves.
Performance of the six-lead artificial intelligence model based on electrocardiogram for left ventricular systolic dysfunction
The AI-ECG model with the six-lead ECG data acquired from AliveCor KardiaMobile 6L achieved an AUROC of 0.924 (95% CI 0.903–0.944) (Figure 2A). Using a prespecified threshold, the model showed 83.4% sensitivity (95% CI 77.8–89.0%), 88.7% specificity (95% CI 87.1–90.4%), 45.8% PPV (95% CI 40.2–51.3%), 97.9% NPV (95% CI 97.2–98.7%) and an AUPRC of 0.623 (95% CI 0.562–0.687) (Table 2). The AI-ECG model tested on conventional resting 12-lead ECG showed a higher AUROC of 0.962 (95% CI 0.947–0.977) than that on six-lead ECG. Of the 1635 participants, NT-proBNP was performed and matched for 381 individuals. The AUROC of NT-proBNP for detecting LVSD was 0.774 (95% CI 0.725–0.824). With the use of different threshold values for LVSD, the performance of the six-lead AI-ECG tended to improve with stricter criteria for LVSD (Figure 2B–D and Supplementary material online, Table S1).
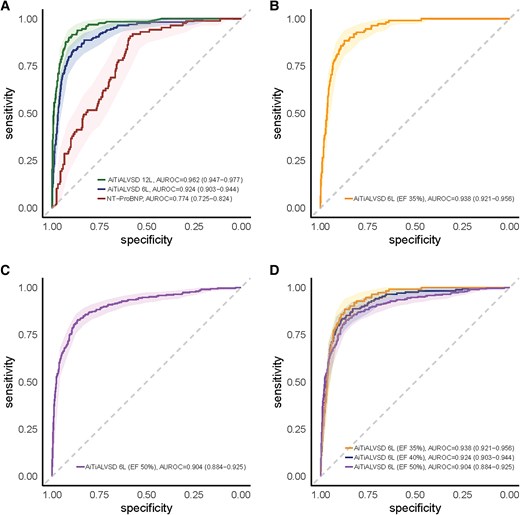
Performance of the artificial intelligence model based on various electrocardiogram signals. Receiver operating characteristic curves illustrating the diagnostic performance of the artificial intelligence model based on electrocardiogram signals for detecting left ventricular systolic dysfunction. (A) Comparison of the artificial intelligence model based on electrocardiogram signals using the 12-lead, 6-lead, and N-terminal pro-B-type natriuretic peptide. (B) Performance of the six-lead artificial intelligence model based on electrocardiogram signal with an LVEF threshold of ≤35%. (C) Performance of the six-lead artificial intelligence model based on electrocardiogram signal with an LVEF threshold of ≤50%. (D) Comparison of the six-lead artificial intelligence model based on electrocardiogram signal performance across different LVEF thresholds (≤35%, ≤40%, and ≤50%).
Comparison of the model performance by each modality
| AUROC (95% CI) | AUPRC (95% CI) | Sensitivity (95% CI) | Specificity (95% CI) | PPV (95% CI) | NPV (95% CI) | |
|---|---|---|---|---|---|---|
| AI-ECG based on hand-held portable six-lead ECG (n = 1635) | 0.924 | 0.623 | 0.834 | 0.887 | 0.458 | 0.979 |
| (0.903–0.944) | (0.562–0.687) | (0.778–0.890) | (0.871–0.904) | (0.402–0.513) | (0.972–0.987) | |
| AI-ECG based on conventional 12-lead ECG (n = 1079) | 0.962 | 0.817 | 0.901 | 0.911 | 0.584 | 0.985 |
| (0.947–0.977) | (0.764–0.864) | (0.850–0.952) | (0.893–0.929) | (0.516–0.652) | (0.977–0.993) | |
| NT-proBNP (n = 381) | 0.774 | 0.648 | 0.908 | 0.588 | 0.395 | 0.956 |
| (0.725–0.824) | (0.567–0.738) | (0.847–0.969) | (0.532–0.945) | (0.327–0.463) | (0.926–0.986) |
AUPRC, area under the precision-recall curve; AUROC, area under the receiver operating characteristic curve; CI, confidence interval; ECG, electrocardiogram; NPV, negative predictive value; NT-proBNP, N-terminal pro-B-type natriuretic peptide; PPV, positive predictive value.
Supplementary material online, Figure S1, shows examples of six-lead ECGs of patients with and without LVSD. The areas on six-lead ECG with higher probabilities of being linked to LVEF are highlighted in red using gradient-weighted class activation mapping. Patient A, with a score of 0.6 and an LVEF of 55%, showed a narrow QRS, whereas patient B, with a score of 97.1 and an LVEF of 21%, showed wide QRS. Unexpectedly, the regions highly linked with the low LVEF on six-lead ECG were predominantly outside of the QRS wave.
Comparison of the six-lead artificial intelligence model based on electrocardiogram performance in the prespecified subgroups
Figure 3 illustrates the performance of the six-lead AI-ECG based on subgroups defined by age, sex, hypertension, diabetes, ischaemic heart disease, and stroke. Although the performances were similar across subgroups, there was no significant interactions between subgroups, except for the history of heart failure: the presence of heart failure showed a significant interaction with a P-value of 0.032. Similarly, the model performance was similar across various electrocardiographic characteristics, but showed slightly lower AUROC in patients with left bundle branch block (see Supplementary material online, Table S2).
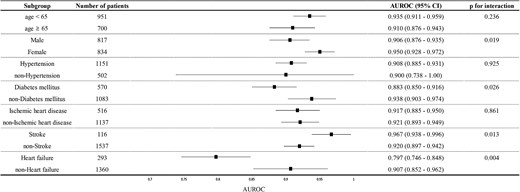
Forest plot for subgroup analysis. The forest plot demonstrating the efficacy of the six-lead artificial intelligence model based on electrocardiogram and its possible different efficacy for predicting left ventricular systolic dysfunction by the prespecified characteristics. The plot highlights that although area under the receiver operating characteristic curve values are generally consistent across subgroups, the presence of heart failure significantly affects the model’s performance.
Prediction of left ventricular ejection fraction using the six-lead artificial intelligence model based on electrocardiogram
A deep learning model was developed to predict the LVEF value from pairs of echocardiography and six-lead ECG data using a regression approach. The MAE was 8.89% (95% CI 8.61–9.17%). Supplementary material online, Figure S2, displays a scatterplot that illustrates the correlation between the predicted LVEF values using the six-lead AI-ECG and the LVEF by echocardiography.
Discussion
This study prospectively validated the diagnostic performance of the AI-ECG model based on the six-lead hand-held portable device for detecting LVSD. To the best of our knowledge, this is the first study to apply AI-ECG diagnostics to a six-lead portable ECG device prospectively. The key strengths of the study are as follows. First, our model, developed on retrospective 12-lead data, was successfully validated in the real-world through all-comers prospectively collected six-lead data, with a high AUROC of 0.924. Second, the performance of the six-lead AI-ECG model is comparable to that of conventional 12-lead ECG models, confirming its efficacy and potential utility in clinical settings, as well as its applicability for more accessible community screening. Lastly, incorporating a regression model has demonstrated a moderate capability of the AI-ECG technology to calculate LVEF. Altogether, we have comprehensively validated and highlighted the feasibility and scalability of applying AI-ECG technology to a hand-held portable ECG device.
Potential of the six-lead electrocardiogram artificial intelligence model to screen left ventricular systolic dysfunction
In recent advances within the domain of cardiovascular diagnostics, the development of the AI-enabled ECG models has notably accelerated.8,16 Despite this progress, most of the developed models so far has relied heavily on 12-lead ECG systems, which are not applicable in settings where the system may not be available or cumbersome to collect easily. This leaves a considerable need for the utility of portable devices as tools for community-based screening, an area that remains underexplored.17–20
The current study demonstrated that the six-lead ECG AI model can demonstrate a sufficient AUROC of 0.924, with sensitivity and specificity of 83.4% and 88.7%, respectively. These metrics robustly suggest the device’s potential functionality as a screening tool, particularly when considering established precedents for screening such as the Pap smear for uterine cancer or low-dose computed tomography scans for lung cancer.21,22 An analogy to our investigation that aims to analyse the effectiveness of AI diagnostics based on portable devices would be one based on signals collected by a stethoscope:18 a study by Bachtiger et al. employing a stethoscope-based single lead for detecting LVSD reported an AUROC of 0.85, with sensitivity and specificity of 84.8% and 69.5%, respectively. While acknowledging the differences in clinical settings, devices, and methodologies applied, it is noteworthy that the performance of our model is comparable to the models using other portable devices and even possibly, better in some aspects. The greatest difference between our study and the previous study lies in the versatility that comes from the different users of portable devices: while an ECG-enabled stethoscope can be utilized in a primary care setting to aid physicians in more comprehensively understanding the patient, the six-lead portable device can be more widely used in a home-based setting.
In the subgroup analysis, we demonstrated that the model operates effectively across diverse clinical characteristics. Notably, we observed that patients with a history of heart failure tended to show a lower AUROC (0.797). This discrepancy may be attributed to the varying factors, such as the condition’s reversibility, and the extent of irreversible changes in the ECG during the course of treatment or management of other underlying diseases.23,24 For example, although treatments for heart failure, such as sacubitril-valsartan, can improve ECG parameters, such as QTc interval and QRS duration as well as LVEF, these changes do not always correspond proportionally and may have contributed to the lower performance of the algorithm in this subgroup.25,26 These findings underscore the importance of considering patient-specific factors when interpreting AI-ECG results, especially in populations with pre-existing heart conditions. However, it is important to note that the AUROC for this patient group is comparable to previously established screening tests for other diseases, like Pap smear test.21,22 Additionally, as patients with pre-existing congestive heart failure are generally not considered candidates for LVSD screening, the clinical utility of our model, which performed better in patients without congestive heart failure, remains valid.
When analysing the impact of QRS duration and other ECG patterns on the performance of the six-lead AI-ECG model, we observed variations in the AUROC values: 0.863 in patients with atrial fibrillation or flutter, 0.883 in cases with QRS duration ≥120 msec, and 0.771 in those with left bundle branch block. These findings align with prior studies, such as Sebastian et al., which reported lower performance in subgroups with wide QRS complexes or atrial fibrillation.27 Since these electrical abnormalities are often considered indicators of structural heart disease and typically prompt echocardiographic evaluation, their impact on AI-ECG performance may be less relevant in the context of population-level LVSD screening. However, the observed variations may highlight the need to account for these subgroups separately when developing and applying AI-ECG models for LVSD detection in the future.
The performance metrics of the six-lead ECG AI model, with LVEF thresholds at ≤35% and ≤50%, suggest areas for potential model improvement based on these thresholds. Notably, the model demonstrated an NPV of 99% at an LVEF threshold of 35% and a PPV of 58.5% at a cutoff of 50%, highlighting the possibility of tuning the balance between minimizing false negatives and false positives according to the medical environment and resource allocation. For example, higher accuracy with stricter LVEF thresholds indicates that using stricter thresholds can be beneficial in clinical settings where precise identification of high-risk patients is essential.
Accuracy considerations and clinical application
Numerous prior studies have elaborated on how AI-ECG models detect LVSD.28,29 These models are understood to focus on subtle ECG changes resulting from minor chamber and myocyte changes detected by deep learning algorithms. Concurrently, our research group has consistently compared the accuracy of the AI-ECG models with the ECG signals obtained through smartwatches or 6 limb lead signals with those obtained from the traditional 12-lead ECGs.19,30 Given that the amount of information is arithmetically reduced by half or even more when using the six-lead signals than the 12-lead counterparts, it logically follows that the analysis might yield less data. Indeed, previous studies have also showed reduced accuracy with a fewer number of leads, a finding consistent with our comparison between the 6 and 12-lead AI-ECG.14,20 Although not presented in this study, our exploratory analysis, which analysed single-lead AI-ECG with the same study participants, showed even a lower AUROC compared with the six-lead system.
There are very few prospective studies that have validated the efficacy of AI-ECG using smartwatches or portable devices instead of the 12-lead ECGs. Bachtiger et al. analysed single-lead ECGs from a portable device designed for cardiac auscultation and reported an AUROC of 0.85 (95% CI 0.81–0.89), sensitivity of 84.8%, and specificity of 69.5% in 1050 patients.18 Similarly, Attia et al. used a smartwatch for detecting LVSD in 2454 subjects and found an AUROC of 0.885 (95% CI 0.823–0.946).29 Although direct comparison with these studies is challenging due to the use of single-lead ECGs, our study’s six-lead AI-ECG model demonstrated a superior AUROC of 0.924, indicating enhanced diagnostic performance and potential clinical utility in identifying LVSD, and yet, without breaching the ease of acquiring the ECG signals. The variation in accuracy between the six-lead and single-lead systems suggests a trade-off between information richness and device convenience. Enhanced engineering efforts and broader consensus on standards are needed to further validate these AI models in real-world settings.
Future perspectives and limitations
AI-ECG is anticipated to significantly aid individuals with limited access to imaging tests or cardiologists, offering expansive potential for its application.31 We have identified the feasibility of extending this AI-ECG technology to portable devices or smartwatches, opening new avenues for its use. While clinical studies on layperson-operated diagnostics or screening at the general population level have yet to be conducted, this area remains ripe for further exploration. Moreover, considering the scarcity of long-term follow-up data, particularly concerning false positives, it is imperative to plan for extended tracking of this research cohort. This will enhance our understanding of AI-ECG’s long-term reliability and contribute to refining its clinical utility. As the widespread adoption of home blood pressure monitors and routine screening has significantly transformed the landscape of hypertension and cardiovascular disease management,32 the integration of portable ECG devices with advanced AI algorithms may also revolutionize disease management, enhancing early detection, diagnosis, and treatment outcomes. Notably, the AI-ECG provides a numerical probability of LVSD, and when this value exceeds a predefined threshold, it indicates the presence of LVSD with 83% sensitivity and 89% specificity. Straightforward AI-generated outputs allow healthcare providers in primary care and remote settings to utilize the device effectively without specialized training and enhances its potential for widespread community-level screening, particularly in areas with limited access to advanced cardiac diagnostics. To enable community-scale adoption of AI-ECG, the challenges posed by false positives and negatives must be addressed. The high NPV demonstrated in our research reliably excludes LVSD and would minimize unnecessary follow-ups. While false positives may lead to redundant diagnostics and increased costs, the non-invasive nature and ease of repeated testing with AI-ECG provide a practical means to mitigate these challenges. Notably, a recent study has demonstrated that integrating AI-ECG into clinical practice remains cost-effective despite considering these challenges, supporting its broader application.33
Notwithstanding the promising future of AI-ECG models, there are certain limitations that remain crucial for interpreting the results. First, this study was conducted at a single centre in South Korea. Consequently, generalizing these results to broader demographics—especially to primary healthcare facilities, the general population, or other ethnic groups—requires a cautious approach. Second, only patients who had been in contact with the medical system were included, which may not represent a fully generalizable screening population. This selection could have influenced performance characteristics, particularly PPVs. Third, only a single threshold value derived from the Youden index was used in this study. However, individualized threshold according to age, sex, and comorbidities could potentially enhance the model performance. Before these thresholds are firmly defined, the model output value can be provided as a continuous variable as an alternate, leaving it at the discretion of each physician to decide whether to conduct further diagnostic testing, such as echocardiography. Fourth, our AI-ECG model functions as a ‘black box’, lacking transparency in its decision-making process. This opacity raises ethical concerns and may hinder clinical adoption due to potential reluctance among clinicians to trust AI-generated recommendations without understanding the underlying rationale.34 Although methods like saliency maps or heat maps were employed to enhance interpretability, recent research suggests that these techniques may offer limited explanatory power and might not significantly improve the model’s transparency.35 Consequently, further work is needed to develop more interpretable AI models or to enhance existing methods to better explain AI decision-making processes, thereby increasing clinician trust and facilitating integration into clinical practice.
Conclusion
In conclusion, this study demonstrates that an AI model derived from the six-lead hand-held portable ECG device can effectively identify LVSD, presenting a promising alternative to that derived from the conventional 12-lead ECG. By proving the practicality and accuracy of the portable AI-ECG for early cardiac dysfunction detection, our findings suggest a pathway for integrating advanced diagnostics into everyday health assessments, streamlining and enhancing cardiac care.
Supplementary material
Supplementary material is available at European Heart Journal—Digital Health.
Acknowledgements
None.
Author contributions
Jaehyun Lim (MD): Conceptualization, Resources, Formal analysis, Investigation, Visualization, Investigation, Project administration, Writing – original draft and Writing – review & editing; Hak Seung Lee (MD): Conceptualization, Resources, Methodology, Formal analysis, Investigation, Writing – original draft and Writing – review & editing; Ga In Han & Sora Kang: Resources, Data curation, Formal analysis, and Software; Jong-Hwan Jang (MD), Yong-Yeon Jo (MD), & Jeong Min Son (MD): Resources, Data curation, Methodology, Validation and Investigation; Min Sung Lee (MD): Data curation, Investigation, Methodology and Writing – original draft; Joon-Myoung Kwon (MD); Conceptualization, Software, Investigation, and Project administration; Seung-Pyo Lee (MD, PhD): Conceptualization, Funding acquisition, Project administration, and Writing – review & editing.
Funding
This research was supported by non-restrictive grants to S.-P.L. from Medical AI Co., Ltd, for which he received no personal compensation.
Data availability
The data underlying this article will be shared on reasonable request to the corresponding author.
References
Author notes
Conflict of interest: H.S.L., G.I.H., S.K., J.-H.J., Y.-Y.J., J.M.S., M.S.L., and J.-M.K. are employees of Medical AI Co., Ltd and are involved in an equity/royalty relationship with Medical AI Co., Ltd. J.-M.K. is the founder of Medical AI Co., Ltd. S.-P.L. is involved in an equity with Medical AI Co., Ltd.
