


Abstract
To assess the agreement between left ventricular end-diastolic diameter index (LVEDDi) and volume index (LVEDVi) to define LV dilatation and to investigate the respective prognostic implications in patients with heart failure (HF).
Patients with HF symptoms and LV ejection fraction (LVEF) < 50% undergoing cardiac magnetic resonance were evaluated retrospectively. LV dilatation was defined as LVEDDi or LVEDVi above the upper normal limit according to published reference values. Patients were followed up for the combined endpoint of cardiovascular death or HF hospitalization during 5 years. A total of 564 patients (median age 64 years; 79% men) were included. LVEDDi had a modest correlation with LVEDVi (r = 0.682, P < 0.001). LV dilatation was noted in 84% of patients using LVEDVi-based definition and in 73% using LVEDDi-based definition, whereas 20% of patients displayed discordant definitions of LV dilatation. During a median follow-up of 2.8 years, patients with both dilated LVEDDi and LVEDVi had the highest cumulative event rate (HR 3.00, 95% CI 1.15–7.81, P = 0.024). Both LVEDDi and LVEDVi were independently associated with the primary outcome (hazard ratio 3.29, 95%, P < 0.001 and 2.8, P = 0.009; respectively).
The majority of patients with HF and LVEF < 50% present both increased LVEDDi and LVEDVi whereas 20% show discordant linear and volumetric definitions of LV dilatation. Patients with increased LVEDDi and LVEDVi have the worst clinical outcomes suggesting that the assessment of these two metrics is needed for better risk stratification.
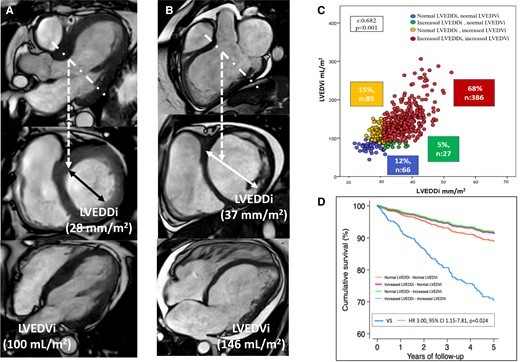
Left ventricular dilatation based on linear dimension (left ventricular end-diastolic diameter) or volumetric dimension (left ventricular end-diastolic volume) vs prognosis. Panel A shows the 3-chamber reconstruction of the left ventricle from a cardiac magnetic resonance (CMR) cine image. The dotted line demarcates the plane where the short-axis of the left ventricle is acquired and where the left ventricular endi-diastolic diameter is measured and indexed , LVEDDi). The 4-chamber view of the left ventricle is shown and the left ventricular end-diastolic volume is measured from stacks of short-axis and indexed to body surface area (LVEDVi). In this case, the LVEDDi is non-dilated whereas the LVEDVi is dilated. Panel B shows the CMR data of a patient with dilated left ventricle based on LVEDDi and LVEDVi. Panel C shows the correlation between LVEDDi and LVEDVi and the 4 groups of patients based on the dilatation of one or the other dimension or both. Panel D shows the cumulative survival curves for each group of patients.
Introduction
Heart failure (HF) is currently classified according to left ventricular ejection fraction (LVEF),1 the most frequently used metric of left ventricular (LV) performance in clinical practice. Left ventricular dilatation, hallmark of LV remodelling, is considered an adaptive response to maintain stroke volume and normal cardiac output and has been the focus of HF therapies clinical trials.2,3 The degree of LV remodelling is the main determinant of LVEF. However, LV volumes and mass relate more closely to the impact of therapy and prognosis than LVEF does and therefore, they will be more appropriate parameters to phenotype patients with HF.4,5 LV dilatation is mainly assessed in clinical practice with two-dimensional echocardiography, measuring LV diameters and volumes. However, there are inherent limitations of two-dimensional echocardiography that impact on the accuracy of the measurements (i.e. foreshortened images and inaccurate plane of acquisition), particularly in dilated LV.6 In addition, the equivalence of LV dilatation based on LV diameters and LV volumes has not been well established. Regional LV remodelling may lead to dilated LV diameter but normal LV volume and vice versa. Three-dimensional echocardiography and cardiac magnetic resonance (CMR) provide more accurate quantification of LV volumes than two-dimensional echocardiography and overcome the limitations of the geometric assumptions used by two-dimensional echocardiography. These techniques would allow the measurement of the largest LV diameter and provide a better correlation between LV diameter and volume. However, the correlation between LV diameter and volume measured with three-dimensional imaging techniques has not been studied and the relative merits of each parameter to predict long-term prognosis in patients with HF has not been explored. Accordingly, the aim of this study was two-fold: (1) to evaluate the frequency of LV dilatation when defined based on a volumetric assessment vs. a linear (diameter) measurement in a cohort of patients with HF undergoing CMR and (2) to investigate the association between each LV dilatation definition and the occurrence of clinical outcomes at follow-up.
Methods
Patient population
Patients with HF symptoms who underwent clinically indicated CMR at the Hospital University Germans Trias i Pujol (Badalona, Spain) from 2009 to December 2021 were retrospectively identified. Patients were selected if LVEF at the time of CMR was <50%. Demographic data, comorbidities, renal function, and HF therapies were retrieved from clinical records. Ischaemic heart failure was defined by the presence of obstructive coronary artery disease.7 The study complied with the personal data law protection and the international guidelines on clinical investigations from the World Medical Association’s Declaration of Helsinki. The local ethics committee approved the study (REGI-UNIC PI-18-037 and ICOR-2019-04-EB-IDI).
Cardiac magnetic resonance data acquisition and analysis
Cardiac magnetic resonance scans were performed with a 1.5 Tesla magnetic resonance imaging scanner (Achieva dStream; Philips, The Netherlands) or 3 Tesla magnetic resonance imaging scanner (Verio; Siemens Medical Imaging, Erlangen, Germany), with the patient in the supine position and a 16-element phased-array coil placed over the chest. Images were acquired during breath-holds with electrocardiogram gating. A segmented k-space steady-state free-precession sequence [repetition time 44.70 ms; echo time 1.26 ms; flip angle 60–78; matrix 272; spatial resolution (1.3–1.5) × (1.3–1.5) × 8 mm depending on the field of view] was used for cine imaging in parallel short-axis (contiguous slices of 8 mm thickness, 2 mm gap, covering from base to apex) and three long-axis views of the LV. Late gadolinium enhanced (LGE) images were acquired with a segmented gradient-echo inversion-recovery sequence (repetition time 600–800 ms depending on heart rate; echo time 3.24 ms; flip angle 25; matrix 256; spatial resolution 1.3 × 1.3 × 8 mm) 10 to 20 min after intravenous gadolinium-diethylenetriaminepentaacetic acid administration (0.15 mmol/kg; Gadovist, Bayer Schering Pharma AG, Berlin, Germany) at matching cine-image slice locations.8 The inversion time was optimized to null the normal myocardium. Adjusted views per segment and trigger delay were optimized according to the patient’s heart rate. All images were reviewed and analysed off-line with a specialized post-processing software (Intellispace Portal v8, Philips, The Netherlands) blinded to the clinical data and outcome. For volumetric analysis, LV endocardial borders were manually traced on all short-axis cine images at end-diastole and the LV end-diastolic volume (LVEDV) was measured and indexed for body surface area (BSA) according to the DuBois and DuBois formula.9 The endocardial contours excluded the papillary muscles. For linear measurements, the left ventricular end-diastolic diameter (LVEDD) was measured in a basal short-axis slice of the LV, as the distance between the anteroseptal and inferolateral walls, mimicking the echocardiographic parasternal long-axis view, and was also indexed by BSA. The LV mass was calculated by subtracting the endocardial volume from the epicardial volume at end-diastole and multiplying by the tissue density (1.05 g/mL).10
LV dilation based on LVEDVi was defined as an LVEDVi above the upper normal limit according to published reference values normalized by age and gender.11 LV dilation based on LVEDDi was defined as an LVEDDi above the upper normal limit according to reference cut-off values normalized by gender and BSA of the European Association of Cardiovascular Imaging and American Society of Echocardiography guidelines.12 Based on the concordance of the volumetric and the linear definitions of LV dilation, four different groups were created: Group 1 (normal LVEDDi and LVEDVi), Group 2 (increased LVEDDi but normal LVEDVi), Group 3 (normal LVEDDi but increased LVEDVi), and Group 4 (increased both LVEDDi and LVEDVi).
Follow-up
All patients were followed up regularly at the HF clinic. The clinical evaluation and treatment of patients were directed by the treating physician according to a unified protocol based on current clinical practice guidelines recommendations.1,13–17 The primary endpoint of the study was the combined endpoint of cardiovascular death or HF hospitalization (whichever came first) during 5 years of follow-up. A death was considered cardiovascular if caused by HF (decompensated HF or treatment-resistant HF in the absence of another cause), sudden death (unexpected death, witnessed or not, of a previously stable patient with no evidence of worsening HF or any other cause of death), acute myocardial infarction (directly related in time with acute myocardial infarction due to mechanic, haemodynamic, or arrhythmic complications), and stroke (associated with recently appearing acute neurologic deficit). The events were identified from the clinical records of patients with HF, hospital wards, the emergency room, general practitioners, and by contacting the patient’s relatives. Mortality data were verified by the databases of the Catalan and Spanish Health Systems and the Spanish National Death Registry (INDEF). Hospitalizations were identified from the clinical records of patients with HF, hospital wards, and the shared electronic health record in Catalonia. Follow-up was closed at 31 December 2021.
Statistical analysis
Statistical analysis was performed using STATA V.13.0 (College Station, TX, USA) and IBM SPSS Statistics (version 22, 2013) software. Normal distribution of continuous variables was assessed by plotting histograms and applying the Shapiro–Wilk test. Variables with normal distribution are presented as mean ± standard deviation, while those with non-normal distribution are presented as median and interquartile range. Continuous variables were compared between groups using the unpaired Student’s t-test, the Mann–Whitney U test, or the one-way ANOVA test, as appropriate. Continuous variables with non-normal distribution were compared between groups with one-way ANOVA test. Categorical variables were compared by the χ2 test with Yates correction or the Fisher exact test. Simple linear regression between LVEDDi and LVEDVi was assessed. The association between the definitions of LV dilation and the combined clinical endpoint were assessed with Cox proportional regression models. A competing risk strategy using the Fine and Gray method was adopted, considering non-cardiovascular death as competing event for the clinical endpoint. Statistically significant variables in the univariate regression analysis were included in the multivariate regression analysis applying the ‘one-in-ten’ rule to avoid model overfitting of the model.18 Cumulative incidence curves were plotted. The crude incidence of HF hospitalizations was calculated. P-values of <0.05 were considered statistically significant.
Results
Patient population
A total of 564 patients were included (median age 64 years; 79% men). Patient clinical characteristics and CMR data are reported in Tables 1 and 2, respectively. Ischaemic HF was present in 42% of the patients whereas the remaining patients had non-ischaemic HF, being dilated cardiomyopathy the most frequent aetiology (30%).
Patient characteristics
| All (n = 564) | Group 1 | Group 2 | Group 3 | Group 4 | P-value | |
|---|---|---|---|---|---|---|
| LVEDDi normal | LVEDDi increased | LVEDDi normal | LVEDDi increased | |||
| LVEDVi normal (n = 66) | LVEDVi normal (n = 27) | LVEDVi increased (n = 85) | LVEDVi increased (n = 386) | |||
| Clinical characteristics | ||||||
| Age (years) | 64 ± 11.7 | 63 ± 11.1 | 66 ± 11.13 | 63 ± 12.79 | 64 ± 11.6 | 0.75 |
| Male, n (%) | 446 (79) | 55 (83) | 17 (63) | 71 (84) | 303 (79) | 0.11 |
| BSA (kg/m²) | 1.85 ± 0.2 | 1.92 ± 0.2 | 1.72 ± 0.2 | 2.01 ± 0.2 | 1.81 ± 0.2 | <0.001 |
| Hypertension, n (%) | 346 (61) | 43 (65) | 18 (67) | 61 (72) | 224 (58) | 0.09 |
| DM, n (%) | 234 (42) | 27 (41) | 13 (48) | 37 (44) | 157 (41) | 0.86 |
| Smoker, n (%) | 382 (68) | 46 (70) | 15 (56) | 58 (68) | 263 (68) | 0.58 |
| Dyslipidaemia, n (%) | 349 (62) | 42 (64) | 12 (44) | 56 (66) | 239 (62) | 0.25 |
| Obesity, n (%) | 134 (24) | 26 (39) | 3 (11) | 41 (48) | 64 (17) | <0.001 |
| NYHA class II/III, n (%) | 432 (81)/42 (8) | 52 (84)/4 (7) | 25 (93)/2 (7) | 66 (81)/3 (4) | 289 (80)/33 (9) | 0.24 |
| LBBB, n (%) | 212 (38) | 12 (18) | 7 (26) | 30 (35) | 163 (42) | <0.001 |
| AF/flutter, n (%) | 75 (13) | 13 (20) | 5 (19) | 10 (12) | 47 (12) | 0.31 |
| Aetiology of HF, n (%) | 0.05 | |||||
| Ischaemic | 237 (42) | 29 (44) | 15 (56) | 31 (36) | 162 (42) | |
| Non-ischaemic | 327 (58) | 37 (56) | 12 (44) | 54 (64) | 224 (58) | |
| Laboratory | ||||||
| Haemoglobina (g/dL) | 14.2 ± 12 | 17 ± 25 | 13 ± 1.3 | 14 ± 1.5 | 14 ± 10 | 0.39 |
| NT-proBNPa (pg/mL) | 1193 (541–2825) | 1245 (589–3013) | 1159 (729–1997) | 476 (176–1050) | 1440 (672–3367) | <0.001 |
| eGFRa (mL/min/1.73 m²) | 68.4 ± 24 | 67 ± 24 | 65 ± 23 | 72 ± 25 | 68 ± 24 | 0.61 |
| Treatment | ||||||
| Betablocker, n (%) | 494 (88) | 58 (88) | 25 (93) | 74 (87) | 337 (87) | 0.88 |
| ACEinh/ARBs, n (%) | 399 (71) | 41 (62) | 18 (67) | 64 (75) | 276 (72) | 0.32 |
| ARNi, n (%) | 73 (13) | 10 (15) | 5 (19) | 12 (14) | 46 (12) | 0.68 |
| MRA, n (%) | 420 (75) | 44 (67) | 16 (59) | 62 (73) | 298 (77) | 0.07 |
| Loop diuretics, n (%) | 419 (74) | 49 (74) | 17 (63) | 55 (65) | 298 (77) | 0.05 |
All values are n (%), mean ± SD, except for NT-proBNP values that are presented as median (interquartile range).
ACE inhibitor, angiotensin-converting enzyme inhibitor; AF, atrial fibrillation; ARBs, angiotensin receptor blockers; ARNi, angiotensin receptor neprilysin inhibitor; BSA, body surface area; DM, diabetes mellitus; eGFR, estimated glomerular filtration rate; HF, heart failure; IQR, interquartile range; LBBB, left bundle branch block; LVEDDi, left ventricular end-diastolic diameter index; LVEDVi, left ventricular end-diastolic volume index; MRA, mineralocorticoid receptor antagonist; NT-proBNP, N-terminal pro B type natriuretic peptide; NYHA, New York Heart Association.
aeGFR levels available only in 446 patients, haemoglobin levels in 396, and NT-proBNP levels available in 364 patients.
Cardiac magnetic resonance characteristics
| All (n = 564) | Group 1 | Group 2 | Group 3 | Group 4 | P-value | |
|---|---|---|---|---|---|---|
| LVEDDi normal LVEDVi normal (n = 66) | LVEDDi increased | LVEDDi normal | LVEDDi increased | |||
| LVEDVi normal (n = 27) | LVEDVi increased (n = 85) | LVEDVi increased (n = 386) | ||||
| LVEDDi (mm/m²) | 35 ± 5 | 27 ± 2.3 | 34 ± 2.2 | 29 ± 1.3 | 37 ± 4.4 | <0.001 |
| LVEDVi (mL/m²) | 130 ± 42 | 81 ± 11 | 86 ± 6.7 | 115 ± 21 | 145 ± 41 | <0.001 |
| LVESVi (mL/m²) | 95 ± 41 | 50 ± 9.5 | 53 ± 7 | 79 ± 22 | 108 ± 40 | <0.001 |
| LVEF (%) | 29 ± 10 | 39 ± 7 | 38 ± 7 | 31 ± 9 | 27 ± 9 | <0.001 |
| LVMi (g/m²) | 90 ± 26 | 77 ± 19 | 70 ± 18 | 89 ± 30 | 93 ± 26 | <0.001 |
| T1 mapping (ms)a | 1069 ± 61 | 1062 ± 90 | 1072 ± 54 | 1059 ± 63 | 1073 ± 53 | 0.40 |
| LGE, n (%) | 461 (82) | 53 (80) | 25 (93) | 59 (69) | 324 (84) | 0.007 |
| LV to RV ratio | 2,03 ± 0.75 | 1.5 ± 0.36 | 1.7 ± 0.39 | 1.8 ± 0.54 | 2.2 ± 0.79 | <0.001 |
LGE, late gadolinium enhancement; LV, left ventricle; LVEDDi, left ventricular end-diastolic diameter index; LVEDVi, left ventricular end-diastolic volume index; LVEF, left ventricular ejection fraction; LVESVi, left ventricular end-systolic volume index; LVMi, left ventricular mass index; RV, right ventricle.
aSeptal native T1 mapping values available in only 305 patients.
Concordance between linear and volumetric definitions of LV dilatation
On linear regression analysis, LVEDDi had a modest correlation with LVEDVi (r = 0.682, P < 0.001, Figure 1). LV dilatation based on volumetric definition was present in the majority of the patients (n = 471, 84%) whereas only 73% (n = 413) had LV dilatation based on a linear definition. Based on the concordance of the volumetric and the linear definition of LV dilatation, 66 patients (12%) had normal LVEDVi and LVEDDi (Group 1), 27 patients (5%) had dilated LVEDDi and normal LVEDVi (Group 2), 85 patients (15%) showed dilated LVEDVi and normal LVEDDi (Group 3), and 386 (68%) showed dilated LVEDVi and LVEDDi (Group 4).
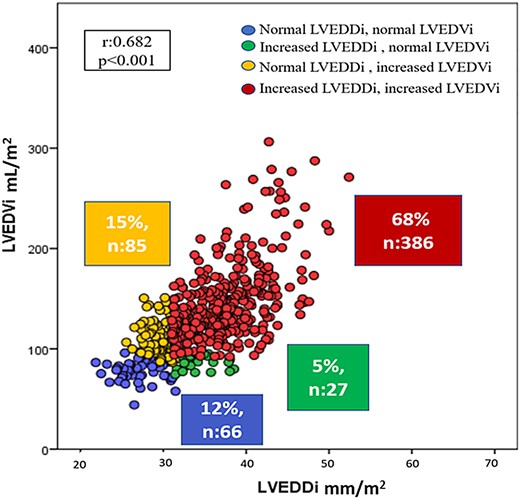
Correlation between left ventricular end-diastolic diameter index (LVEDDi) and left ventricular end-diastolic volume index (LVEDVi).
No clinical or HF treatment differences were observed across the groups. Group 4 had the highest NT-proBNP values. BSA was significantly higher and the presence of obesity was significantly more frequent in the Group 1 and Group 3. Left bundle branch block was present in 212 patients (38%) and it was more prevalent in Group 4. LVEF progressively decreased whereas LVESVi progressively increased from Group 1 to 4. LV mass index (LVMi) was higher in patients with increased LVEDVi (Group 3 and Group 4). LGE was present in the majority of the patients (82%) and it was more frequently observed in patients of the Group 2 and Group 4.
Linear and volumetric definition of LV dilation and outcomes
Over a median follow-up of 2.8 years (IQR 1.4–5.0), cardiovascular death or first HF hospitalization occurred in 105 patients (19%). Cardiovascular death occurred in 56 patients (10%) and HF hospitalization in 85 patients (15%), respectively. The cumulative rates of the combined endpoint with the following distribution according to the four subgroups were: 5 patients in Group 1 (7.6%), 2 patients in Group 2 (7.4%), 5 patients in Group 3 (5.9%), and 93 patients in Group 4 (24.1%). Both, LV dilatation according to LVEDDi and LVEDVi, were significantly correlated with cardiovascular death or HF hospitalization after adjusting for sex, age, ischaemic HF aetiology, HF categories based on LVEF < 40% and presence of diabetes mellitus, hypertension, and LGE (HR 3.29, 95% CI 1.72–26.29, P < 0.001 and HR 2.80, 95% CI 1.30–6.03, P = 0.009; respectively) (Table 3). However, when analysing the survival curves according to LV dilatation groups, only patients with concordant dilatation of LV (Group 4) had a worse outcome as compared with those with concordant non-dilatation of LV (HR 3.00, 95% CI 1.15–7.81, P = 0.024) (Figure 2).
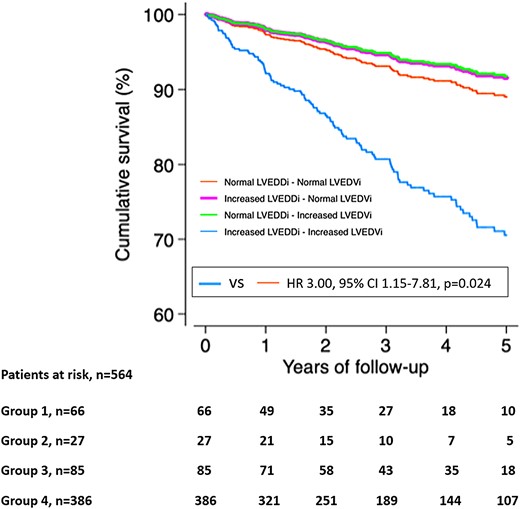
Cumulative survival analysis for the combined endpoint of cardiovascular death or HF hospitalization. LVEDDi, left ventricular end-diastolic diameter index; LVEDVi, left ventricular end-diastolic volume index; VS, versus; Group 1, normal LVEDDi-normal LVEDVi; Group 2, increased LVEDDi-normal LVEDVi; Group 3, normal LVEDDi-increased LVEDVi; Group 4, increased LVEDDi-increased LVEDVi.
Univariable and multivariable Cox regression analyses
| LV dilatation based on LVEDVi | LV dilatation based on LVEDDi | |||
|---|---|---|---|---|
| HR (95% CI) | P-value | HR (95% CI) | P-value | |
| Univariate | 2.43 (1.11–5.31) | 0.026 | 3.36 (1.75–6.46) | <0.001 |
| Multivariate adjustmenta | 2.80 (1.30–6.03) | 0.009 | 3.29 (1.72–6.29) | <0.001 |
| LV dilatation based on LVEDVi | LV dilatation based on LVEDDi | |||
|---|---|---|---|---|
| HR (95% CI) | P-value | HR (95% CI) | P-value | |
| Univariate | 2.43 (1.11–5.31) | 0.026 | 3.36 (1.75–6.46) | <0.001 |
| Multivariate adjustmenta | 2.80 (1.30–6.03) | 0.009 | 3.29 (1.72–6.29) | <0.001 |
Univariate regression analysis of LV dilatation defined by increased LVEDVi or increased LVEDDi, respectively.
aMultivariate Cox regression analysis adjusted for sex, age, ischaemic HF aetiology, HF categories based on LVEF cut-off value, diabetes mellitus, hypertension, and presence of late gadolinium enhancement in CMR studies. Other variables that are associated with cardiovascular events are sex, age, and ischaemic HF aetiology.
Discussion
The main results of the present study can be summarized as follows: LVEDDi had a modest correlation with LVEDVi when measured with CMR. The presence of discordant definition of LV dilatation based on the combination of both LVEDDi and LVEDVi was 20% of the patients with HF suggesting a significant proportion of patients that may be misclassified. Importantly, both LVEDDi and LVEDVi were independently associated with the primary outcome and those patients with concordant linear and volumetric definition for LV dilatation had worse outcomes. Changes in LV size, shape, and function are the hallmark of LV remodelling and occur in response to ischaemic or non-ischaemic injury and are partly mediated by neurohormonal and haemodynamic alterations.19 These changes involve changes in myocardial tissue, myocardial mass, and LV volumes and non-invasive imaging techniques can currently characterize the myocardial tissue changes (predominantly with the use of CMR techniques) and LV volumes and ejection fraction. There is a large body of evidence relating the changes in LV end-systolic volume (LVESV), LVEDV and LVEF with cardiovascular outcomes,5 particularly using radionuclide ventriculography or echocardiography. Subsequent studies using CMR have confirmed the results. In the general population for example, LVEDV measured with CMR was associated with increased risk of HF or cardiovascular death (HR 1.5, 95% CI 1.2–1.9) independently of the LV wall thickness and other parameters.20 In patients with acute myocardial infarction, increasing LVESV on baseline CMR (HR 1.02, 95% CI 1.01–1.03) and an increase in LVEDV > 15% at 6 months of follow-up was significantly associated with the occurrence of HF, ventricular arrhythmias, or cardiovascular death.21 Similarly, among patients with ischaemic HF, LVESV, and LVEDV measured with CMR have shown to be incremental to LVEF.22 Accordingly, LV volumes have become an important therapeutic target to demonstrate the efficacy of HF therapies to revert the adverse LV remodelling. Additionally, LV diameters are also important values to define LV remodelling and to decide timing of intervention (for example, in patients with severe aortic regurgitation).23,24 The echocardiographic data from the Valsartan heart Failure Trial showed that increasing LV end-diastolic diameter index was independently associated with poor outcomes.25 Furthermore, the reduction in LV end-systolic and end-diastolic diameters by various heart failure therapies (including cardiac devices such as cardiac resynchronization therapy) was directly correlated with a favourable effect on mortality as demonstrated by a recent meta-analysis including 69 766 patients.26 Therefore, based on this robust evidence, it could be established that both volumetric and linear dimensions of the LV would be excellent surrogates to assess the risk of adverse cardiovascular outcomes and the effects of heart failure therapies. However, there is no study so far demonstrating that this assumption is valid. In the present HF cohort, the correlation between linear and volumetric assessment of LV remodelling was moderate. Previous reports observed similar results in valvular heart disease, although those studies used transthoracic echocardiography.27 In the present study, 20% of the patients presented a discrepancy between the definition of LV dilatation according to linear vs. volumetric assessment. Interestingly, the clinical cause of HF did not differ between those with concordant or discordant definition of LV dilatation. It could be hypothesized that in ischaemic cardiomyopathy, the discrepancy between linear and volumetric LV dilatation definitions could be explained by the infarct location that would lead to specific LV local remodelling [for example, an inferior or inferolateral myocardial infarction would result in larger linear LV dimension (LVEDDi) but still normal LVEDVi]. However, this could be also explained by the timing of the CMR imaging: in the early process of the LV remodelling, the discrepancy between linear and volumetric LV dilatation could be more prominent whereas in a much later stage of the disease, the LV remodelling is more global having consistent definitions of linear and volumetric LV dilatation. The present study cohort consisted of patients with advanced HF and therefore, the percentage of discrepant definitions of LV dilatation was relatively low. We could also suggest that LV remodelling is a complex process, and there are different stages involved, and the differentiation of those stages may not follow the order of the groups created in the study.
In terms of outcomes, both linear and volumetric definitions for LV dilatation were independently associated with outcomes in the present cohort. However, the new insight of this study is highlighted by the combination of both definitions and its association with outcomes. Patients with HF and concordant definition of LV dilation exhibited the worse outcomes as compared with the other groups. In addition, the outcome of patients with LV dilation based on volumetric definition but with normal LV linear dimension did not differ from that of patients with normal LV volume. This is an interesting finding as the group with inconsistent definition of LV dilation (dilated based on linear dimension but not on volumetric definition) may reflect a much earlier stage of the heart failure process and therefore, they may be the patients that most benefit from heart failure therapies.
Study limitations
The present study is a single-centre, retrospective study that included patients who were imaged with CMR. Therefore, there may be a selection bias that has not been accounted for in the study. Prospective validation of the present results warrants further studies.
Conclusions
In patients with HF and LVEF < 50%, the prevalence of LV dilatation may change according to the definition used. While the majority of patients present both increased LVEDDi and LVEDVi, 20% show discordant values. Patients with LV dilatation based on LVEDDi and LVEDVi have the worse clinical outcomes as compared with patients without LV dilatation by either measurement.
Data availability
The data underlying this article could be shared on reasonable request to the corresponding author.
References
Author notes
Conflict of interest: V.D. received speaker fees from Edwards Lifesciences, GE Healthcare, Medtronic, Philips, and Novartis and consulting fees from Edwards Lifesciences, MSD and Novo Nordisk. A.B.-G. has participated in advisory and/or lectured for Abbott, AstraZeneca, Bayer, Boehringer Ingelheim, Novartis, Roche Diagnostics, and Vifor. The remaining authors have nothing to disclose.
