


Abstract
This study details application of deep learning for automatic volumetric segmentation of left ventricular (LV) myocardium and scar and automated quantification of myocardial ischaemic scar burden from late gadolinium enhancement cardiovascular magnetic resonance (LGE-CMR).
We included 501 images and manual segmentations of short-axis LGE-CMR from over 20 multinational sites, from which 377 studies were used for training and 124 studies from unique participants for internal validation. A third test set of 52 images was used for external evaluation. Three models, U-Net, Cascaded U-Net, and U-Net++, were trained with a novel adaptive weighted categorical cross-entropy loss function. Model performance was evaluated using concordance correlation coefficients (CCCs) for LV mass and per cent myocardial scar burden. Cascaded U-Net was found to be the best model for the quantification of LV mass and scar percentage. The model exhibited a mean difference of −5 ± 23 g for LV mass, −0.4 ± 11.2 g for scar mass, and −0.8 ± 7% for per cent scar. CCC were 0.87, 0.77, and 0.78 for LV mass, scar mass, and per cent scar burden, respectively, in the internal validation set and 0.75, 0.71, and 0.69, respectively, in the external test set. For segmental scar mass, CCC was 0.74 for apical scar, 0.91 for mid-ventricular scar, and 0.73 for basal scar, demonstrating moderate to strong agreement.
We successfully trained a convolutional neural network for volumetric segmentation and analysis of LV scar burden from LGE-CMR images in a large, multinational cohort of participants with ischaemic scar.

Introduction
Ventricular ischaemic scar burden from late gadolinium enhancement cardiovascular magnetic resonance (LGE-CMR) has important prognostic value, being an important risk factor for ventricular arrhythmia and sudden cardiac death,1 and strongly associating with mortality following primary percutaneous coronary intervention.2 Ventricular arrhythmia secondary to the scar is thought to be provoked by re-entrant circuits surrounding regions of scar. As such, quantification of scar burden provides important prognostic value for therapy (e.g. cardiac resynchronization).3 Another clinical indication for LGE is the assessment of quantification of the transmurality of ischaemic scar as a measurement of myocardial viability and areas of reversible myocardial dysfunction following an ischaemic event.4 Nonetheless, widespread clinical adoption of scar quantification is hindered by the considerable time associated with analysis (∼54 min5) and inter-observer variability, in part due to unreliable identification of scar in the vicinity of the blood pool.
Recently, convolutional neural networks have demonstrated remarkable success for a wide variety of CMR-related segmentation and prediction tasks.6–8 Most image-based semantic segmentation tasks utilize U-Net, named for its ‘u-shaped’ convolutional architecture.9 The imaging characteristics of ischaemic scar, namely that it has a brighter core, clearer edge, distribution explained by coronary territories, and standardized image interpretation and post-processing when compared with non-ischaemic scar, have made it a viable problem for deep neural networks to solve.10 Indeed, segmentation of left ventricular (LV) ischaemic scar has seen several advances, many of which involve alternative U-Net-based architectures.11 Despite their relative success and innovation, these methods have several limitations. First, several algorithms are dedicated only to the task of segmentation of scar and not myocardium, hence requiring myocardial contours for segmentation.11,12 Next, those who performed multi-class segmentation either had moderate accuracy,13 were trained from <100 studies, or were trained from a single site.11
Here, we sought to compile a large database of ischaemic LGE scar images from three different clinical studies from over 20 unique multinational sites for training a multi-class scar segmentation model. We trained three different fully convolutional neural networks, namely U-Net,9 Cascaded U-Net,14 and U-Net++,15 in which the skip connections within U-Net are converted into convolutional layers. To allow for efficient convergence, we developed two new training paradigms, denoted as adaptive weighted categorical cross-entropy and pseudo-deep supervision. We then tested the best model on a completely external test set of 52 studies.
Methods
Study populations
All studies received ethical and Institutional Review Board (IRB) approval and were provided by the CMR imaging core lab at Johns Hopkins University (PI: Joao Lima). Study 1 (IRB NA_00076271) was a clinical trial in patients with recent or chronic myocardial infarction 18 years of age or older from 20 sites across the USA. Study 2 (IRB 00217188) was a multi-centre prospective study in Japan that investigated patients with anterior ST elevation myocardial. Study 3 (IRB 00155165) was a clinical trial conducted in Europe, South America, and North America in patients with ST elevation myocardial infarction with primary outcome percentage of myocardial scar from LGE-CMR. The external test set (Study 4: IRB 00089436) was a clinical trial in patients with ischaemic heart failure. All participants from all studies provided informed consent for the study protocol. No studies were excluded based on image quality.
Overall study design
The overall study design is summarized in Figure 1. In total, 501 LGE-CMR studies were included. From this total data set, 75% (377 studies) were used for training and the remaining 124 studies were used for internal validation. A completely external test set of 52 studies was then used for external validation of our model.
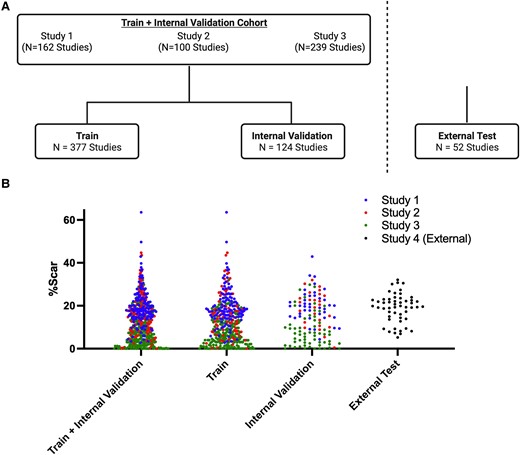
Study design flowchart and distribution of per cent scar in the train and test sets. (A) Schematic of the number of studies used for training from Study 1,16,17 Study 2,18 and Study 319 studies. A 75–25% train-internal validation split was utilized. A separate external test set of 52 studies was subsequently evaluated. (B) Distribution of per cent myocardial scar burden (%Scar) in the train and internal validation sets (left), train set (middle), internal validation set (right) from Study 1 (blue), Study 2 (red), and Study 3 (green) studies, and external test set (study 4). The distribution of per cent scar was similar between the train and internal validation sets as well as the external test set. Created with BioRender.com.
CMR imaging protocol and image analysis
For all studies, details on LGE-CMR imaging protocols and analysis have been described previously.16,18–20 Briefly, LGE images were acquired using a TurboFLASH sequence 15 min after intravenous injection of 0.2 mmol gadolinium contrast. Ten to 12 short-axis slices covering the entire left ventricle, one horizontal and one vertical long-axis images were acquired with a spatial resolution of 1.5–2 mm by 1.5–2 mm and a slice thickness of 10 mm and no slice gap. CMR was performed using 1.5 or 3.0 T scanners from GE, Siemens, Philips, and Toshiba. LGE images were acquired using a breath-hold inversion recovery-prepared gated TurboFLASH sequence 15 min after intravenous administration of 0.2 mmol/kg gadolinium contrast (either Magnevist or Dotarem). Areas of LGE were traced manually using a combination of a visual, qualitative approach and objective semi-automatic thresholding full width at half maximum (FWHM).21 Briefly, endocardial and epicardial contours were traced manually. Next, areas of LGE were initialized based on FWHM criteria, in which the user selects an area of enhancement, and a multi-pass region-growing algorithm is used to find areas of LGE. The region was the manually adjusted by one of two experienced readers (E.C. and Y.K) with over 10 years of experience in the MRI Core Laboratory at Johns Hopkins University as necessary. Image quality was graded qualitatively on a scale of 0–4: 4, no artefacts; 3, some artefacts, but not major; 2, lots of artefacts; 1, incomplete or non-diagnostic images. Only images that could be reliably segmented and with a quality score of at least 2.5 or greater were included. In the external validation set, only images with a quality score of 3 or 4 were used. Phase-sensitive inversion recovery images were excluded in our training and testing data.
Data pre-processing
Images in the training set were compressed to unsigned 8-bit images of size 256 × 256 × 16 pixels. Images were shrunk with nearest-neighbour interpolation or re-sized with zero padding (MATLAB, Mathworks 2022b). Images in the training set were normalized with 0 mean pixel intensity and division by 255. Images in the test set were normalized using the mean intensity from the training data. Segmentation maps for training were extracted from the QMass software, as described above, and resized with the same pre-processing protocols as their corresponding images.
Deep learning model and training
A total of three 3D convolutional neural networks were trained, U-Net,9 Cascaded U-Net,14 and U-Net++.15 Volumetric segmentation models, in which myocardial and scar voxels were identified as separate classes, were trained. Training data were augmented with random rotation (rotation range ±30°) and random flipping of the z-dimension (i.e. base-apex flipping). Multi-slice LGE-CMR was randomly assigned to non-overlapping train (75%) and test (25%) sets. All images from the same participant were assigned to the train set.
A novel loss function, denoted as adaptive weighted cross-entropy with Adam optimizer, was used for training. Details are found in Supplementary data online, Appendix S1.1 and S1.2. Additional network hyperparameters were as follows: learning rate, 1 × 10⁻³; batch size, 4; and epochs, 100, leaky ReLU slope −0.1. All convolutional layers included L2 regularization (λ = 0.1), batch normalization, and 10% dropout after max pooling. Training time was 2.4 h/epoch; segmentation time was 2 ms/study. Hyperparameters listed were the same for all models. Four convolution layers were used for all models; however, max pooling in the slice dimension was performed only after the first layer, as only 16 slices were included for each study. Models were built and trained in Python (ver. 3.9.7) with TensorFlow 2.0 (ver. 2.4.1) and a Keras backend (ver. 2.4.3). Model training was performed on a server workstation with 12 CPU cores, 32 GB RAM, and two NVIDIA graphics processing units (GPUs) each with 16 GB of video memory [NVIDIA (Santa Clara, CA, USA) Tesla P100].
Model evaluation and quantification of segmental scar
Automated segmentation maps in the test set were evaluated relative to the manual group truth segmentations with the Dice coefficient. LV and scar mass was determined by summation of all myocardial and scar voxels. Segmental scar was determined by subdividing the ventricular myocardium into six segments of 60° starting from the right ventricular insertion point, which was manually identified, and slices allocated to the base, mid-ventricle, and apex accordingly. The best model, defined as the model with the higher concordance and Dice coefficient, was then evaluated on an external test set, only once. Original segmentations for the external data set were not available.
Statistical analysis
Continuous variables are expressed as mean ± SD, unless otherwise specified. Categorical variables are expressed in percentages. The 95% confidence intervals (CIs) for Dice coefficients were generated assuming a normal distribution. Relationships between Dice coefficients and clinically relevant covariates, including age, sex, body mass index (BMI), image quality, and field strength, were assessed with regression analysis. Agreement for clinical parameters was assessed with Bland–Altman analysis and concordance correlation coefficient (CCC). Statistical analyses were performed using Stata, version 15.0 (Stat Corp LP, College Station, TX, USA).
Results
Participant and imaging characteristics
Demographic and relevant clinical parameters for participants in the train and test set are in Table 1, with separation by sub-study in Supplementary data online, Table S1. Amongst all cohorts, the mean age was 59 ± 12 years and 16% female. The mean BMI was 27 ± 12 kg/m2. Age, sex, race, and BMI were matched in the train and internal validation set by design. There were no differences in scanner manufacturer, field strength, and image quality between train and test sets. No differences in relevant clinical parameters, including LV mass, overall per cent scar, and segmental scar mass, were observed.
Relevant participant demographics and clinical characteristics
| Total | Train | Internal validation | P-value (train vs. internal val) | External test | |
|---|---|---|---|---|---|
| Baseline demographics/characteristics | |||||
| Number of studies, n | 501 | 377 (75%) | 124 (25%) | — | 52 |
| Age, y | 59 ± 12 | 59 ± 11 | 59 ± 14 | 0.47 | 60 ± 10 |
| Female, % | 70 (16%) | 51 (14%) | 19 (15%) | 0.65 | 1 (2%) |
| Height, cm | 172 ± 10 | 172 ± 9 | 172 ± 10 | 0.86 | 177 ± 7 |
| Weight, kg | 80 ± 18 | 80 ± 18 | 81 ± 18 | 0.50 | 99 ± 23 |
| BSA, m2 | 2.0 ± 0.3 | 1.9 ± 0.3 | 2.0 ± 0.3 | 0.61 | 2.2 ± 0.3 |
| BMI, kg/m2 | 27 ± 5 | 27 ± 5 | 27 ± 5 | 0.39 | 31 ± 8 |
| Imaging characteristics | |||||
| Scanner manufacturer | |||||
| Siemens, n (%) | 172 (35%) | 132 (35%) | 40 (32%) | 0.82 | 17 (33%) |
| GE, n (%) | 33 (7%) | 23 (6%) | 10 (8%) | 22 (42%) | |
| Philips, n (%) | 281 (57%) | 211 (56%) | 70 (56%) | 13 (25%) | |
| Toshiba, n (%) | 9 (2%) | 7 (2%) | 2 (2%) | 0 (0%) | |
| Field strength | 0.38 | ||||
| 1.5 T, n (%) | 448 (89%) | 340 (90%) | 108 (87%) | 52 (100%) | |
| 3.0 T, n (%) | 47 (9%) | 33 (9%) | 14 (11%) | 0 (0%) | |
| Quality score (0–4) | 4 (3–4) | 4 (3–4) | 4 (3–4) | 0.68 | 4 (4–4) |
| Left ventricular myocardium and scar | |||||
| LV EDV, mL | 177 ± 49 | 175 ± 46 | 183 ± 55 | 0.53 | 272 ± 74 |
| LV mass, g | 134 ± 57 | 134 ± 59 | 134 ± 50 | 0.82 | 158 ± 37 |
| Scar mass, g | 20 ± 20 | 20 ± 22 | 20 ± 16 | 0.16 | 30 ± 11 |
| Segmental scar, g | — | ||||
| Apical scar | 6 ± 10 | 6 ± 11 | 5 ± 8 | 0.59 | |
| Mid-ventricular scar | 6 ± 10 | 6 ± 11 | 6 ± 8 | 0.68 | |
| Basal scar | 2 ± 5 | 2 ± 5 | 2 ± 5 | 0.57 | |
| % Scar | 14 ± 1 | 13 ± 1 | 14 ± 1 | 0.10 | 19 ± 6 |
BSA, body surface area.
Evaluation of adaptive weighted categorical cross-entropy
A novel loss function denoted as adaptive weighted categorical cross-entropy (see Supplementary data online, Appendix S1.1) was used for training and model convergence. A visual schematic of this loss function is shown in Figure 2A and convergence in Figure 2B. To understand the properties of this loss function, we saved the weights in increments of 15 epochs (Figure 2C). Qualitatively, we observed that during training, the model initially identified and refined the contour of the myocardium and then refined scar segmentation with weight decay.
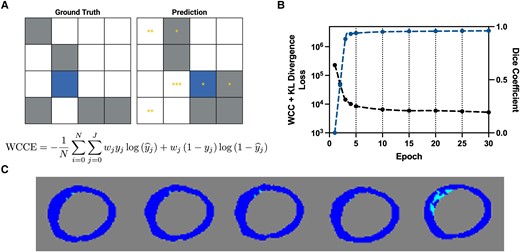
Schematic of adaptive weighted cross-entropy. (A) Representative schematic and equation of adaptive weighted cross-entropy. On the left is the ground truth and on the right is a schematic of the prediction. Grey pixels correspond to the majority non-background class and blue to the minority class. Yellow asterisks correspond to the weight. A non-background pixel that is predicted to be background is weighed based on the relative number of non-background pixels in the ground truth. (B) Loss (black) and Dice coefficient (blue) for the first 30 epochs. Vertical dashed lines correspond to weight updates, which occur every 5 epochs. (C) Segmentations from the weights every 15 epochs. The last image segmentation map corresponds to that from the weights at the end of training. Dark blue corresponds to myocardium and light blue to scar. KL, Kullback-Leibler divergence; WCC, weighted categorical cross-entropy.
Model evaluation
Three models were trained, namely U-Net, Cascaded U-Net, and U-Net++. We first compared with the state of the art of nnU-Net,22 which does not use either pseudo-deep supervision or adaptive weighted cross-entropy. We found that this model did not converge without the use of adaptive weighted cross-entropy. As such, for all subsequent comparisons, we use nnU-Net trained with adaptive weighted cross-entropy, denoted as U-Net. Overall (myocardium and scar), Dice coefficients (95% CIs) are 0.68 (0.50, 0.83), 0.66 (0.46, 0.80), and 0.61 (0.49, 0.70) for U-Net, Cascaded U-Net, and U-Net++, respectively. All models segmented the myocardium and LV blood pool successfully, with Dice coefficients for the myocardium observed to be 0.78 (0.60, 0.85), 0.75 (0.55, 0.83), and 0.70 (0.56, 0.82) and those for the blood pool observed to be 0.79 (0.73, 0.86), 0.78 (0.73, 0.86), and 0.85 (0.78, 0.92) for U-Net, Cascaded U-Net, and U-Net++, respectively. In addition, we find no differences in performance as assessed by the dice score and bias in predicted scar percentage from our best model (Cascaded U-Net) with respect to age (dice: β = 0.00, P = 0.69; scar bias: β = 0.00, P = 0.38), sex (dice: β = 0.00, P = 0.78; scar bias: β = −0.02, P = 0.11), BMI (dice: β = 0.00, P = 0.36; scar bias: β = 0.00, P = 0.31), field strength (β = 0.00, P = 0.69; scar bias: β = 0.01, P = 0.83), and image quality (β = 0.00, P = 0.89; β = 0.02, P = 0.28).
We next evaluated agreement for clinically relevant parameters, namely LV mass, scar mass, per cent scar, and segmental scar, shown in Table 2. All models had moderate to strong agreement for LV mass [CCC: 0.84 (U-Net), 0.87 (Cascaded U-Net), 0.68 (U-Net++)] and per cent scar mass [CCC: 0.71 (U-Net), 0.78 (Cascaded U-Net), 0.64 (U-Net++)] with the same measurements from manual segmentations. For segmental scar mass, Cascaded U-showed moderate to strong agreement at the base (CCC > 0.55) and minimal bias compared with apical and mid-ventricular scar (apical CCC > 0.55 and mid-CCC > 0.65), while Cascaded U-Net showed moderate agreement for basal scar mass (Cascaded CCC: 0.73, U-Net CCC: 0.20, U-Net++ CCC: 0.27) From these results, we find that despite its lower Dice coefficient, Cascaded U-Net was the superior model for the quantification of LV mass and per cent scar. Furthermore, we find moderate agreement between scar mass from each segment from the American Heart Association 16-segment scar model for all deep learning models (Cascaded CCC: 0.74, U-Net CCC: 0.77, U-Net++ CCC: 0.59). A representative figure of volumetric scar segmentation from Cascaded U-Net is shown in Figure 3, and examples of segmentation are failures shown in Figure 4. Regression relationships for clinically relevant parameters are shown in Figure 5.
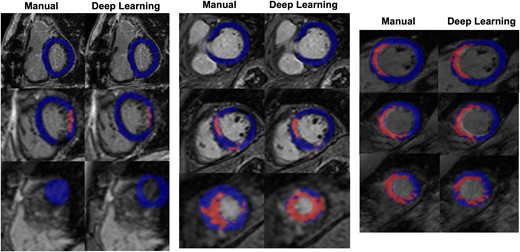
Representative deep learning segmentation. Deep learning and manual segmentations for three selected studies in the test set. Myocardial voxels are shaded in blue, while scar voxels are shaded in red. Left: 68-year-old Caucasian female, BMI 26 kg/m2, LV End Diastolic Volume (EDV) 140 mL, 8% scar, field strength 3 T. Middle: 49-year-old Asian male, BMI 30 kg/m2, LV EDV 172 mL, 16% scar, field strength 1.5 T. Right: 36-year-old Caucasian male, BMI 21 kg/m2, LV EDV 220 mL, 23% scar, field strength 1.5 T.
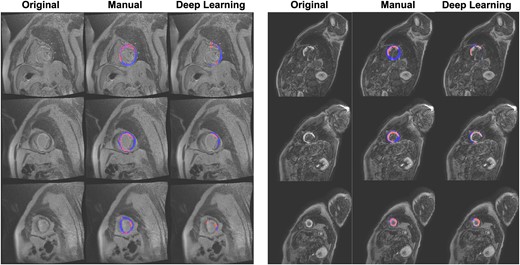
Representative deep learning segmentation failures. Myocardial voxels are shaded in blue, while scar voxels are shaded in red.
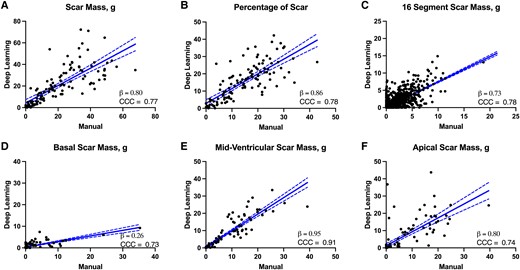
Linear regression of overall scar burden and segmental scar from the Cascaded U-Net. (A) Scar mass (g), (B) overall per cent scar, (C) scar mass in each segment of the 16-segment scar model, (D) basal, (E) mid-ventricular, and (F) apical scar. For all plots, linear regression lines with 95% confidence bands are shown. Beta coefficient (slope of the regression line) and CCC are shown for each measurement.
Evaluation of left ventricular mass and per cent myocardial scar burden
| DL mean (±SD) | Mean difference (±SD) | CCC | |
|---|---|---|---|
| Model 1: U-Net | |||
| LV mass, g | 123 ± 39 | −11 ± 24 | 0.84 |
| Scar mass, g | 16 ± 14 | −3.7 ± 10.5 | 0.72 |
| Segmental scar, g | |||
| Apical scar | 0.9 ± 1.2 | −5.7 ± 7.7 | 0.71 |
| Mid-ventricular scar | 5.6 ± 7.4 | −1.7 ± 6.0 | 0.69 |
| Basal scar | 3.5 ± 5.1 | 1.9 ± 5.6 | 0.29 |
| 16 segment scar, g | 0.5 ± 1.3 | −0.2 ± 1.1 | 0.74 |
| % Scar | 13 ± 10 | −1.3 ± 7.4 | 0.71 |
| Model 2: Cascaded U-Net | |||
| LV mass, g | 128 ± 43 | −5 ± 23 | 0.87 |
| Scar mass, g | 20 ± 17 | −0.4 ± 11.2 | 0.77 |
| Segmental scar, g | |||
| Apical scar | 5.5 ± 8.8 | 0.2 ± 6 | 0.74 |
| Mid-ventricular scar | 6.1 ± 8.5 | 0.2 ± 3.5 | 0.91 |
| Basal scar | 0.9 ± 1.6 | −0.9 ± 3.6 | 0.73 |
| 16 segment scar, g | 0.7 ± 1.6 | −0.1 ± 1.1 | 0.77 |
| % Scar | 15 ± 10 | −0.8 ± 7 | 0.78 |
| Model 3—U-Net++ | |||
| LV mass, g | 86 ± 39 | −32 ± 41 | 0.68 |
| Scar mass, g | 10 ± 10 | −10 ± 16 | 0.64 |
| Segmental scar, g | |||
| Apical scar | 2 ± 3 | −5 ± 7 | 0.59 |
| Mid-ventricular scar | 3 ± 4 | −5 ± 6 | 0.71 |
| Basal scar | 0.1 ± 0.5 | −1 ± 4 | 0.27 |
| 16 segment scar, g | 0.2 ± 0.7 | −0.5 ± 1.4 | 0.59 |
| % Scar | 9 ± 8 | −4 ± 6 | 0.68 |
Values are mean ± SD. LV mass, scar mass, and per cent scar were quantified from manual and deep learning derived segmentations from all three models. CCC was calculated relative to manual.
DL, deep learning; LV, left ventricular.
We next evaluated our best model, Cascaded U-Net, on a completely external test set of 52 studies from patients with ischaemic heart failure, for which we only had LV mass, scar mass, and overall scar percentage. Our model had moderate to strong agreement for LV mass (CCC: 0.75, 95% CI: 0.56–0.80), scar mass (CCC: 0.71, 95% CI: 0.59–0.83), and per cent scar (CCC: 0.71, 95% CI: 0.59–0.83). Bland Altman analysis on this external test set is shown in Figure 6. Briefly, we see negative bias for segmentation of LV mass (average: −4 ± 38 g) and particularly high variance at larger LV volumes. We see minimal bias in both scar mass (average: 4 ± 9 g) and per cent scar (average: −3 ± 6%).
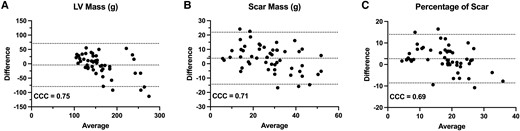
Bland–Altman analysis of Cascaded U-Net performance in an external test set of ischaemic heart failure patients. (A) LV mass, (B) scar mass, and (C) per cent scar. For all plots, mean bias with 95% CIs as CCCs are shown.
Discussion
This study evaluates the application of U-Net and U-Net-derived convolutional neural networks for automatic, volumetric, and multi-class segmentation of myocardium and ischaemic scar. Our study is notable for several reasons. First, it is the largest compiled data set of LGE-CMR images with manual myocardial and scar segmentations for training, and testing is performed on a true external test set. Second, it demonstrates an approximately 8% improvement in Dice coefficient compared with all prior trained models and minimal bias in clinically relevant parameters, namely per cent scar. Lastly, it introduces two novel training paradigms for convolutional neural networks, adaptive weighted cross-entropy, and pseudo-deep supervision, both of which allow for complex convolutional neural networks for large volumetric image data sets with significant class imbalance.
Novel deep learning training techniques
We employ two novel training methodologies for training convolutional neural networks and neural networks in general, namely a new loss function, adaptive weighted cross-entropy, and modification to deep supervision,15 known as pseudo-deep supervision. Class imbalance is a phenomenon commonly encountered in medical imaging problems where the number of pixels or voxels of interest is much smaller than the region of interest. Prior studies have employed weighted categorical cross-entropy, most notably for brain tumour segmentation.14,23 Here, we employ adaptive weighted cross-entropy, in which the adaptive aspect is novel. Models trained with weighted cross-entropy over-estimate the region of interest, as voxels on the edge of the segmentation maps are more likely to be identified as non-background. This can impact performance in cases like myocardial scar segmentation, where the voxel of interest is small and confined to a small region of interest, in this case, the myocardium. Weight decay allows for the refinement of segmentations during training for the classification of edge voxels. Indeed, we see qualitatively that weight decay allows for prevents overestimation of scar burden, which is to be expected from non-adaptive weighted cross-entropy. Importantly, nnU-Net, the gold standard CNN for medical image segmentation, failed to converge without the use of adaptive weighted cross-entropy, highlighting yet another strength of this approach.22 The second major innovation is pseudo-deep supervision, an improvement on the deep supervision, a method of deep learning in which segmentations of each class are provided independently, and sub-networks are forced to identify one class of interest.15 Pseudo-deep supervision instead takes advantage of the log-likelihood nature of the cross-entropy loss function by adding predictions from each sub-network for the calculation of loss. The result is a similar segmentation without significantly increasing memory burden or training time. Moreover, in the case of deep supervision, the number of sub-networks is restricted to the number of classes; however, this is mitigated with the use of pseudo-deep supervision. Future studies employing these techniques may allow for more efficient convergence of large neural networks for medical imaging tasks with imbalanced classes.
Comparison to existing scar segmentation models
While most models have demonstrated moderate to strong agreement with manual segmentations for identification LV myocardium from LGE images,6,24–27 scar segmentation has remained a challenge. Studies by Fahmy et al.13,28 and Prakosa et al.29 both showed a Dice coefficient of about 0.57 for scar segmentation, 9% lower than what we observed for Cascaded U-Net and 12% lower compared with U-Net. Further, these studies used either virtually generated scar or complementary cine images for training and not just LGE-CMR images as used here. LGE segmentation typically requires successful differentiation between the endocardial border and the blood pool, with experts often requiring other sequences for adequate segmentation. Notably, our model was able to solve this problem without the need for other sequences, as required by other convolutional neural networks and experts.13,28,29 Using a similar approach of Cascaded U-Nets, Zabihollahy et al.11,30,31 showed a dice score of 0.85 on a small test set of 16 studies, but a bias of 7 mL for scar volume and Pearson R = 0.50 for per cent scar, whereas our model shows a bias of −1.0 g (−0.95 mL) and CCC of 0.78 in our internal validation set and a bias of 3.8 g (3.7 mL) and CCC of 0.71 in our external test set. Other studies using either Cascaded U-Nets or Cascaded auto-encoders32 reported equally impressive Dice coefficients, but were also trained only 2D slices, and did not include apical scar in most cases.33,34 In another study trained on dark-blood LGE, Papetti et al. reported a Dice coefficient of >0.85 and reported intra-class correlation coefficients between 0.4 and 0.8. However, this model was trained on 2D slices and did not include volumetric segmentation and utilized a different set of images from the current study.
Compared with several of these prior studies, our study is notable for showing moderate to strong agreement with a CCC for clinically relevant parameters as opposed to just Dice coefficient, with the caveat that only post-acute coronary syndrome patients with ischaemic scar were considered. In addition, our results suggest that the use of only Dice coefficient and related measures may not accurately reflect the capabilities of a model with respect to clinically relevant parameters derived from these images. Indeed, the Dice coefficient is particularly unstable for non-homogeneous regions of interest and at edges, particularly relevant for scar segmentation.35 Segmentation failures were restricted to cases in which the myocardium was unable to be identified by the deep learning model due to poor contrast between the myocardial wall and blood pool, which were few in number in our training set. In summary, our model demonstrates marked improvement over current scar segmentation models for the identification of per cent myocardial scar burden. Further improvements to the model with future efforts to include lower-quality images with poor visualization of the myocardial wall are underway.
Clinical implications of the proposed deep learning scar segmentation model
Quantification of myocardial scar burden from LGE-CMR images is complicated by the low resolution of images (compared with the size of the scar) and blurring from cardiac motion, leading to significant partial volume effects.36 While full-width half max is the gold standard for quantification and is the most reproducible compared with other methods,37 experts are still required for manual segmentation. Even amongst experts, similarity between segmentations is low, with studies observing Dice coefficients of ∼0.52.38 Our proposed model is the first to allow for robust, generalizable scar segmentation to combat these limitations associated with time-intensive analysis and inter-reader variability. As it is trained from over 20 multinational sites from a large volumetric LGE-CMR data set, our model shows minimal bias for the identification of clinically relevant scar parameters comparable with inter-observer variability for manual segmentation, even for apical scar, which is known to exhibit substantial inter-observer variability.36 This is further supported by moderate to strong CCC for evaluation of per cent scar in a completely external test set of patients with ischaemic heart failure. Furthermore, segmentation time is only 2 ms/study, a substantial improvement to manual segmentation time.
Limitations
Our study has several limitations, though many are addressed by the large data set used for training from several multinational sites. The majority of studies were derived from older, male, and Caucasian individuals, which, while reflecting the epidemiology of ischaemic scar and fibrosis, may limit applications to other situations. Nonetheless, 100 studies were from a predominantly male, Japanese cohort, which is a strength. Furthermore, our study only included LGE-CMR studies from patients with ischaemic disease. Only images with a quality score of 2.5 or greater were included in training and testing, and it is not known how the model would perform on lower-quality images. Whether the model applies to hypertrophic cardiomyopathy and other cases of non-ischaemic fibrosis is unknown and remains a topic of interest for future studies. Sub-pixel areas of myocardial scar and areas of microvascular obstruction, in which the contrast cannot reach, were not considered by our model, which is another limitation. Our model was only trained in a segmented sequence with TurboFLASH readout. As such, the clinical applicability of the model may be limited in cases where other LGE sequence variations (e.g. single-shot sequence with Steady-state free precession (SSFP) readout or a Motion-Corrected (MOCO) sequence with multiple motion-correct single-shot images and an SSFP readout) are used, though efforts to expand the training set with these sequences are ongoing. Furthermore, phase-sensitive inversion recovery LGE images were not included in our training due to a lack of available data, which may also impact the deployment of the algorithm in clinical practice. In addition, we did the prognostic value of deep learning derived due to lack of available clinical outcomes. Finally, in the external test set, our model did show significant underestimation of LV mass, particularly for patients with LV dilatation. This, however, is consistent with the composition of the training set and can be corrected by the integration of more heart failure patients in subsequent passes of training. The strengths, however, of the trained model include novel training paradigms and the large, robust training set used, augmenting the generalizability of our model.
Acknowledgements
We would like to thank the cardiovascular magnetic resonance imaging core lab at the Johns Hopkins University and the Lima Lab for providing all images utilized for training and testing in this study.
Supplementary data
Supplementary data are available at European Heart Journal - Cardiovascular Imaging online.
Funding
Images utilized in this study were acquired by Dr. Lima's core laboratory and include images from the ALLSTAR study (Capricor Inc), REAL-TIMI 63B (MedImmune), CCTRN CONCERT-HF Trial (NHLBI grants HL087318, HL113530, HL113460, HL087394, HL113457, HL087366, HL087365), and LAST-PASS (Boston Scientific).
Data availability
All model weights have been provided online on GitHub (https://github.com/JHU-AI-CV-Lab/scarsegDL), DOI (https://doi.org/10.5281/zenodo.10303932), which includes an iPython notebook detailing how to segment new cases as well as training a new model using the adaptive weighted cross-entropy function detailed here.
References
Author notes
Conflict of interest: No conflicts of interest to declare.
