


Abstract
Transcatheter aortic valve replacement (TAVR) revolutionized the therapy of severe aortic stenosis (AS) with rising numbers. Mixed aortic valve disease (MAVD) treated by TAVR is gaining more interest, as those patients represent a more complex cohort as compared with isolated AS. However, concerning long-term outcome for this cohort only, limited data are available. The aim of the study is to assess the prevalence of MAVD in TAVR patients, investigate its association with paravalvular regurgitation (PVR), and analyse its impact on long-term mortality after TAVR
We conducted a registry-based cohort study using the Vienna TAVR registry, enrolling patients who underwent TAVR at Medical University of Vienna between January 2007 and May 2020 with available transthoracic echocardiography before and after TAVR (n = 880). Data analysis included PVR incidence and long-term survival outcomes. A total of 647 (73.52%) out of 880 patients had ≥ mild aortic regurgitation next to severe AS. MAVD was associated with PVR compared with isolated AS with an odds ratio of 2.06, 95% confidence interval (CI): 1.51–2.81 (P = <0.001). More than mild PVR after TAVR (n = 168 out of 880: 19.09%) was related to higher mortality compared with the absence of PVR with a hazard ratio (HR) of 1.33, 95% CI: 1.05– 1.67 (P = 0.016). MAVD patients developing ≥ mild PVR after TAVR were also associated with higher mortality compared with the absence of PVR with an HR of 1.30 and 95% CI: 1.04–1.62 (P = 0.022).
MAVD is prevalent among TAVR patients and presents unique challenges, with increased PVR risk and worse outcomes compared with isolated AS. Long-term survival for MAVD patients, not limited to those developing PVR post-TAVR, is compromised. Earlier intervention before the occurrence of structural myocardial damage or surgical valve replacement might be a potential workaround to improve outcomes.
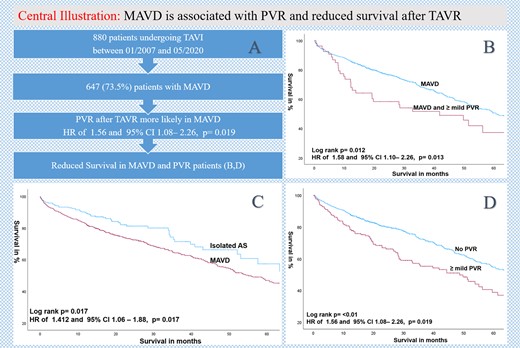
(A) Flowchart, (B) Kaplan–Meier estimates of survival comparing MAVD patients with the presence or absence of PVR after TAVR; (C) Kaplan–Meier estimates of survival comparing MAVD with isolated AS, and (D) Kaplan–Meier estimates of survival according to the presence or absence of ≥ mild PVR after TAVR.
Introduction
Transcatheter aortic valve replacement (TAVR) has revolutionized the therapy for patients with severe symptomatic aortic valve stenosis (AS) who have a high risk with surgical aortic valve replacement (SAVR).1 With significant advancements in TAVR safety and efficacy, its indications have expanded to include intermediate and selected low surgical risk patients. TAVR is increasingly being utilized in patients with mixed aortic valve disease (MAVD). MAVD, characterized by a combination of aortic valve stenosis and aortic valve regurgitation (AR) of varying severity, is the most common concomitant valve disorder worldwide.2,3 It accounts for 2–9% of all patients with valvular heart disease.3 Current guidelines recommend treatment based on the dominant lesion in patients with MVAD, since TAVR is not approved for isolated AR.4,5 However, TAVR in patients with MAVD has specific differences and risks compared with isolated AS.
First of all, MAVD is associated with increased odds of paravalvular regurgitation (PVR) and lower odds of device implantation success when compared with isolated severe aortic stenosis.6 PVR after TAVR has been associated with poor survival.7–9 Also for SAVR, a previous multicentre study showed that both mild and moderate-to-severe PVR were independent predictors of worse survival after operation.10
Moreover, MAVD treated with TAVR is associated with lower 30- and 90-day readmission rates and increased likelihood of pacemaker implantation.11 Furthermore, moderate-to-severe MR or TR, and severe MS, significantly increase the mid-term mortality after TAVR12 as they share the central pathophysiologic theme with MAVD—combined pressure and volume overload.
However, there is only limited data on long-term outcome of MAVD after TAVR with most of the studies having relatively short follow-up periods.
Concerning survival, conflicting results in the literature are available. One the one hand, previous studies with short time follow-up observed a better or comparable survival as compared with isolated AS. This was explained due to a better left ventricular (LV) adaptation to AR of patients with MAVD and better toleration of developed PVL post-TAVR.13–15 However, the follow-up time was rather short with up to 27 months. On the other hand, valuable studies analysing long-term outcome at 5 years observed that PVR was associated with an increased risk of mortality after TAVR.16
The aim of this study is to analyse the prevalence of MAVD in patients undergoing TAVR, evaluate its impact on the occurrence of PVR, and subsequently assess the long-term outcome of MAVD patients developing PVR after TAVR.
Methods
Study design and population
The Vienna TAVR registry is a prospective registry enrolling consecutive patients undergoing TAVR at the Medical University of Vienna, Vienna General Hospital. All patients undergoing TAVR at the medical university hospital of Vienna between January 2007 and May 2020 with available transthoracic echocardiography (TTE) before and after TAVR (n = 880) were included in this registry-based cohort study. Patients with missing or insufficient TTE images were excluded.
Echocardiographic parameters and definitions
Isolated AS was defined as severe AS and < mild AR. MAVD was defined as severe aortic stenosis with concomitant ≥ mild AR like in previous studies and meta-analysis.6 Isolated AS was defined as severe aortic stenosis with < mild AR.
For clinical evaluation of AS severity, mainly, the three primary haemodynamic parameters recommended by the American and European Society of Echocardiography were used, specifically peak jet velocity > 4 m/s, mean aortic transvalvular pressure gradient > 40 mmHg, and valve area by continuity equation < 1 cm2.17
Also for the diagnosis of aortic regurgitation by echocardiography, the American and European Society of Echocardiography recommendations were used. For detection of regurgitation components such as the regurgitant jet, specifically, flow convergence, vena contracta, and the regurgitant jet direction and area into the receiving chamber were used.18 When feasible, also proximal isovelocity surface area (PISA), effective regurgitant orifice area (EROA), measurement of diastolic flow reversal in the descending and abdominal aorta, and assessment of pressure half-time were performed.19In summary, integrative approach was performed in the AR severity measurement and graduated in mild (i), moderate (ii), or severe (iii).
Post-procedural PVR assessment was performed according to the American Society of Echocardiography Guidelines for Evaluation of Valvular Regurgitation After Percutaneous Valve Repair or Replacement by the use of colour Doppler jet features, continuous-wave and pulsed-wave Doppler, and quantitative Doppler assessment of PVR severity20 and was graduated in mild (i), moderate (ii), or severe (iii). In the present study, clinical relevant PVR was defined as ≥ mild PVR.
Data collection and outcome measures
Retrospective and prospective data collection with follow-ups was used with standardized case report forms (medical history, baseline clinical, procedural, and follow-up). In the present study, baseline clinical data were collected by using documentation from the pre-TAVR and follow-up TTE reports.
The Vienna TAVR registry consists of clinical follow-up at 30 days, 1 year, and 3 years after TAVR. Regarding survival data were updated annually by integrating information from the centralized death registry for the entire country. The primary outcome measure in the present analysis was all-cause mortality and incidence of PVR in MAVD. Secondary endpoints were survival in MAVD developing PVR.
Statistical analysis
Categorical variables are reported as frequencies and percentages. Continuous variables are presented as mean values ± standard deviation (SD). Kaplan–Meier analyses were employed to assess the time-dependent discriminative power of variables. Univariable and multivariable Cox proportional hazard models were used to calculate hazard ratios (HR), 95% confidence intervals (CI), and P-values. All P-values were two-sided, and a P value < 0.05 was considered significant for all tests. Statistical analyses were performed using SPSS 29.0 (IBM).
Results
Baseline characteristics
Between January 2007 and May 2020, n = 970 patients were treated with TAVR at our centre. Eight hundred eighty (90.72%) patients with sufficient TTE reports before and after TAVR were included to this registry-based cohort study. Six hundred forty-seven (73.52%) patients had ≥ mild AR next to severe AS, defined as MAVD. Sixteen patients (1.82%) had severe AR and severe AS (Table 1).
Baseline characteristics
| Total | Isolated AS | MAVD | P value | |
|---|---|---|---|---|
| (n = 880) | (n = 233, 26.48%) | (n = 647, 73.5%) | ||
| Age at TAVR | 81.68 ± 6.71 | 81.02 ± 6.82 | 82.02 ± 6.46 | P = 0.047 |
| BMI | 26.79 ± 5.012 | 27.92 ± 5.39 | 26.30 ± 4.58 | P = <0.001 |
| NYHA | 2.61 ± 0.82 | 2.68 ± 0.74 | 2.59 ± 0.85 | P = 0.177 |
| CCS | 0.61 ± 1.10 | 0.66 ± 1.12 | 0.62 ± 1.12 | P = 0.707 |
| Syncope | 0.16 ± 0.36 | 30 (12.88%) | 95 (14.68%) | P = 0.451 |
| Female | 465 (52.84%) | 104 (44.64%) | 361 (55.79%) | P = 0.003 |
| CAD | 521 (59.20%) | 156 (66.95%) | 365 (56.41%) | P = 0.005 |
| Previous PCI | 222 (25.22%) | 84 (36.05%) | 138 (21.33%) | P = <0.001 |
| Hypertension | 787 (89.43%) | 208 (89.27%) | 579 (89.49%) | P = 0.926 |
| AF | 364 (41.36%) | 105 (45.06%) | 259 (40.03%) | P = 0.187 |
| DM | 259 (29.43%) | 70 (30.04%) | 189 (29.21%) | P = 0.811 |
| PAD | 93 (10.56%) | 27 (11.59%) | 66 (10.20%) | P = 0.555 |
| CVD | 111 (12.61%) | 26 (11.16%) | 85 (13.14%) | P = 0.435 |
| PM before TAVR | 66 (7.5%) | 22 (9.44%) | 44 (6.80%) | P = 0.193 |
| Echocardiographic parameters | ||||
| LA before TAVR | 59.88 ± 8.68 | 58.55 ± 8.62 | 60.19 ± 8.64 | P = 0.464 |
| RA before TAVR | 56.87 ± 9.02 | 55.49 ± 9.67 | 57.22 ± 8.80 | P = 0.237 |
| LVEDD before TAVR | 45.00 ± 6.86 | 44.87 ± 7.07 | 45.00 ± 0.50 | P = 0.498 |
| RVEDD before TAVR | 32.97 ± 5.97 | 32.58 ± 6.07 | 32.00 ± 0.44 | P = 0.535 |
| IVS before TAVR | 15.27 ± 2.49 | 15.23 ± 2.68 | 15.29 ± 2.43 | P = 0.636 |
| MR before TAVR | 1.32 ± 0.72 | 1.08 ± 0.80 | 1.00 ± 0.06 | P = <0.001 |
| MR ≥ II° | 191 (21.70%) | 40 (17.17%) | 151 (23.34%) | P = 0.110 |
| TR before TAVR | 1.28 ± 0.85 | 0.97 ± 0.95 | 1.0 ± 0.07 | P = <0.001 |
| TR ≥ II° | 206 (23.41%) | 42 (18.02%) | 164 (25.35%) | P = 0.049 |
| sPAP before TAVR | 43.71 ± 20.66 | 38.74 ± 20.20 | 36.00 ± 1.40 | P = <0.001 |
| LVEF % | 53.51 ± 10.90 | 53.8 1 ± 10.50 | 53.51 ± 10.50 | P = 0.714 |
| AV PGmean mmHG | 48.92 ± 16.45 | 46.18 ± 16.41 | 49.97 ± 16.41 | P = 0.004 |
| AVmax mmHG | 4.39 ± 0.71 | 4.27 ± 0.72 | 4.44 ± 0.70 | P = 0.090 |
| AVAi cm2/m2 | 0.33 ± 0.10 | 0.35 ± 0.10 | 0.33 ± 0.10 | P = 0.266 |
| Cardiac output L/min | 5.45 ± 1.70 | 5.29 ± 1.71 | 5.55 ± 1.71 | P = 0.298 |
| sPAP mmHg | 43.71 ± 20.66 | 38.74 ± 20.20 | 45.43 ± 20.20 | P = <0.001 |
| Laboratory parameter | ||||
| Creatinine mg/dL | 1.22 ± 0.76 | 1.34 ± 1.05 | 1.20 ± 0.66 | P = 0.026 |
| NT-proBNP pg/mL median with inter-quartile ranges | 1728 (1526–1836) | 829.95 (620.10–1094) | 1174.50 (1030–1435) | P = 0.485 |
| Haemoglobin g/dL | 11.6 ± 1.79 | 11.78 ± 1.83 | 11.53 ± 1.80 | P = 0.71 |
| Albumin mg/dL | 37.97 ± 5.11 | 39.98 ± 4.50 | 37.62 ± 5.11 | P = <0.001 |
| CRP mg/dL | 1.29 ± 2.35 | 1.06 ± 2.06 | 1.31 ± 2.19 | P = 0.131 |
BMI, body mass index; NYHA, New York Heart Association; CCS, Canadian Cardiovascular Society Angina Grade; CAD, coronary artery disease; PCI, percutaneous coronary intervention; AF, atrial fibrillation; DM, diabetes mellitus; PM, pacemaker; PAD, periphery artery disease; CVD, cerebrovascular disease; LA, left atrium; RA, right atrium; LVEDD, left ventricular end-diastolic diameter; RVEDD, right ventricular end-diastolic diameter; IVS, interventricular septum; MR, mitral regurgitation; TR, tricuspid regurgitation; sPAP, systolic pulmonary pressure; LVEF, left ventricular ejection fraction; AV, aortic valve; NT-proBNP, n-terminal pro–B-type natriuretic peptide; CRP, C-reactive protein.
Mean age of the cohort was 81.68 ± 6.71 years and 465 patients (52.84%) were female. MAVD was significantly associated with age odds ratio (OR) of 1.023 and 95% CI: 1.00–1.046 (P = 0.047) and body mass index (BMI) with an OR of 0.936 and 95% CI: 0.908–0.965 (P = <0.001) compared with isolated AS. MAVD patients were more often female (n = 361, 55.79%; P = 0.003). Further, less CAD [n = 365 (70.01%); P = 0.005] and less previous PCI [n = 138 (62.16%); P = <0.001] was observed in the MAVD cohort (Table 1).
No differences could be proven between isolated AS and MAVD for syncope in isolated AS (n = 30, 12.88%) and in MAVD (n = 95, 14.68%) with P = 0.451, for hypertension in isolated AS (n = 208, 89.27%) and in MAVD (n = 579, 73.57%) with P = 0.93, for atrial fibrillation in isolated AS (n = 105, 45.06%) and in MAVD (n = 259, 71.15%) with P = 0.19, for diabetes mellitus in isolated AS (n = 70, 30.04%) and in MAVD (n = 189, 72.97%) with P = 0.81, for periphery artery disease in isolated AS (n = 27, 11.59%) and in MAVD (n = 66, 70.97%) with P = 0.555, as well as for cerebral vascular disease in isolated AS (n = 26, 11.16%) and in MAVD (n = 85, 76.58%) with P = 0.435 (Table 1).
Concerning occurrence of PVR, we observed that MAVD was significantly more often associated with ≥ mild PVR compared with isolated AS with an OR of 2.058 and 95% CI: 1.505–2.814 (P = <0.001). This was also proven after adjusting for gender and age with an HR of 1.991 and 95% CI: 1.452–2.731 (P = <0.001) (Table 2).
Procedural characteristics
| After TAVR | Total | Isolated AS | MAVD | P value |
|---|---|---|---|---|
| (n = 880) | (n = 233, 26.48%) | (n = 647, 73.5%) | ||
| NT-proBNP pg/mL median with inter-quartile ranges | 1071.50 (957–1218) | 1636 (1324–1958) | 1752.50 (1541–933) | P = 0.673 |
| AVmean mmHG | 11.94 ± 6.34 | 12.11 ± 7.14 | 11.71 ± 6.09 | P = 0.518 |
| LA after TAVR | 60.42 ± 8.79 | 59.50 ± 0.87 | 60.51 ± 9.32 | P = 0.854 |
| RA after TAVR | 58.21 ± 8.58 | 58 ± 0.95 | 57.86 ± 8.88 | P = 0.028 |
| LVEDD after TAVR | 44.66 ± 6.53 | 46 ± 0.74 | 44.29 ± 6.49 | P = 0.414 |
| RVEDD after TAVR | 33.61 ± 5.85 | 34 ± 0.79 | 33.53 ± 5.85 | P = 0.234 |
| IVS after TAVR | 14.42 ± 4.85 | 14 ± 0.23 | 14.56 ± 5.49 | P = 0.461 |
| MR after TAVR | ||||
| MR ≥ II° | 79 (8.98%) | 17 (7.29%) | 62 (9.58%) | P = 0.882 |
| TR after TAVR | ||||
| TR ≥ II° | 132 (15%) | 25 (10.73%) | 107 (16.54%) | P = 0.544 |
| Balloon-expandable valve | 546 (62.04%) | 109 (46.78%) | 399 (61.67%) | P = <0.001 |
| Edwars Sapien (1st gen) | 8 (0.91%) | 0 (0%) | 8 (1.24%) | P = 0.088 |
| Edwards Sapien XT | 111 (12.61%) | 9 (3.86%) | 102 (15.77%) | P = <0.001 |
| Edwards Sapien 3 | 362 (41.14%) | 91 (39.06%) | 271 (41.86%) | P = 0.452 |
| Medtronic Evolut Pro | 129 (14.66%) | 44 (18.88%) | 85 (13.14%) | P = 0.33 |
| Acurate Neo | 158 (17.95%) | 40 (17.17%) | 118 (18.24%) | P = 0.715 |
| Valve size (mm) | ||||
| 20 | 4 (0.45%) | 1 (0.43%) | 3 (0.46%) | P = 0.941 |
| 23 | 193 (21.93%) | 39 (16.74%) | 154 (23.80%) | P = 0.022 |
| 25 | 87 (9.89%) | 24 (10.30%) | 63 (9.74%) | P = 0.834 |
| 26 | 260 (29.55%) | 60 (25.75%) | 200 (30.91%) | P = 0.120 |
| 27 | 92 (10.45%) | 35 (15.02%) | 57 (8.81%) | P = 0.009 |
| 29 | 188 (21.36%) | 53 (22.75%) | 135 (20.87%) | P = 0.587 |
| 31 | 4 (0.45%) | 2 (0.86%) | 2 (0.31%) | P = 0.290 |
| 34 | 39 (4.43%) | 17 (7.29%) | 22 (3.40%) | P = 0.014 |
| Access route transfemoral | 880 (100%) | 233 (100%) | 647 (100%) | |
| Valve in valve procedure | 39 (22.56%) | 15 (6.44%) | 24 (3.71%) | P = 0.669 |
| Proglide vascular closure system | 613 (69.66%) | 248 (106.44%) | 365 (56.41%) | P = <0.001 |
| Manta vascular closure system | 88 (10.0%) | 38 (16.31%) | 50 (7.73%) | P = 0.182 |
| Sheath size 14 | 326 (37.05%) | 113 (48.50%) | 213 (32.92%) | P = 0.721 |
| Sheath size 16 | 233 (226.48%) | 57 (24.46%) | 176 (27.20%) | P = <0.001 |
| Acute kidney failure | 87 (9.89%) | 36 (15.45%) | 51 (7.88%) | P = 0.254 |
| Major vascular complication | 52 (5.91%) | 15 (6.44%) | 37 (5.72%) | P = 0.286 |
| Disabling stroke | 19 (2.16%) | 11 (4.72%) | 8 (1.24%) | P = 0.005 |
| PM after TAVR | 106 (12.05%) | 32 (13.73%) | 74 (11.44%) | P = 0.289 |
| Occurrence of PVR numerically | ||||
| 0° | 149 (16.93%) | 74 (31.76%) | 75 (1.55%) | P = <0.001 |
| I° (0.5–1) | 436 (49.55%) | 100 (42.92%) | 336 (51.93%) | P = 0.011 |
| II° (1.5–2) | 147 (16.70%) | 34 (14.59%) | 113 (17.47%) | P = 0.289 |
| III° (2.5–3) | 10 (1.14%) | 2 (0.86%) | 8 (1.24%) | P = 0.633 |
| Occurrence of PVR | ||||
| OR | 95% CI | P value | ||
| In MAVD | 2.058 | 1.505–2.814 | P = <0.001 | |
| In isolated AS | 0.486 | 0.355–0.664 | P = <0.001 | |
NT-proBNP, n-terminal pro–B-type natriuretic peptide; LA, left atrium; RA, right atrium; LVEDD, left ventricular end-diastolic diameter; RVEDD, right ventricular end-diastolic diameter; IVS, interventricular septum; MR, mitral regurgitation; TR, tricuspid regurgitation; PM, pacemaker; MAVD, mixed aortic valve disease; AS, aortic stenosis.
Survival
Median follow-up was 70.34 (63.74–76.95) months with a median survival after TAVR of 59.14 ± 3.06 months. We observed increased mortality in MAVD compared with isolated AS patients with an HR of 1.412 and 95% CI: 1.06–1.88 (P = 0.017). This was also proven after adjusting for gender and age with an HR of 1.475 and 95% CI: 1.11–1.96 (P = 0.008) (Figure 1).
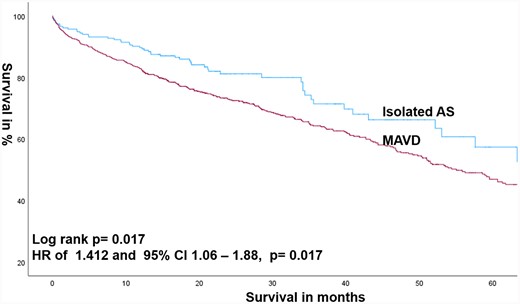
Kaplan–Meier estimates of survival comparing MAVD with isolated AS.
Also patients with severe AR and severe AS had reduced survival with an HR of 2.292 and 95% CI: 1.14–4.63 (P = 0.018). This was also proven after adjusting for gender and age with an HR of 2.28 and 95% CI: 1.12–4.61 (P = 0.022).
More than mild PVR after TAVR (n = 168 out of 891: 18.86%) was associated with higher mortality compared with the absence of PVR with an HR of 1.328 and 95% CI: 1.054–1.673 (P = 0.016). This was also proven after adjusting for age and gender with an HR of 1.314 and 95% CI: 1.042– 1.657 (P = 0.02) (Figure 2).
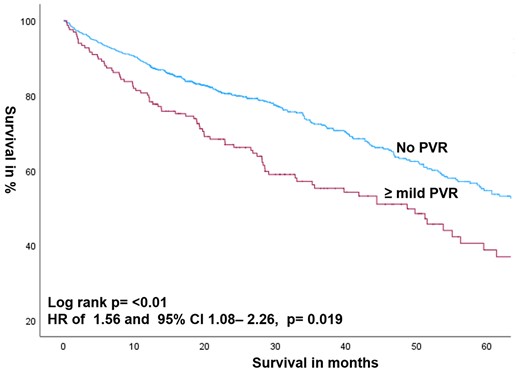
Kaplan–Meier estimates of survival according to the presence or absence of ≥ mild PVR after TAVR for all patients.
MAVD patients developing ≥ mild PVR after TAVR were also associated with higher mortality compared with the absence of PVR with an HR of 1.296 and 95% CI: 1.038–1.618 (P = 0.022). This was also proven after adjusting for age and gender with an HR of 1.294 and 95% CI: 1.035–1.616 (P = 0.023) (Table 3 and Figure 3).
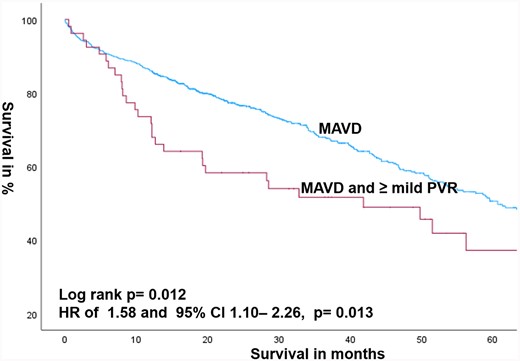
Kaplan–Meier estimates of survival comparing MAVD patients with the presence or absence of PVR after TAVR.
Estimate of survival after TAVR according to the presence or absence of MAVD and PVR
| HR | 95% CI | P value | |
|---|---|---|---|
| Survival according to the presence or absence of MAVD | |||
| MAVD with AR ≥ mild | 1.412 | 1.063–1.877 | P = 0.017 |
| MAVD with AR ≥ mild adjusted for age and gender | 1.475 | 1.109–1.963 | P = 0.008 |
| MAVD with AR ≥ mild adjusted for age and gender, PM before TAVR | 1.484 | 1.115–1.976 | P = 0.007 |
| MAVD with AR ≥ severe | 2.292 | 1.14–4.63 | P = 0.018 |
| Isolated AS without PVR | 0.657 | 0.432–0.997 | P = 0.048 |
| Survival for all patients (isolated AS and MAVD) developing PVR | |||
| PVR ≥ mild | 1.328 | 1.054–1.673 | P = 0.016 |
| PVR ≥ mild adjusted for age and gender | 1.314 | 1.042–1.657 | P = 0.021 |
| Survival in MAVD patients developing PVR | |||
| PVR ≥ mild | 1.296 | 1.038–1.618 | P = 0.022 |
| PVR ≥ mild adjusted for age and gender | 1.294 | 1.035–1.616 | P = 0.023 |
MAVD, mixed aortic valve disease; AS, aortic stenosis; PVR, paravalvular regurgitation.
In the first follow-up, more than mild PVR occurred in 36 out of 220 patients with isolated AS (16.36%) and in 121 out of 606 patients with MAVD (19.97%) (P = 0.243). In the last follow-up, more than mild PVR occurred in 7 out of 29 patients with isolated AS (24.14%) and in 49 out of 159 patients with MAVD (30.82%) (P = 0.469).
The occurrence of PVR was analysed for each transcatheter heart valve (THV) namely for each Edwards Sapien generation as well as for the self-expandable valves, namely Medtronic Evolut Pro and Acurate Neo. Here, we found a significant difference for Edwards Sapien XT with n = 9 (3.86%) in isolated AS and n = 102 (15.77%) in MAVD with P = <0.001. For Edwards Sapien 3, we couldn’t find any significant difference with n = 91 (39.06%) in isolated AS and n = 271 (41.86%) in MAVD with P = 0.452.
Discussion
In this large-scale outcome study, 73.5% of patients treated with TAVR had MAVD, defined as the presence of at least mild AR alongside severe AS. Notably, MAVD was associated with higher mortality rates and an increased incidence of PVR following TAVR compared with patients with isolated AS. Importantly, both isolated AS and MAVD patients who developed PVR post-TAVR had a reduced long-term survival.
The main objective of this study was to analyse the enduring impact of MAVD on post-interventional PVR and mortality. Previous investigations on MAVD after TAVR are limited, mainly consisting of studies with relatively short follow-up periods (12 up to 27 months). These studies have often reported comparable or even better outcomes for MAVD.13,15 This phenomenon has been attributed to a better LV adaptation to AR in MAVD patients and hence increased adaptive capability to PVL post-TAVR.13–15 Furthermore, earlier research indicated that 1-year survival was comparable between MAVD and AS patients, both in unmatched and matched cohorts.21 Also, a recent study showed that TAVR in MAVD is associated with comparable outcomes at 1 year compared with patients with isolated severe AS.22 Additionally a previous meta-analysis found that MAVD patients had similar or improved survival 1 year after TAVR compared with those with isolated AS.23
In the present study, however, we observed a reduced long-term survival of MAVD patients compared with those with isolated AS. These diverging results may be attributed to the increased follow-up period in our study spanning a median of 70 months. This extended follow-up duration allows for a more comprehensive assessment of the long-term impact of LV impairment due to combined pressure volume overload.
Various factors, including heightened LV wall tension, compensatory eccentric hypertrophy, and chamber dilatation, have been implicated in contributing to the exacerbation of LV remodelling. This phenomenon is characterized by an increase in interstitial fibrosis and a reduction in LV compliance, as elucidated in previous studies.24 Importantly, a recent investigation has shed light on the prevalence of mild-to-moderate AR in patients hospitalized for heart failure with preserved ejection fraction (HFpEF). This specific condition has been linked to adverse LV remodelling and poorer long-term outcomes, underscoring the potential negative impact of AR even in the context of preserved ejection fraction.25 While these findings provide valuable insights into the relationship between AR and LV remodelling in HFpEF, the precise influence of AR duration on the development of heart failure remains uncertain.
In summary, the presence of AR is hypothesized to contribute to an increase in interstitial fibrosis and a reduction in LV compliance, potentially leading to heart failure. The impact of paravalvular leak (PVL) adds complexity, particularly in the context of MAVD, as outlined in the guidelines of American Society of Echocardiography.20
This underscores the need for further trials to deepen our understanding of the nuanced interplay between AR duration and its potential consequences on cardiac function and survival in these circumstances.
In this context, the evaluation of LV global longitudinal strain (LV-GLS) may serve as a useful tool for risk stratification in patients with MAVD.26 Even medically managed patients with moderate-to-severe AS with coexisting AR vs. isolated AS showed adverse changes in echocardiographic profile and worse outcomes in previous studies.27 This underscores the potential importance of early treatment, especially in MAVD patients.
Concerning PVR, our findings indicate that PVR after TAVR is associated with reduced long-term survival in both isolated AS and MAVD. However, MAVD patients are more likely to have PVR after TAVR, which is consistent with the current literature. A previous systematic review and meta-analysis also reported that the MAVD group had higher odds of moderate-to-severe PVR.6 This, in turn, was associated with poorer survival. Additionally, patients developing mild PVR after TAVR were found to have an increased risk of 5-year mortality.16 Previous data revealed that even mild PVL assessed by echocardiography was an independent predictor for 5-year survival.28 In summary, PVR is more prevalent in MAVD and associated with reduced survival in both isolated AS and MAVD patients.
The impact of PVR may influence the peri-procedural decision concerning post-dilatation. A recent study by Landes et al.29 demonstrated the prognostic implications of treating late PVR after transcatheter aortic valve implantation (TAVI), with successful reduction of PVL leading to a better prognosis. Further studies analysing the benefits and risks of post-dilatation in MAVD developing PVR should be conducted to facilitate a thorough risk–benefit analysis.
Study limitations
The findings of our study are exploratory and need to be interpreted in light of some limitations.
First, we lacked data on the exact duration of pre-existence of AR alongside AS which undoubtedly influences long-term outcome, particularly through LV remodelling. On account of latent symptoms, only regular health examinations can avoid this issue.
Another important limitation is the definition of MAVD. In literature, different definitions can be found. We opted for the widely used definition for MAVD with at least mild AR, although alternative definitions, such as including at least moderate or severe AR alongside severe AS, are also conceivable.
Furthermore, our study did not differentiate the rate of bicuspid anatomy, which is a potential area of further investigations and analysis.
Further, of course, there is an ongoing development of the devices with outer skirts or sealing strategies. This in turn might impact the outcome in MAVD. However, this issue is difficult to answer, since long-term data isn’t available so far. This should be assessed in future studies.
Further, the rate of pre-implant dilatation could impact the occurrence of PVR. Pre-dilatation is routinely performed in Acurate Neo valves. Concerning the other THV types, the choice of weather to use pre-dilatation or not was left to the discretion of the implanting operator and performed in cases of heavy calcification.
Furthermore, the incidence of post-procedural pacemaker implantation in patients with MAVD and isolated AS is a pertinent concern, as it has the potential to contribute to long-term heart failure. We incorporated the post-TAVR pacemaker implantation figures into the analysis. There was no statistically significant difference observed between isolated AS (n = 32, 13.7%) and MAVD (n = 74, 11.4%) with a P value of 0.2893. However, the precise percentage of right ventricular stimulation, which may be associated with long-term heart failure, remains unknown.
Funding
None declared.
Data availability
The data underlying this article are available in the TAVI Register of Vienna and will be shared on reasonable request to the corresponding author.
References
Author notes
Conflict of interest: M.A. is a proctor/consultant/speaker (Edwards, Abbott, Medtronic, Boston, AbbVie, Zoll) and received institutional research grants (Edwards, Abbott, Medtronic, LSI). All other authors have no relationships relevant to the contents of this article to disclose.
