


Abstract
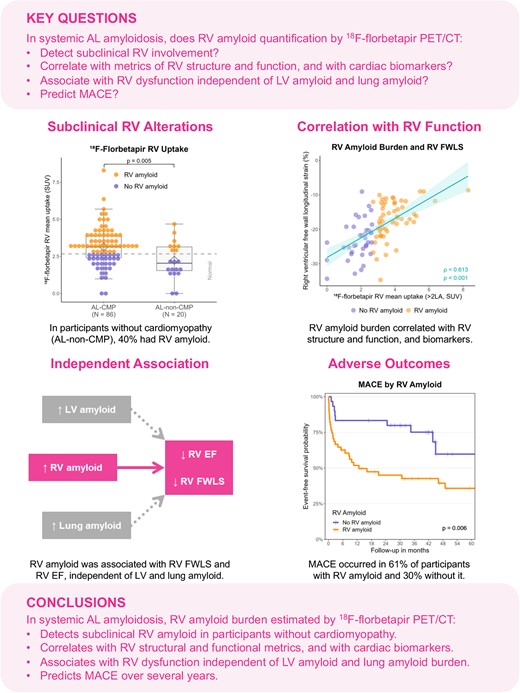
In systemic light-chain (AL) amyloidosis, quantification of right ventricular (RV) amyloid burden has been limited and the pathogenesis of RV dysfunction is poorly understood. Using 18F-florbetapir positron emission tomography/computed tomography (PET/CT), we aimed to quantify RV amyloid; correlate RV amyloid with RV structure and function; determine the independent contributions of RV, left ventricular (LV), and lung amyloid to RV function; and associate RV amyloid with major adverse cardiac events (MACE: death, heart failure hospitalization, cardiac transplantation).
We prospectively enrolled 106 participants with AL amyloidosis (median age 62 years, 55% males) who underwent 18F-florbetapir PET/CT, magnetic resonance imaging, and echocardiography. 18F-florbetapir PET/CT identified RV amyloid in 63% of those with and 40% of those without cardiac involvement by conventional criteria. RV amyloid burden correlated with RV ejection fraction (EF), RV free wall longitudinal strain (FWLS), RV wall thickness, RV mass index, N-terminal pro-brain natriuretic peptide, troponin T, LV amyloid, and lung amyloid (each P < 0.001). In multivariable analysis, RV amyloid burden, but not LV or lung amyloid burden, predicted RV dysfunction (EF P = 0.014; FWLS P < 0.001). During a median follow-up of 28 months, RV amyloid burden predicted MACE (P < 0.001).
This study shows for the first time that 18F-florbetapir PET/CT identifies early RV amyloid in systemic AL amyloidosis prior to alterations in RV structure and function. Increasing RV amyloid on 18F-florbetapir PET/CT is associated with worse RV structure and function, predicts RV dysfunction, and predicts MACE. These results imply a central role for RV amyloid in the pathogenesis of RV dysfunction.
AL, light-chain amyloidosis; EF, ejection fraction; FWLS, free wall longitudinal strain; LV, left ventricular; MACE, major adverse cardiac events (all-cause death, heart failure hospitalization, or cardiac transplantation); PET/CT, positron emission tomography/computed tomography; RV, right ventricular.
Introduction
In systemic light-chain (AL) amyloidosis, clonal plasma cells produce abnormal immunoglobulin light chains prone to misfolding and aggregation as amyloid fibrils.1 Amyloid accumulates in multiple organs and expands the extracellular space, leading to organ dysfunction and death.1 Although left ventricular (LV) involvement is a key component of cardiomyopathy from AL amyloidosis, alterations of right ventricular (RV) structure and function on echocardiography or magnetic resonance imaging (MRI) add important diagnostic value to differentiate amyloidosis from other forms of myocardial thickening or hypertrophy.2–5 However, amyloid burden in the RV could not be well quantified until now due to the lack of targeted molecular amyloid tracers and challenges with MRI-based RV extracellular volume (ECV). The pathogenesis of RV dysfunction in AL amyloidosis also remains unclear. RV dysfunction might be due to (i) RV amyloid burden, (ii) increased RV afterload secondary to LV dysfunction from amyloidosis, and/or (iii) increased RV afterload secondary to pulmonary amyloidosis. The impact of each of these factors on RV function could not be studied until recently, due to the lack of methods to quantify RV amyloid. Moreover, whether RV amyloid burden is associated with clinical outcomes is unknown.
Fortunately, new molecular tracers for amyloid imaging are available now and can quantify amyloid burden using positron emission tomography/computed tomography (PET/CT).6,7 Among them, 18F-florbetapir was successfully used to assess LV amyloid burden, early LV infiltration, and lung amyloid in AL amyloidosis.8–13 However, quantification of RV amyloid burden using molecular PET/CT tracers has not been studied until now. This study aimed to determine whether RV amyloid quantification by 18F-florbetapir PET/CT in patients with systemic AL amyloidosis (i) detects subclinical RV involvement in patients without cardiomyopathy by conventional criteria, (ii) correlates with established metrics of RV structure and function and cardiac biomarkers, (iii) associates with RV dysfunction independent of LV amyloid and lung amyloid, and (iv) predicts major adverse cardiac outcomes (MACE). We used 18F-florbetapir PET/CT to quantify amyloid burden in the RV, LV, and lungs and cardiac MRI and echocardiography to quantify RV function.
Methods
Participant inclusion and definitions
The study was approved by the Mass General Brigham Human Research Committee, and each participant provided written informed consent. From 2016 to 2022, we prospectively enrolled 106 participants with systemic AL amyloidosis and without relevant non-amyloid cardiac disease from specialized centres into the Molecular Imaging of Primary Amyloid Cardiomyopathy Study (MICA; NCT02641145).10–13 Systemic AL amyloidosis was diagnosed by standard criteria, including biopsy with confirmation of amyloid type by immunohistochemistry or mass spectrometry in >95% of cases. The presence of AL cardiomyopathy (AL-CMP) was prospectively defined by elevated cardiac biomarkers, while the absence of AL cardiomyopathy (AL-non-CMP) was defined by normal cardiac biomarkers and LV wall thickness < 12 mm, as recommended for AL cardiomyopathy.14 Elevated cardiac biomarkers were defined as troponin T > 0.014 ng/mL in males or >0.009 ng/mL in females or abnormal age-adjusted N-terminal pro-brain natriuretic peptide (NT-proBNP) (>450 pg/mL if <50 years, >900 pg/mL if 50–75 years, or >1800 pg/mL if >75 years).The Mayo stage was calculated as one point + the number of the following criteria: troponin T ≥ 0.025 ng/mL, NT-proBNP ≥ 1800 pg/mL, and dFLC ≥ 180 mg/L.15 We also enrolled 10 control subjects without amyloidosis to evaluate normal radiotracer uptake levels.
18F-florbetapir PET/CT
All participants underwent a cardiac PET/CT (Discovery ST or Discovery MI, GE HealthCare, Chicago, IL, USA) with a list-mode acquisition at the Brigham and Women’s Hospital. A low-dose chest CT scan was acquired for patient positioning and attenuation correction of the PET emission data. 18F-florbetapir was injected intravenously 1 min after the start of PET acquisition. The median injected 18F-florbetapir activity was 9.2 mCi [interquartile range (IQR) 8.5–9.9], with a median effective dose of 7.0 mSv (IQR 6.5–7.5), including 0.5 mSv for the CT scan. Static images of the heart were reconstructed using data from 4 to 30 min after radiotracer injection, based on previous data on 18F-florbetapir washout.8 18F-florbetapir uptake was measured volumetrically on deidentified static images using PMOD software (PMOD Technologies LLC, Zürich, Switzerland). A volume of interest (VOI) was drawn on each slice of the PET images using fusion with CT images to broadly define the RV and LV contours, including the blood pool in the respective cavities and including the interventricular septum in the LV tracings. To minimize observer bias in myocardial tracings and therefore favour reproducibility, we used the iso-contouring function from PMOD on the RV and LV VOI to delineate the myocardial wall uptake without blood pool. This was accomplished by automatic thresholding of VOI activity concentration above two times the mean blood pool activity concentration, measured in a 10 mm spherical left atrial VOI, as previously done.8 After iso-contouring, the resulting RV VOI and LV VOI only included the volumes with activity higher than two times the blood pool, corresponding to the RV or LV wall (see Supplementary data online, Figure S1). Furthermore, radiotracer uptake was measured in representative lung slices in the upper and lower lung fields on both sides, and results were averaged. Standardized uptake values (SUV) were calculated as the measured activity concentration divided by injected activity per body weight. Inter-rater agreement was excellent, without significant bias in Bland–Altman analysis and with an intraclass correlation coefficient of 0.92 [95% confidence interval (CI) 0.84–0.96, P < 0.001].
Definition of RV, LV, and lung amyloid burden and of the presence of amyloid
We used SUVmean to quantify RV, LV, and lung amyloid burden. The presence (or absence) of RV amyloid was defined using a SUVmean threshold defined as the mean + 2 standard deviations of SUVmean in controls as following: RV threshold 2.67 SUV, LV threshold 3.03 SUV, and lung threshold 0.88 SUV.
Cardiac MRI
All participants with systemic AL amyloidosis, except one with severe claustrophobia, underwent cardiac MRI on a 3 T device (Siemens, Erlangen, Germany) at the Brigham and Women’s Hospital, mostly on the same day as PET/CT (median absolute difference: 0 day, IQR 0–1), as described previously.16 The protocol included steady-state free-precession cine imaging on short-axis and long-axis slices for cardiac function and morphology. Myocardial LV native T1 maps were acquired for three short-axis slices using the modified Look-Locker inversion recovery technique and then repeated 10 and 20 min after injection of 0.1 mmol/kg of gadoterate meglumine (Guerbet LLC, Bloomington, IN, USA). Post-processing and assessment of RV wall thickness, mass, volumes, and ejection fraction (EF) were performed using MedisSuite (version 3.2, Medical Imaging Systems, Leiden, the Netherlands). Abnormal values were defined based on updated, sex-specific reference values.17 The LV ECV fraction was estimated using haematocrit (obtained on the day of the MRI study) and the partition coefficient for gadolinium from segmental native and post-contrast T1 mappings and then averaged for the LV, as previously described.18
Echocardiography
All participants with systemic AL amyloidosis underwent echocardiography, but 12 exams not performed within 6 months of PET/CT were excluded (median absolute difference if included: 9 days, IQR 1–48). The pulmonary pressure was estimated using the RV systolic pressure, based on the transvalvular tricuspid pressure gradient and visual assessment of the inferior vena cava. RV free wall longitudinal strain (FWLS) and LV global longitudinal strain (GLS) were measured using dedicated software (TOMTEC Image Arena version 4.6, TOMTEC Imaging Systems GmbH, Unterschleissheim, Germany). We used a normal reference value for RV FWLS from a recent meta-analysis.19
Outcome ascertainment
MACE were defined as a composite of all-cause death, heart failure hospitalization, or cardiac transplantation. Event ascertainment was performed by phone calls to participants and review of electronic medical records, with no loss to follow-up. Heart failure hospitalization was adjudicated blinded to imaging results.
Statistical analysis
Continuous variables were presented as median with IQR and categorical variables as frequency with percentage. Groups by presence of RV amyloid on 18F-florbetapir PET/CT were compared using Wilcoxon rank-sum test or Fisher’s exact test, as appropriate.18 F-florbetapir PET/CT SUVmean was used as a continuous measure of amyloid burden. Correlations with RV amyloid burden were quantified using Spearman’s ρ. To determine the specific contributions of RV, LV, and lung amyloid to RV dysfunction, multivariable linear regression was used with RV, LV, and lung SUVmean as pre-specified predictors. Related assumptions were verified, including multicollinearity. Additionally, variable selection using Akaike’s information criterion (AIC) was performed to identify the strongest predictors in parsimonious models. For MACE, we conducted Kaplan–Meier analysis with the log-rank test and Cox regression. Assumptions for proportional effects were verified. Two-sided P-values were considered statistically significant if <0.05. Data were analysed using R version 4.3.2 (R Core Team. R: A language and environment for statistical computing. R Foundation for Statistical Computing, Vienna, Austria), using the packages tidyverse, DescTools, gtsummary, rstatix, correlation, blandr, irr, survminer, and ggsurvfit. Results were reported according to the Strengthening the Reporting of Observational Studies in Epidemiology (STROBE) statement.20
Results
Baseline characteristics
Among our 106 participants with systemic AL amyloidosis, 86 had AL-CMP and 20 AL-non-CMP, the median age was 62 years (IQR 57–68), and 55% were male. In the 10 controls, the median age was 62 years (IQR 53–70) and 70% were male. Participants with RV amyloid, compared with those without it, had significantly higher cardiac biomarkers, worse Mayo stage, and more often met study criteria for AL-CMP (Table 1). Among participants with AL-CMP, 61 had a recent diagnosis and were starting therapy, while 25 were in haematological remission for at least 12 months. Excluding participants in haematological remission did not substantially affect our results (see Supplementary data online).
Baseline characteristics of the study cohort in relation to RV amyloid
| Variable | RV amyloid | No RV amyloid | P-value |
|---|---|---|---|
| (n = 62) | (n = 44) | ||
| Age (years) | 62 (57–68) | 62 (59–66) | 0.753 |
| Male sex | 38 (61%) | 20 (45%) | 0.118 |
| Body mass index (kg/m2) | 27 (24–30) | 23 (22–26) | <0.001 |
| Heart rate (b.p.m.) | 81 (74–87) | 75 (66–81) | 0.004 |
| Systolic blood pressure (mmHg) | 111 (99–124) | 121 (106–135) | 0.013 |
| Diastolic blood pressure (mmHg) | 67 (62–75) | 68 (61–76) | 0.842 |
| eGFR (mL/min/1.73 m2) | 71 (56–82) | 75 (62–91) | 0.218 |
| Troponin T (ng/mL) | 0.057 (0.010–0.107) | 0.015 (0.009–0.045) | 0.005 |
| NT-proBNP (pg/mL) | 3062 (1121–7909) | 798 (216–1657) | <0.001 |
| dFLC (mg/L) | 174 (57–325) | 85 (8–303) | 0.096 |
| Mayo stage | 3 (2–4) | 2 (1–3) | 0.002 |
| Cardiomyopathy group | 0.014 | ||
| AL-CMP | 54 (87%) | 32 (73%) | |
| AL-non-CMP | 8 (13%) | 12 (27%) |
Continuous and ordinal variables are presented as median (interquartile range) and categorical variables as frequency (percentage). P-values were calculated using Wilcoxon rank-sum test or Fisher’s exact test.
AL-CMP, systemic light-chain amyloidosis with cardiomyopathy; AL-non-CMP, systemic light-chain amyloidosis without cardiomyopathy; dFLC, difference between immunoglobulin free light chains; eGFR, estimated glomerular filtration rate; NT-proBNP, N-terminal pro-B-type natriuretic peptide; RV, right ventricular.
Characterization of RV amyloid by 18F-florbetapir PET/CT
The majority of participants with AL amyloidosis (62 participants, 58%) had RV amyloid by 18F-florbetapir PET/CT (Figure 1). RV amyloid was detected not only in 63% of participants with known cardiomyopathy but also in 40% of those without cardiac involvement by cardiac biomarker and wall thickness criteria (Figure 2). Thus, a substantial proportion of participants without cardiomyopathy by standard criteria had RV involvement by 18F-florbetapir PET/CT. This suggests that 18F-florbetapir uptake is an early marker of RV amyloid infiltration.
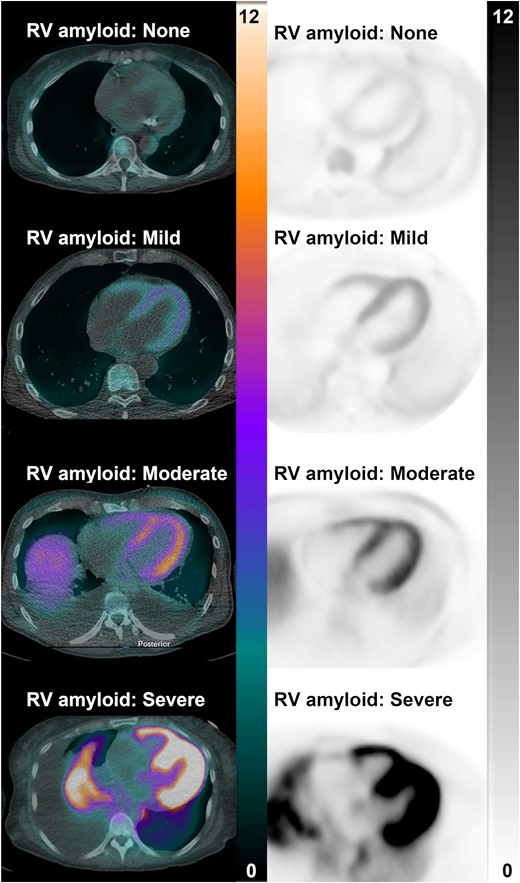
These representative PET/CT and PET images from four participants with systemic light-chain amyloidosis show no, mild, moderate, and severe 18F-florbetapir uptake in the right (and left) ventricle. Scales are in SUV. PET/CT, positron emission tomography/computed tomography.

18F-florbetapir RV mean uptake was measured on PET/CT and reflects RV amyloid burden. The P-value was calculated using Wilcoxon rank-sum test. AL-CMP, systemic light-chain amyloidosis with cardiomyopathy; AL-non-CMP, systemic light-chain amyloidosis without cardiomyopathy; PET/CT, positron emission tomography/computed tomography; RV, right ventricular; SUV, standardized uptake value.
LV and lung amyloid burden in relation to RV amyloid
The presence of RV amyloid was associated with significantly higher LV and lung amyloid burden by 18F-florbetapir PET/CT SUVmean (Table 2). Among participants with RV amyloid, 97% had LV amyloid and 85% had lung amyloid. Moreover, 79% of those with LV amyloid and 79% of those with lung amyloid also had RV amyloid.
RV, LV, and lung amyloid burden in relation to RV amyloid
| Variable | RV amyloid | No RV amyloid | Controls | P-value |
|---|---|---|---|---|
| (n = 62) | (n = 44) | (n = 10) | ||
| RV SUVmean | 3.5 (3.2–4.1) | 2.0 (1.5–2.4) | 1.1 (0.8–1.6) | <0.001 |
| LV SUVmean | 5.1 (4.3–6.1) | 2.4 (1.9–3.4) | 1.1 (0.8–2.0) | <0.001 |
| LV amyloid | 60 (97%) | 16 (36%) | 0 (0%) | <0.001 |
| Lung SUVmean | 2.6 (1.0–4.3) | 0.7 (0.5, 1.2) | 0.3 (0.3–0.4) | <0.001 |
| Lung amyloid | 53 (85%) | 14 (32%) | 0 (0%) | <0.001 |
Amyloid burden was measured on 18F-florbetapir PET/CT. Continuous variables are presented as median (interquartile range) and categorical variables as frequency (percentage). P-values were calculated using Wilcoxon rank-sum test or Fisher’s exact test.
LV, left ventricular; PET/CT, positron emission tomography/computed tomography; RV, right ventricular; SUV, standardized uptake value.
RV structure and function in relation to RV amyloid
RV amyloid was associated with significantly worse RV structure (e.g. RV wall thickness and RV mass index), RV function (e.g. RV EF and RV FWLS), and cardiac biomarkers (Figure 3, Table 3). Among participants with RV amyloid, 64% had impaired RV FWLS, but only 23% had increased RV wall thickness, 20% had increased RV mass index, and 25% had reduced RV EF. This suggests that 18F-florbetapir uptake is a more sensitive marker of RV amyloid infiltration than these other metrics. The cohort with RV amyloid, compared with without RV amyloid, also exhibited worse LV structural and functional metrics but similar RV systolic pressures. These findings support the ability of 18F-florbetapir PET/CT to detect RV amyloid infiltration prior to structural and functional changes.
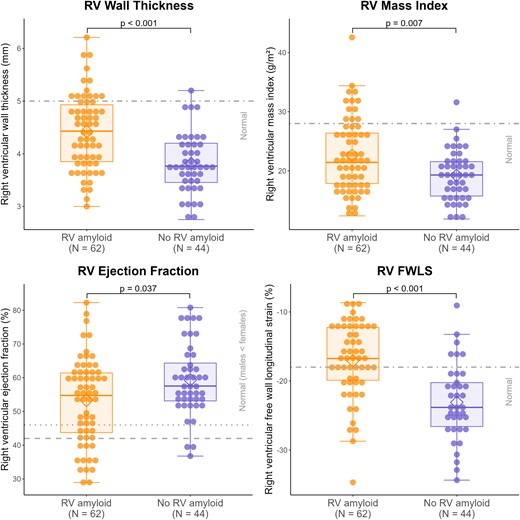
Right ventricular wall thickness, mass index, and ejection fraction were measured on MRI and RV FWLS on echocardiography. Normal reference values were RV wall thickness ≤ 5 mm, RV mass index ≤ 28 g/m2, RV ejection fraction ≥ 42% in males and ≥46% in females, and RV FWLS ≤ −18% (see Methods). RV amyloid was determined on 18F-florbetapir PET/CT. P-values were calculated using Wilcoxon rank-sum test. PET/CT, positron emission tomography/computed tomography; RV, right ventricular.
Cardiac structure and function in relation to RV amyloid
| Variable | RV amyloid | No RV amyloid | P-value |
|---|---|---|---|
| (n = 62) | (n = 44) | ||
| Right heart | |||
| RV wall thickness (mm) | 4.4 (3.9–4.9) | 3.8 (3.5–4.2) | <0.001 |
| RV mass index (g/m2) | 21.4 (17.8–26.4) | 19.3 (15.7–21.5) | 0.007 |
| RV EDV index (mL/m2) | 75.6 (56.2–86.7) | 72.0 (59.4–80.3) | 0.601 |
| RV ESV index (mL/m2) | 32.5 (22.6–47.3) | 30.6 (21.5–35.0) | 0.121 |
| RV stroke volume index (mL/m2) | 36.8 (31.9–41.5) | 41.8 (36.8–44.5) | 0.003 |
| RV EF (%) | 54.7 (43.7–61.4) | 57.5 (53.1–64.3) | 0.037 |
| TAPSE (mm) | 11.9 (9.5–15.7) | 16.4 (12.6–20.9) | 0.002 |
| RA surface index (cm2/m2) | 10.4 (8.5–12.9) | 10.4 (8.0–12.3) | 0.544 |
| RV FWLS (%) | −16.7 (−19.9 to −12.3) | −23.8 (−26.6 to −20.2) | <0.001 |
| RV systolic pressure (mmHg) | 36.3 (27.9–42.2) | 33.8 (26.6–39.5) | 0.523 |
| Left heart | |||
| LV maximal wall thickness (mm) | 18.3 (15.7–21.5) | 14.9 (13.1–18.5) | <0.001 |
| LV mass index (g/m2) | 81.2 (69.5–99.3) | 63.8 (51.3–81.0) | <0.001 |
| LV extracellular volume (%) | 52.4 (46.4–57.7) | 43.2 (34.3–51.2) | <0.001 |
| LV EDV index (mL/m2) | 70.4 (60.1–77.5) | 73.2 (62.0–79.3) | 0.411 |
| LV ESV index (mL/m2) | 31.0 (24.8–35.8) | 29.4 (23.3–34.3) | 0.271 |
| LV stroke volume index (mL/m2) | 37.3 (32.1–41.8) | 42.1 (36.7–46.6) | 0.002 |
| LV EF (%) | 54.8 (48.7–59.8) | 59.9 (54.6–63.7) | 0.004 |
| LA volume index (mL/m2) | 48.3 (37.9–55.9) | 43.9 (32.0–55.2) | 0.131 |
| LV GLS (%) | −14.0 (−16.6 to −11.5) | −19.4 (−22.1 to −16.4) | <0.001 |
Metrics were obtained from MRI, except RV FWLS, RV systolic pressure, and LV GLS from echocardiography. Variables are presented as median (interquartile range) or frequency (percentage). P-values were calculated using Wilcoxon rank-sum test of Fisher’s exact test.
EDV, end-diastolic volume; EF, ejection fraction; ESV, end-systolic volume; FWLS, free wall longitudinal strain; GLS, global longitudinal strain; LA, left atrial; LV, left ventricular; RA, right atrial; RV, right ventricular; TAPSE, tricuspid annular plane systolic excursion.
Correlation of RV amyloid burden with structural and functional metrics
Using 18F-florbetapir PET/CT SUVmean as a continuous measure of amyloid burden, there was a strong correlation between RV and LV amyloid burden (ρ = 0.84, P < 0.001) and a moderate correlation between RV and lung amyloid burden (ρ = 0.55, P < 0.001). RV amyloid burden was moderately correlated with RV wall thickness (ρ = 0.49), RV mass index (ρ = 0.39), RV EF (ρ = −0.32), tricuspid annular plane systolic excursion (TAPSE) (ρ = −0.42), RV FWLS (ρ = 0.61), NT-proBNP (ρ = 0.52), and troponin T (ρ = 0.40; each P < 0.001; Supplementary data online, Table S4 and Figure S2). We also found moderate correlations with LV structural and functional metrics. Thus, higher RV amyloid burden was associated with higher LV and lung amyloid burden, worse changes in RV and LV structure and function, and higher NT-proBNP and troponin T. However, RV amyloid burden was not correlated with RV systolic pressure (ρ = 0.14).
Determinants of RV function
One of our goals was to evaluate the three plausible determinants of RV dysfunction in AL amyloidosis: RV amyloid, increased afterload from LV amyloid with LV dysfunction, or increased afterload from lung amyloid. Accordingly, we analysed the univariable and multivariable-adjusted associations between these three measures and RV function, using distinct models to predict RV EF and RV FWLS (Table 4, Graphical Abstract). RV systolic pressure was not included in the models, as it mediates the effect of LV and lung amyloid on increased afterload. Among RV, LV, and lung amyloid burden, RV amyloid burden was the strongest univariable and the only significant multivariable predictor for RV EF and RV FWLS (P = 0.014 and P < 0.001). Moreover, AIC-based variable selection retained RV amyloid burden alone for each model, such that adding LV or lung amyloid burden would not improve the prediction of RV EF and RV FWLS.
Univariable and multivariable-adjusted predictors of RV function
| Variable | Univariable models | Multivariable models | ||||
|---|---|---|---|---|---|---|
| Coefficient | 95% confidence interval | P-value | Coefficient | 95% confidence interval | P-value | |
| Prediction of RV ejection fraction | ||||||
| RV amyloid | −3.61 | −5.27 to −1.95 | <0.001 | −4.15 | −7.44 to −0.87 | 0.014 |
| LV amyloid | −1.81 | −2.87 to −0.75 | 0.001 | 0.44 | −1.59–2.48 | 0.667 |
| Lung amyloid | −0.59 | −1.44–0.26 | 0.171 | −0.12 | −0.96–0.71 | 0.771 |
| Prediction of RV free wall longitudinal strain | ||||||
| RV amyloid | 2.84 | 2.07–3.62 | <0.001 | 3.13 | 1.59–4.66 | <0.001 |
| LV amyloid | 1.45 | 0.93–1.97 | <0.001 | −0.29 | −1.24–0.66 | 0.551 |
| Lung amyloid | 0.49 | 0.08–0.89 | 0.018 | 0.19 | −0.15–0.54 | 0.268 |
RV, LV, and lung amyloid burden were measured on 18F-florbetapir PET/CT, RV ejection fraction on MRI, and RV free wall longitudinal strain on echocardiography. Models were fit using linear regression. Each multivariable model included RV, LV, and lung amyloid.
LV, left ventricular; RV, right ventricular.
RV amyloid and adverse outcome
This analysis was performed in the 81 participants with new diagnosis of AL amyloidosis. Participants in haematological remission were excluded, because they are survivors, and including them would cause selection bias. During a median follow-up of 28 months (IQR 3–45, time to MACE or censoring), 22 participants died (27%), 25 were hospitalized for heart failure (31%), 4 underwent cardiac transplantation (5%), and 40 experienced any MACE (49%). In Kaplan–Meier analysis, participants with RV amyloid had a higher incidence of MACE than those without it (61% vs. 30%, P = 0.006; Figure 4). In Cox regression, the presence of RV amyloid was associated with a hazard ratio of 2.72 for MACE (95% CI 1.29–5.74, P = 0.008) and RV amyloid burden with a hazard ratio of 1.47 for MACE (by SUV unit, 95% CI 1.19–1.80, P < 0.001).
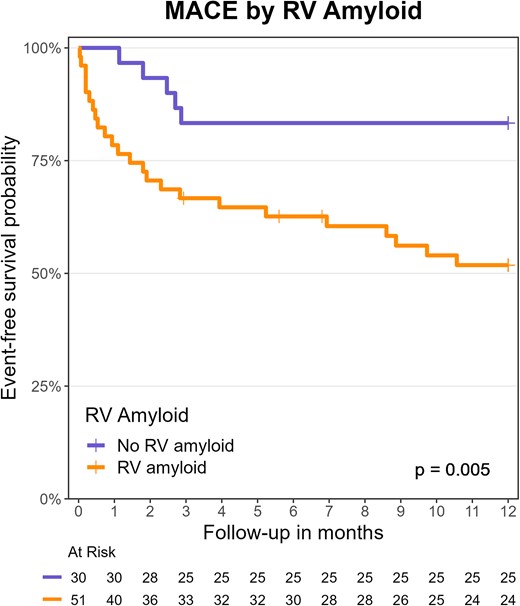
Kaplan–Meier analysis and the log-rank test were performed on MACE by the presence of RV amyloid on 18F-florbetapir PET/CT. MACE, major adverse cardiac events (all-cause death, heart failure hospitalization, or cardiac transplantation); PET/CT, positron emission tomography/computed tomography; RV, right ventricular.
Discussion
In this prospective study of 106 participants with systemic AL amyloidosis, we found four key results on RV amyloid burden quantified using 18F-florbetapir PET/CT (Graphical Abstract). First, RV amyloid was detected by 18F-florbetapir PET/CT in 40% of participants not meeting conventional criteria for cardiac involvement. RV amyloid by 18F-florbetapir PET/CT was detected much more frequently than alterations of RV structure and function by MRI or echocardiography. Among participants with RV amyloid, nearly two-thirds showed abnormal longitudinal strain and about a quarter exhibited abnormal RV structural metrics or EF. This suggests a higher sensitivity of 18F-florbetapir PET/CT to detect early RV involvement in AL amyloidosis. Secondly, higher RV amyloid burden was associated with worse alterations in metrics of RV structure and function, such as RV wall thickness, RV mass index, RV EF, and RV FWLS, as well as higher NT-proBNP and troponin T. Moreover, RV amyloid burden was strongly correlated with LV amyloid burden and moderately correlated with lung amyloid burden. However, there was no association between RV amyloid burden and RV systolic pressure. This may be explained by the variability of pulmonary pressure, which responds to volume status and diuretic treatment, and may therefore become unrelated to cardiac disease severity. Thirdly, in multivariable models, RV amyloid burden emerged as the strongest predictor of RV dysfunction, measured by RV EF and RV FWLS. Thus, RV dysfunction in AL amyloidosis appears to be primarily driven by RV amyloid infiltration, rather than by increased afterload from LV amyloid-induced dysfunction or from lung amyloid infiltration. Finally, in outcome analysis, the RV amyloid burden by 18F-florbetapir PET/CT was strongly predictive of MACE.
To our knowledge, this is the first study reporting the quantification of RV AL amyloid burden using an amyloid-specific molecular tracer and analysing its impact on RV function and adverse outcomes. Previously, RV uptake was reported in one study using 11C-Pittsburgh compound B PET/CT but without detailed analysis.21 Other studies with amyloid-specific PET/CT tracers only mentioned RV uptake or showed it on images.22–24 In MRI, quantitative methods such as T1 mapping and ECV are limited by the thin RV wall. Echocardiography can assess RV structure and function but does not quantify amyloid burden, while scintigraphy with bone-avid tracers preferentially detects transthyretin amyloidosis.6,7 In contrast, the present study used a novel RV amyloid quantification approach based on 18F-florbetapir PET/CT to generate new insights not only on RV amyloid deposition but also on its associations with RV structure and function by multimodality imaging, as well as with adverse outcomes.
RV dysfunction is known from multiple studies as a key predictor of adverse outcomes in cardiac AL amyloidosis.2–5,25–28 However, its pathogenesis remains unclear. Diffuse amyloid deposition involving the right ventricle is one of the possible causes. Furthermore, LV amyloid infiltration may increase LV filling pressure, leading to pulmonary hypertension and increased RV afterload, causing RV dysfunction. This mechanism of RV dysfunction is known in heart failure with preserved LV EF and predicts worse prognosis.29 Moreover, lung amyloid deposition, previously reported in AL amyloidosis,13 could also increase RV afterload and cause RV dysfunction. A previous study presented correlations between RV functional metrics and LV amyloid burden quantified with LV ECV on MRI.30 The authors reported a lack of correlation between LV ECV and invasive pulmonary pressure and therefore hypothesized a causal role of RV amyloid in RV dysfunction. However, RV amyloid quantification is necessary to confirm this hypothesis. Using the ability of 18F-florbetapir PET/CT to specifically measure RV, LV, and lung amyloid, our study shows evidence implying RV amyloid burden as the primary driver of RV dysfunction and as a predictor of adverse outcomes. Moreover, the strong correlation between RV and LV amyloid burden underscores the diffuse cardiac deposition of amyloid leading to biventricular dysfunction and heart failure.
This study has some limitations. First, the accuracy of RV amyloid burden quantification was not confirmed by a reference standard. In fact, no appropriate reference standard exists for quantification in vivo. Endomyocardial biopsy only samples a minimal fraction of the heterogeneous myocardial amyloid deposits.7 Accurate amyloid quantification would require an autopsy with examination of the whole heart and would therefore not be feasible in vivo. In MRI, late gadolinium enhancement and ECV quantification detect extracellular matrix expansion but are not specific for amyloid and may reflect fibrosis, inflammation, or oedema.7 Notably, quantification of RV ECV is technically challenging. In contrast, the specific binding of 18F-florbetapir to amyloid deposits was previously confirmed in vitro on myocardial sections using autoradiography.9 Thus, non-invasive imaging with an amyloid-specific tracer is currently the best quantitative approach available in vivo. The observed correlations between RV 18F-florbetapir uptake and validated RV structural and functional metrics from MRI and echocardiography support the validity of our method for amyloid quantification. The present study also has notable strengths. Our sample size of 106 participants with AL amyloidosis is large for this rare disease, larger than in previous studies on amyloid-specific PET/CT tracers.21–24 Another strength of this study was the structured, prospective cohort design with comprehensive participant assessment including clinical data, laboratory tests, 18F-florbetapir PET/CT, MRI, echocardiography, and clinical outcomes, allowing for the assessment of novel specific amyloid quantification methods.
In conclusion, quantitative molecular imaging of RV amyloid by 18F-florbetapir PET/CT detects early RV involvement in systemic AL amyloidosis even in patients without cardiomyopathy by cardiac biomarkers and without alterations in RV structure or RV function by multimodality imaging. High RV amyloid burden by 18F-florbetapir PET/CT is associated with worse RV structural and functional metrics and higher cardiac biomarker levels. Finally, high RV amyloid burden is a strong predictor of RV dysfunction and of adverse outcomes. These results support a central role of RV amyloid burden in RV dysfunction, paving the way for further use of amyloid-specific PET/CT tracers for amyloid quantification in patients with systemic AL amyloidosis.
Supplementary data
Supplementary data are available at European Heart Journal - Cardiovascular Imaging online.
Acknowledgements
We are extremely grateful to each of the study participants and their families for their participation and to our funding partners for making this study possible.
Funding
This work was supported by grants from the National Institutes of Health and American Heart Association (AHA). S.D.: NIH R01HL130563, AHA grants 16CSA28880004, and AHA19SRG34950011. R.H.F.: NIH R01HL130563. R.L.: AHA16CSA28880004 and AHA19SRG34950011. F.L.R.: NIH R01HL130563 and NIH R01HL093148 https://clinicaltrials.gov/ct2/show/NCT02641145.
Data availability
The data underlying this article cannot be shared publicly due to data privacy as defined in the informed consent document.
References
Author notes
Yesh Datar and Olivier F. Clerc Shared first authors.
Conflict of interest: O.F.C.: Research fellowship from the International Society of Amyloidosis and Pfizer. S.A.M.C.: Investigator-initiated research grant from Pfizer. A.J.Y.: Consulting fees from AbbVie, Adaptive Biotechnologies, Amgen, Bristol-Myers Squibb, Celgene, GlaxoSmithKline, Janssen, Karyopharm, Oncopeptides, Regeneron, Sanofi, and Takeda. V.S.: Research support from Takeda, Celgene, Janssen, and Prothena and scientific advisory board for Caelum Biosciences. F.L.R.: Consulting fees from AstraZeneca and research support from Pfizer, Alnylam, and Ionis/Akcea. H.L.: Consulting fees from Celgene, Takeda, Janssen, Prothena, Pfizer, and Juno and research support from Amgen, Spectrum, and Takeda. R.Y.K.: Grant funding from Alnylam Pharmaceuticals. M.F.D.C.: Research grant from Spectrum Dynamics and Gilead and consulting fees from Sanofi and General Electric. R.H.F.: Consulting fees from Ionis Pharmaceuticals, Alnylam Pharmaceuticals, and Caelum Biosciences and research funding from GlaxoSmithKline and Akcea. S.D.: Consulting fees from Pfizer and GE HealthCare and investigator-initiated grant from Pfizer, Attralus, GE HealthCare, Phillips, and Siemens. The other authors do not have any conflicts of interest related to this study to declare.
