


Abstract
Permanent pacemaker (PM) implantation is common after transcatheter aortic valve implantation (TAVI). Left ventricular mechanical dispersion (MeDi) by speckle tracking echocardiography is a marker of fibrosis that causes alterations in the conduction system. We hypothesized that MeDi can be a predictor of the need for PM implantation after TAVI.
Consecutively, 200 TAVI patients were enrolled. Transthoracic echocardiography and electrocardiography examinations were recorded before TAVI to evaluate global longitudinal strain (GLS), MeDi, and conduction disturbances. PM implantation information was obtained 3 months after TAVI. Patients were stratified into PM or no PM group. Mean age was 80 + 7 years (44% women). Twenty-nine patients (16%) received PM. MeDi, QRS duration, existence of right bundle branch abnormality (RBBB), and first-degree atrioventricular (AV) block were significantly different between groups. MeDi was 57 ± 15 ms and 48 ± 12 ms in PM and no PM groups, respectively (P < 0.001). In multivariate analysis, MeDi predicted the need for PM after TAVI independently of GLS, QRS duration, RBBB, and first-degree AV block [odds ratio (OR): 1.73, 95% confidence interval (CI): 1.22–2.45] with an area under the curve (AUC) of 0.68 in receiver operating characteristic (ROC) curves. Moreover, RBBB was an independent predictor of PM need after TAVI (OR: 8.98, 95% CI: 1.78–45.03). When added to RBBB, MeDi had an incremental predictive value with an AUC of 0.73 in ROC curves (P = 0.01).
MeDi may be used as an echocardiographic functional predictor of the need for PM after TAVI.
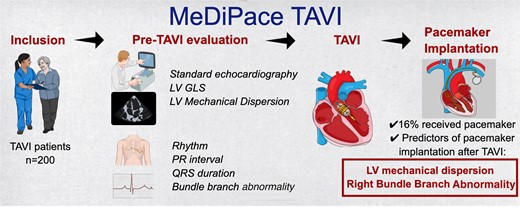
The flow of MeDiPace Transcatheter Aortic Valve Implantation (TAVI) study is summarized in the figure. Consecutively, 200 TAVI patients were enrolled. The aim of the study was to find out LV Mechanical dispersion (MeDi) by speckle tracking echocardiography can predict the patients who will need permanent pacemaker (PM) implantation after TAVI. Echocardiography and electrocardiography examinations were recorded the day before TAVI and analysed for the outcome of PM implantation. MeDi and right bundle branch abnormality (RBBB) predicted PM implantation after TAVI. The RBBB and MeDi compound model for prediction had a better predictive value for PM implantation after TAVI.
Introduction
Aortic stenosis (AS) is a prevalent heart valve disease.1,2 The aging population and expanding indication of intervention towards low-risk patients pose challenges to managing AS and treatment complications. AS develops slowly and ensures the left ventricle (LV) to adapt pressure overload in time. However, excessive adaptive remodelling can lead to irreversible changes, including myocardial fibrosis. Fibrosis can result in diastolic and systolic dysfunction and create a substrate for arrytmogenicity.3
Transcatheter aortic valve implantation (TAVI) is the preferred treatment for AS in the elderly. Despite improvement in procedural success and suitability of the prosthetic valve types, there is still a need for permanent pacemaker (PM) implantation, primarily due to complete atrioventricular block (AVB). AVB incidence after TAVI ranges from 2.3 to 36.1%.4–8 Mechanism underlying AVB after TAVI is primarily the direct mechanical effect on conduction system due to anatomical proximity of AV node and His bundle. Several predictors of AVB after TAVI have been identified.9
AS itself contributes to conduction disturbances like syncope, heart blocks, and sudden cardiac death. Therefore, the severity of AS and systolic dysfunction are other potential suspected mechanisms of the need for PM implantation after TAVI. Mechanical stress from long-term pressure overload can cause fibrosis in the conduction system and myocardium. A study, conducted long before TAVI was utilized, showed that reduced aortic valve area (AVA) was a predictor of His-ventricular interval prolongation.10 A more recent study showed that 6% of AS patients had AVB in 24-h electrocardiography (ECG) monitoring before TAVI, and nearly one-third of those who received PM had AVB before TAVI.11
Speckle tracking echocardiography (STE) assesses myocardial function, including LV mechanical dispersion (MeDi). MeDi reflects heterogeneity of myocardial contraction and correlates with myocardial fibrosis.12 A recent study from our group demonstrated prognostic value of MeDi in AS patients.3 Additionally, MeDi increases with the severity of AS.13
We hypothesize that a detailed analysis of myocardial contraction pattern can reveal underlying mechanism, and that MeDi is a predictor of PM need after TAVI.
Methods
Study design and population
This prospective, observational study was conducted at Oslo University Hospital, Rikshospitalet. Between February 2021 and January 2022, consecutive patients hospitalized for elective TAVI were included. Patients with previous PM, intra-cardiac defibrillator or valve intervention were excluded. Medical history, New York Heart Association (NYHA) functional status, physical examination information, and medications were recorded from patient charts. Coronary artery disease (CAD) was defined as previous history of myocardial infarction, coronary intervention, or evidence of stenosis in epicardial coronary arteries (≥50% diameter stenosis). The study was approved by the Regional Committee for Medical Research Ethics, and written informed consent was obtained from all patients.
ECG
A 12-lead ECG was recorded at the time of transthoracic echocardiography, to obtain rhythm, heart rate, bundle branch abnormality (BBB) information, and automatic measurements of PR interval, QRS, and QTc durations. Diagnosis of BBB morphology was made according to current recommendations.14
Echocardiography
All patients underwent a comprehensive transthoracic echocardiography the day before TAVI with a Vivid E95 Ultrasound scanner (GE Healthcare, Horten, Norway). An experienced physician performed and analysed the echocardiographic recordings according to current recommendations,1,15 using EchoPAC Software (GE Healthcare). A left ventricular outflow tract (LVOT) diameter measurement was performed from zoomed parasternal long-axis view. From apical five-chamber view, pulsed-wave Doppler in LVOT and continuous-wave Doppler of the aortic valve recordings were performed to calculate AVA by the continuity equation.16 Global longitudinal strain (GLS) was assessed using STE, averaging peak negative systolic strain values from apical four-chamber, two-chamber, and long-axis views. MeDi was automatically calculated by the software as the standard deviation (SD) of the durations from the start of QRS in ECG to the peak negative longitudinal strain in an 18-segment model17 (Figure 1). In atrial fibrillation (AF) patients, multibeat loops with the most compatible RR intervals from apical four-chamber, two-chamber, and apical long-axis views were selected for MeDi calculation. A randomly selected sample consisting of echocardiographic recordings from 37 patients (20%) were reanalysed to assess intra-observer and inter-observer variability.
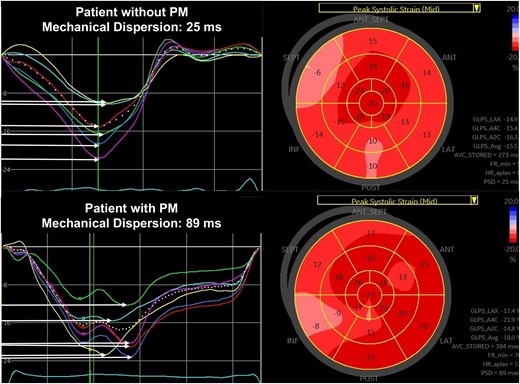
LV MeDi analysis by STE. MeDi is the SD of contraction durations from QRS peak in ECG to peak systolic strain. Horizontal arrows indicate contraction durations in each segment, and MeDi is shown as ‘Peak strain dispersion (PSD)’ in bulls-eye plot of peak systolic strain. Upper panel: normal MeDi in a patient without the need for PM. Lower panel: prolonged MeDi in a patient in need for PM after TAVI.
Procedural information
TAVI was performed under conscious sedation using Edwards SAPIEN 3 Ultra (n = 140), Edwards SAPIEN 3 (n = 6), and Evolut PRO (n = 39) bioprosthetic valves from Edwards Lifesciences (Orange County, CA, USA) and Medtronic (Minneapolis, MN, USA). Balloon-expandable valves were deployed using rapid right ventricular pacing at 180 b.p.m., while self-expandable valves were deployed without pacing or under 120 b.p.m. pacing. Procedure reports provided data on valve type, size, post-dilatation, and complications.
Evaluation of conduction disturbances and PM implantation
All patients received temporary PM before the procedure and monitored for conduction disturbances after TAVI. Complete or second-degree, Mobitz type II AVB, slow conduction AF, and sick sinus syndrome were indications for PM implantation. If the need for PM occurred within the first 24 h, patients received PM at our hospital. After 24 h, the patients were transferred to local hospitals for further observation or home, based on patient preference, and PM implantation was handled at local hospitals if necessary. By telephone interviews 3 months after TAVI, PM implantation and NYHA class data were collected and confirmed with the hospital database or with the family doctor of the patients, when patients failed to provide clear information.
Statistical analyses
Continuous variables were expressed as mean ± SD. Categorical variables were expressed as numbers and percentages. Differences between groups were assessed using Student’s t-test and the χ2 or Fisher’s exact test. Post hoc comparisons using the Bonferroni method are used to compare different levels of BBB between groups. Univariable logistic regression analysis was used to assess the markers of PM implantation after TAVI. Variables known to influence PM implantation after TAVI were included in the analysis. Multiple regression analysis was performed to assess independent relationship of the variables with PM implantation. Results were presented as odds ratios (OR) with 95% confidence intervals (CI). Receiver operating characteristic (ROC) curve was drawn, and area under the curve (AUC) was calculated for MeDi and RBBB. The points closest to the upper left corners of the ROC curves identified optimal sensitivity and specificity for the predictive values of MeDi and RBBB over PM need after TAVI. Intra- and inter-observer variability was evaluated with the Bland–Altman analysis. All tests were two-tailed, and P < 0.05 was considered to be statistically significant. Analyses were performed using SPSS version 23.0 (SPSS Inc., Chicago, IL, USA). STATA SE 16.0 (StataCorp LLC, College Station, TX) was used for building a model for the prediction of PM implantation with RBBB and MeDi as c-statistics, net reclassification improvement (NRI), and integrated discrimination improvement (IDI) analysis.
Results
Clinical and echocardiographic characteristics
Two hundred consecutive TAVI patients were recruited for the study. After excluding 15 patients with poor image quality, final analyses encomprised 185 patients (age 80 ± 7 years, 44% female). Pre-TAVI NYHA class was 2.5 ± 0.6. Baseline characteristics are summarized in Table 1. Twenty-nine patients (16%) received PM. Median time to PM implantation was 6 days (1–72 days). In total, 79% patients were in sinus rhythm pre-TAVI, and 23% of these had first-degree AVB. In 38 patients (21%), PR interval was indeterminable due to AF. Left BBB (LBBB) was the most common BBB (11%), followed by RBBB (8%), but 68% had no BBB. Mean QRS duration was 106 ± 22 ms (Table 2). As seen in Table 3, LV ejection fraction (LVEF) was 57 ± 11%, AVA 0.8 ± 0.2 cm2, transaortic pressure gradient 45 ± 13 mmHg, GLS 16 ± 4%, and MeDi 49 ± 13 ms.
Baseline characteristics
| Variable | PM | No PM | Total | P value |
|---|---|---|---|---|
| n = 29 (15.7%) | n = 156 (84.3%) | n = 185 | ||
| Baseline characteristics | ||||
| Age | 81.5 ± 7 | 80.1 ± 7.3 | 80.4 ± 7.2 | 0.32 |
| Gender, female (n, %) | 11 (37.9%) | 70 (44.9%) | 81 (43.8%) | 0.48 |
| BMI (kg/m2) | 25 ± 5.7 | 27 ± 4.8 | 26.7 ± 5 | 0.03 |
| NYHA—before TAVI | 2.6 ± 0.5 | 2.4 ± 0.6 | 2.5 ± 0.6 | 0.23 |
| DM (n, %) | 3 (10%) | 32 (21%) | 35 (19%) | 0.19 |
| HT (n, %) | 16 (55%) | 108 (70%) | 124 (67%) | 0.12 |
| CAD (n, %) | 10 (34.5%) | 70 (45.2%) | 80 (43.2%) | 0.16 |
| CKF (n, %) | 7 (24.1%) | 22(14.2%) | 29(15.7%) | 0.17 |
| Medications—before TAVI | ||||
| ASA (n, %) | 16 (56%) | 86 (55%) | 102 (55.1%) | 0.94 |
| OAC (n, %) | 12 (41.4%) | 55 (35.5%) | 67 (36.4%) | 0.53 |
| Beta-blocker (n, %) | 11 (38%) | 68 (44.2%) | 79 (43.2%) | 0.53 |
| ACEI (n, %) | 6 (21.4%) | 28 (18%) | 34 (18.6%) | 0.67 |
| ARB (n, %) | 12 (41.4%) | 61 (39%) | 74 (39.5%) | 0.81 |
| CCB (n, %) | 8 (27.6%) | 41(26.5%) | 49 (26.6%) | 0.89 |
ACEI, angiotensin converting enzyme inhibitor; ARB, angiotensin receptor blocker; ASA, acetylsalicylic acid; BMI, body mass index; CAD, coronary artery disease; CCB, calcium channel blocker; CKF, chronic kidney failure; DM, diabetes mellitus; HT, hypertension; OAC, oral anticoagulant; NYHA, New York Heart Association; OSAS, obstructive sleep apnoea syndrome.
Comparison of ECG characteristics
| Variable | PM | No PM | Total | P value |
|---|---|---|---|---|
| n = 29 (15.7%) | n = 156 (84.3%) | n = 185 | ||
| Rhythm | 1.00 | |||
| Sinus rhythm | 23 (79.3%) | 123 (78.8%) | 146 (79%) | |
| Atrial fibrillation | 6 (20.5%) | 32 (20.5%) | 38 (20.5%) | |
| First-degree AVB | 11/23 (47.8%) | 23/123 (18.7%) | 34/146 (23%) | 0.002 |
| Heart rate (ppm) | 68 ± 14 | 68 ± 11 | 68 ± 11 | 0.75 |
| PR interval (ms) | 195 ± 43 | 184 ± 37 | 186 ± 38.5 | 0.21 |
| QRS interval (ms) | 117 ± 30 | 104 ± 20 | 106.2 ± 22.5 | 0.01 |
| QTC interval (ms) | 411 ± 78 | 414 ± 49 | 414 ± 54 | 0.71 |
| BBB | 0.02a | |||
| No BBB | 16 (55.2%) | 111 (71.2%) | 127 (68.6%) | |
| LBBB | 3 (10.3%) | 18 (11.5%) | 21 (11.4%) | |
| RBBBa | 8 (27.6%) | 7 (4.5%) | 15 (8.1%) | |
| ILBBB | 1 (3.4%) | 7 (4.5%) | 8 (4.3%) | |
| IRBBB | 0 (0%) | 5 (3.2%) | 5 (2.7%) | |
| LAFB | 1 (3.4%) | 3 (1.9%) | 4 (2.2%) | |
| LPFB | 0 (0%) | 4 (2.6%) | 4 (2.2%) | |
Bold values refer to statistical significance.
BBB, bundle branch abnormality; LBBB, left BBB; RBBB, right BBB; ILBBB, incomplete LBBB; IRBBB, incomplete right bundle branch abnormality; LAFB, left anterior fascicular block; LPFB, left posterior fascicular block.
aRBBB is significantly different between groups according to Bonferroni analysis.
Echocardiographic characteristics
| Variable | PM | No PM | Total | P value |
|---|---|---|---|---|
| n = 29 (15.7%) | n = 156 (84.3%) | n = 185 | ||
| IVS (mm) | 14.5 ± 2.1 | 14.8 ± 2.6 | 14.7 ± 2.5 | 0.52 |
| PW (mm) | 11.8 ± 1.8 | 11.6 ± 2 | 11.6 ± 2 | 0.68 |
| LVEDD (mm) | 47.8 ± 6.8 | 47 ± 6.7 | 47 ± 6.7 | 0.54 |
| LVESD (mm) | 32.6 ± 10 | 31 ± 8 | 31.1 ± 8.3 | 0.30 |
| LVOTd (mm) | 21 ± 1.8 | 21.3 ± 2.3 | 21.2 ± 2.2 | 0.65 |
| LVMi (g/m2) | 127 ± 26 | 129 ± 36 | 129 ± 34.6 | 0.71 |
| LVEF (%) | 56 ± 14 | 57.7 ± 10.5 | 57.4 ± 11 | 0.52 |
| CO (L) | 5.6 ± 1.6 | 5.3 ± 1.5 | 5.3 ± 1.5 | 0.35 |
| SV (mL) | 83.1 ± 29.2 | 79.4 ± 23.4 | 80 ± 24.4 | 0.45 |
| SVi (mL/m2) | 43.6 ± 15 | 41.9 ± 12.2 | 42.2 ± 12.7 | 0.55 |
| AVA (cm2) | 0.8 ± 0.2 | 0.8 ± 0.2 | 0.8 ± 0.2 | 0.29 |
| AVAi (cm2/m2) | 0.4 ± 0.1 | 0.4 ± 0.1 | 0.4 ± 0.1 | 0.19 |
| Max AoPG (mmHg) | 66 ± 18 | 72 ± 19 | 71 ± 19 | 0.16 |
| Mean AoPG (mmHg) | 43 ± 13 | 45 ± 13 | 45 ± 13 | 0.13 |
| GLS (%)a | 16 ± 4.7 | 16.5 ± 4.3 | 16.4 ± 4.4 | 0.48 |
| MeDi (ms) | 57 ± 15 | 48 ± 12 | 49 ± 13 | <0.001 |
Bold values refer to statistical significance.
AoPG, transvalvular aortic pressure gradient; AVA, aortic valve area; AVAi, indexed aortic valve area; CO, cardiac output; GLS, global longitudinal strain; IVS, interventricular septum; LVEDD, left ventricular end-diastolic diameter; LVEF, left ventricular ejection fraction; LVESD, left ventricular end-systolic diameter; LVMi, left ventricular mass index; LVOTd, left ventricular outflow tract diameter; MeDi, mechanical dispersion; PW, posterior wall; SV, stroke volume; SVi, stroke volume index.
aGLS is expressed as absolute value.
Comparison between PM and no PM groups
There were no differences between patient groups regarding age, sex, medical history, or medications (Table 1), nor in LV diameters, function, or AS severity (Table 3). MeDi was higher in the PM group, but GLS was similar between groups (Figure 2). In pre-TAVI ECGs, incidence of AF was similar between groups. First-degree AVB and RBBB were significantly more prevalent in the PM group, but there was no significant difference regarding other BBB types. QRS duration was longer in the PM group (Figure 3). Prosthetic valve type, size, or post-dilatation after valve deployment did not differ between the groups (Table 4). Three months after TAVI, heart failure symptoms were improved in the whole cohort (NYHA class: 1.4 ± 0.6) but less improved in PM patients compared to no PM patients (Figure 4).
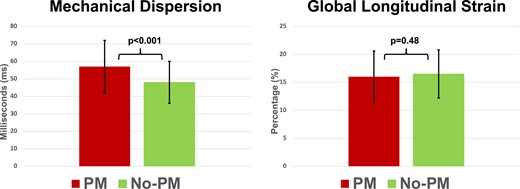
Comparison of PM and no PM groups for echocardiographic parameters. Left panel: MeDi is higher in patients in need for PM. Right panel: no differences in GLS (expressed as absolute % values) are seen.
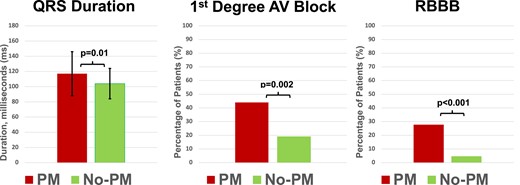
Comparison of PM and no PM groups for electrocardiographic parameters. Left panel: pre-TAVI mean QRS duration is significantly longer in the PM group compared to no PM group. Mid panel: pre-TAVI first-degree AVB is significantly more frequent in patients in need for PM. Right panel: RBBB is significantly more frequent in the PM group.

NYHA functional class, before and after TAVI in PM and no PM groups. NYHA improved less in patients who received PM after TAVI.
Comparison of operational characteristics
| Variable | PM | No PM | Total | P value |
|---|---|---|---|---|
| n = 29 (15.7%) | n = 156 (84.3%) | n = 185 | ||
| Valve type | 0.49 | |||
| Evolut PRO | 6 (20.7%) | 33 (21.2%) | 39 (21.1%) | |
| Sapien 3 Ultra | 21 (72.4%) | 118 (75.6%) | 139 (75.1%) | |
| Sapien 3 | 2 (6.9%) | 4 (2.6%) | 6 (3.2%) | |
| Valve size | 26.7 ± 2 | 26.4 ± 2.6 | 26.5 ± 2.5 | 0.60 |
| Post-dilatation | 5 (17.2%) | 24 (15.5%) | 29 (15.7%) | 0.81 |
Predictors of PM implantation after TAVI
In univariate logistic regression analysis, RBBB, MeDi, and QRS duration were associated with PM implantation after TAVI, opposed to PR interval prolongation and GLS. In multivariable logistic regression analysis, MeDi and RBBB independently predicted the need for PM and higher MeDi indicated higher risk (Table 5). With ROC curves, AUC for MeDi was 0.68 and AUC for RBBB was 0.61. A compound predictive model for RBBB and MeDi was built, and AUC was 0.73, explaining that MeDi had an incremental value for the prediction of PM need (P = 0.01; Figure 5). Adding MeDi to RBBB improved reclassification of subsequent PM implantation (NRI 0.45, P = 0.02 and IDI 0.06, P = 0.006) demonstrating the value of combining these parameters. MeDi ≥ 54 ms optimally predicted PM implantation after TAVI with sensitivity of 62% and specificity of 67%. A value of MeDi < 32 ms predicted no need of PM with sensitivity 100% and specificity 90%.
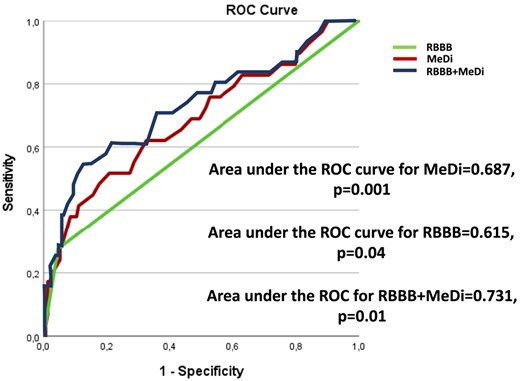
ROC curves and area under for MeDi, RBBB, and the compound model RBBB + MeDi.
Logistic regression analysis showing the outcome of PM implantation in patients after TAVI
| Univariate | Multivariate | |||||
|---|---|---|---|---|---|---|
| OR | 95% CI | P value | OR | 95% CI | P value | |
| RBBB | 8.1 | 2.66–24.66 | <0.001 | 8.98 | 1.78–45.03 | 0.008 |
| PR interval, 10 ms | 1.06 | 0.96–1.18 | 0.21 | |||
| QRS duration, 10 ms | 1.26 | 1.07–1.47 | 0.004 | 0.99 | 0.97–1.02 | 0.90 |
| GLS, % | 0.97 | 0.88–1.06 | 0.48 | |||
| MeDi, 10 ms | 1.68 | 1.23–2.30 | 0.001 | 1.73 | 1.22–2.45 | 0.002 |
Bold values refer to statistical significance.
GLS, global longitudinal strain; MeDi, mechanical dispersion; RBBB, right bundle branch abnormality.
Intra-observer and inter-observer reliability
Intra- and inter-observer reliability for MeDi determined by Bland–Altman plots and linear regression analyses showed a small variability with no systematic bias (Figure 6).
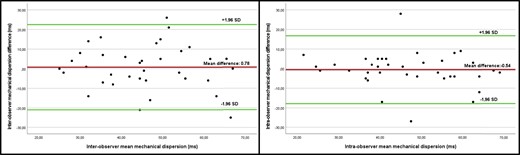
Bland–Altman analysis for inter-observer and intra-observer reliability, demonstrating small variability with no sign of proportional bias.
Discussion
Our main finding is that MeDi was higher in patients in need for PM compared to the patients without need for PM after TAVI. MeDi and RBBB were independent predictors of the need for PM after TAVI, and MeDi had incremental value over RBBB for prediction.
MeDi as a predictor of PM implantation
MeDi ≥ 54 ms predicted PM implantation after TAVI with the highest precision. None of the patients with MeDi <32 ms received PM. Previous studies have shown the upper normal limit for LV MeDi as 35 ms.18 Therefore, a normal value indicates a very low risk of needing PM after TAVI.
Despite finding lower levels than other studies,5–19 MeDi is still an independent predictor of PM implantation in our study. Lower levels may be attributed to early referral of lower risk patients to TAVI at slightly younger age, larger AVA, and lower transvalvular pressure gradient. Since MeDi is correlated to fibrosis, shorter duration of exposure to conditions triggering maladaptive changes and potentially lesser degree of fibrosis in myocardium can explain the pathophysiology.
It was previously shown that MeDi has incremental prognostic value over LVEF in AS patients.3,13 Our study demonstrates the superiority of MeDi over GLS in predicting the need for PM after TAVI. Furthermore, we found that MeDi provides additional predictive value compared with RBBB. MeDi reflects myocardial contraction heterogeneity; fibrosis can cause regional differences in conduction, thus manifesting as a prolongation of MeDi. We did not observe a common, segmental contraction pattern in patients who received PM. This supports our hypothesis that the need for PM implantation might also be a result of the fibrosis in the conduction system instead of a clear pathology in one location. Currently, no functional echocardiographic parameter is defined for predicting PM implantation after TAVI.10 Therefore, calculating MeDi may be a useful tool in these patients. Further studies with improved design are needed to validate this finding and potentially incorporate MeDi as a functional echocardiographic predictor in guidelines for risk assessment of PM requirement.
Clinical implications
We found that MeDi lower than 32 ms indicated a very low risk of the need for PM after TAVI. This suggests that temporary PM during the procedure can be avoided, thus reducing patients’ risk, shortening the procedural time, and reducing costs. However, this should be tested in a randomized study.
At 3-month follow-up, patients who received PM showed less improvement in NYHA (Figure 4). Thus, avoidance of PM implantation after TAVI is clinically important. This should be taken into consideration when to treat an asymptomatic patient or a patient with borderline-severe AS. In addition, if MeDi increases in a patient, this may indicate increasing fibrosis in the myocardium and an increased risk in the need for PM suggesting an earlier intervention on the valve. However, this hypothesis requires further evaluation.
In our study, MeDi was the best predictor in the need for PM. This is of clinical importance, but still no single or combination of parameters can justify pre-procedural PM.
Other predictors of PM implantation
In univariate analysis, QRS duration was higher in the PM group and associated with PM implantation after TAVI. However, in multivariate analysis, QRS duration did not predict PM implantation, which is consistent with other studies.20 In contrast, MeDi independently predicted AVB, regardless of QRS duration. RBBB in pre-TAVI ECG was identified as a predictor of PM implantation, consistent with its well-known association with AVB following TAVI.8
A large meta-analysis with over 11 000 TAVI patients found that first-degree AVB predicted AVB after TAVI.8 Similarly, two recent studies showed that PR duration predicted delayed AVB.21,22 However, in our study, although first-degree AVB was more common in the PM group, it was not a risk factor for PM after TAVI and nor was PR duration. This may be attributed to our study involving patients referred to TAVI earlier, with lower disease severity and comorbidity compared with early phases of TAVI.
Clinical consequences related to PM implantation
Conduction disturbances that require PM implantation are still a major concern after TAVI. We found that 16% of the patients who underwent TAVI needed permanent PM therapy. This finding is in accordance with previous findings.4–8 Although we did not evaluate conduction disturbances with long-term rhythm monitoring, we reached out to 100% of the patients 3 months after TAVI. Therefore, we believe the incidence found in our study is a representative of true incidence of PM implantation after TAVI.
There are studies indicating an increased risk in mortality and morbidity in patients with PM after TAVI.8,23 Three patients (1.6%) died within 30 days after TAVI, but none of those patients were in the PM group. Generally, symptoms improved after TAVI in the whole cohort. However, interestingly, the NYHA class after TAVI was worse in patients receiving PM compared to the patients who did not. The worse functional class in PM patients indicates that even though conduction disturbances after TAVI are well managed, we fail to increase the quality of life as much as the counterparts of the patients who did not receive PM. Dyssynchrony caused by PM implantation after TAVI may be the underlying mechanism of this lesser improvement.
We found no difference between groups regarding self-expandable or balloon-expandable valve type contrary to the well-known increased AVB risk in self-expandable valves. Almost 80% of our patients received balloon-expandable valves. Ream et al.7 reported that patients with AVB were more likely to receive self-expandable valve; however, similar to our study, in multivariate analysis, they failed to show the association of self-expandable valve and AVB after TAVI.
Time to PM implantation in our study is median 6 days. Only 24% of the patients received PM during the first 48 h. Similar data vary in other studies, and in a comprehensive review, 60–96% of PM implantations occurred in 24 h of TAVI.24 It has also been shown that up to 30% of the patients can have delayed AVB after TAVI.4,6,7 In a register study, patient’s median time from TAVI to PM implantation was 3 days.24 The difference between our study and these reports may arise from delayed conduction disturbances or delayed permanent PM implantation, as patients underwent watchful waiting with temporary PM during transfer to local hospitals.
Limitations
This single-centre observational study is subject to inherent bias, but the consecutive inclusion of patients reflects real-world cardiology practice. Choice of valve type and deployment depth, which can impact the occurrence of conduction disturbances after TAVI, were under the discretion of the operator. However, the operator was unaware of the dispersion data, enhancing study’s strength. Median time to permanent PM implantation may not precisely reflect the timing of AVB or related conduction disturbances, as patients may have experienced delays in transferring to local hospitals or receiving PM. Furthermore, all patients received PM in short term after TAVI, and data on the long-term risk of requiring PM are lacking. The percentage of pacing after 3 months were not available, but it would provide additional insight regarding the mechanism of acute electrical blockage. However, as these patients already experienced a severe event necessitating PM, low PM activity after 3 months does not affect the need for PM.
Conclusion
MeDi was significantly higher in patients who needed PM after TAVI compared to the patients without PM. Furthermore, MeDi and RBBB were independent predictors of PM implantation after TAVI, and MeDi enhances the prediction when combined with RBBB. Based on our findings, additional studies should be performed to evaluate if avoiding PM implantation in patients with normal MeDi, early hospital discharge, or a better strategy for selection of prosthetic valves may be advocated.
Funding
This work was supported by the European Association of Cardiovascular Imaging Research Grant for the year 2020.
Data availability
The data underlying this article cannot be shared publicly for the privacy of individuals that participated in the study. The data will be shared upon reasonable request to the corresponding author.
References
Author notes
Conflict of interest: None declared.
