


Abstract
Right ventricular (RV) performance determines clinical management in severe tricuspid regurgitation (TR). Right atrial (RA) function complements RV assessment in TR. This study aimed to design a novel index by speckle-tracking echocardiography (STREI index) integrating RA and RV strain information and to evaluate the clinical utility of combining RV and RA strain for prediction of cardiovascular (CV) outcomes.
Consecutive patients with at least (≥) severe TR evaluated in the Heart Valve Clinic (n = 300) were prospectively included. An additional independent TR cohort was included for external validation (n = 50). STREI index was developed with the formula: [2 ∗ RV-free wall longitudinal strain (RV-FWLS)] + reservoir RA strain (RASr). The composite endpoint included hospital admission due to heart failure and all-cause mortality. A total of 176 patients with ≥severe TR were finally included. STREI index identified a higher percentage of patients with RV dysfunction compared with conventional parameters. After a median follow-up of 2.2 years (interquartile range: 12–41 months), a total of 38% reached the composite endpoint. STREI values were predictors of outcomes independently of TR severity and RV dimensions. The combination of prognostic cut-off values of RASr (<10%) and RV-FWLS (>−20%) (STREI stratification) stratified four different groups of risk independently of TR severity, RV dimensions, and clinical status (adj HR per stratum 1.89 (1.4–2.34), P < 0.001). Pre-defined cut-off values achieved similar prognostic performance in the validation cohort (n = 50).
STREI index is a novel parameter of RV performance that independently predicts CV events. The combination of RA and RV strain stratifies better patients’ risk, reflecting a broader effect of TR on right heart chambers.
Introduction
Current clinical management of severe tricuspid regurgitation (TR) is determined by the presence of symptoms and the progressive impairment of right ventricular (RV) performance.1–5 Despite the increasing awareness of its detrimental impact on long-term survival, strong evidence to support tricuspid valve (TV) intervention is still lacking.6,7 Appropriate timing of intervention is crucial to improve patients’ outcomes; however it is commonly recommended at advances stages of the TV disease.4,5 Beyond symptoms, RV performance is a major prognostic determinant and stratifies risk in TR patients.4,5,8–12 In cases of RV dysfunction, mortality may range up to 50% at 5 years;8 however, thresholds for RV making intervention futile and guide intervention have not yet been defined. Current guidelines recommend valve intervention in symptomatic patients or in asymptomatics when there is RV dilatation or declining RV function.4,5 However, robust evidence in this scenario is scarce and the level of indication is still low. There is an urgent need for a more comprehensive evaluation and earlier intervention in TR.
The evaluation of RV performance in patients with severe TR is particularly challenging. RV assessment by two-dimensional (2D) transthoracic echocardiography (TTE) is commonly challenged by RV shape and position. In TR, traditional RV parameters such as tricuspid annular plane systolic excursion (TAPSE) and fractional area change (FAC) may be overestimated due to increased preload conditions, failing to detect RV dysfunction at early stages.4,5,13
Speckle-tracking echocardiography (STE) evaluates RV and right atrium (RA) function by quantifying the myocardial active shortening of both RV and RA throughout the cardiac cycle.10,12,14–16 STE overcomes some of the limitation of traditional RV indices; it is independent of imaging angles and less influenced by preload conditions.4 Recently, a previous study has shown that in early stages of TR, RV-free wall longitudinal strain (RV-FWLS) is more sensitive in detecting RV dysfunction and superior in terms of outcomes prediction compared with traditional RV parameters.10 Furthermore, right atrial strain in TR has just proved to be feasible, reproducible, and carry prognostic information.15,16
Potentially, an index that integrates RV and RA information may provide a more accurate assessment of the impact of TR on right heart function and may have the ability to detect earlier patients who may benefit from valve intervention.17 The traditional TEI index combines systolic and diastolic function, but its clinical value has been restricted mainly in the setting of pulmonary hypertension. Its application in TR is limited and not performed in clinical routine due to intrinsic inaccuracies, such as highly dependency of load conditions, and inaccurate isovolumic periods due to high RA pressures.
The aims of this study were: (i) to design a novel index by speckle-tracking echocardiography (STREI index) integrating RA and RV strain information; and (ii) to evaluate the incremental utility (over clinical parameters and conventional indices of RV function) of combing RV and RA strain in the prediction of CV outcomes in at least severe TR patients.
Methods
Study design and patients
Consecutive patients with isolated ≥severe TR evaluated in the Heart Valve Clinic from were prospectively included in this observational study. A subset of the patient population had previously been evaluated in previous studies by our group.10,15 Subjects were excluded if they had prior documented admissions due to heart failure (HF), significant (>mild) untreated left heart valve disease, primary RV cardiomyopathies, previous RV infarction, or congenital heart disease.
The patients’ selection flowchart is presented in Figure 1. After excluding the patients who met the exclusion criteria or had incomplete clinical or poor imaging data, a final cohort of 176 patients was included in this study.
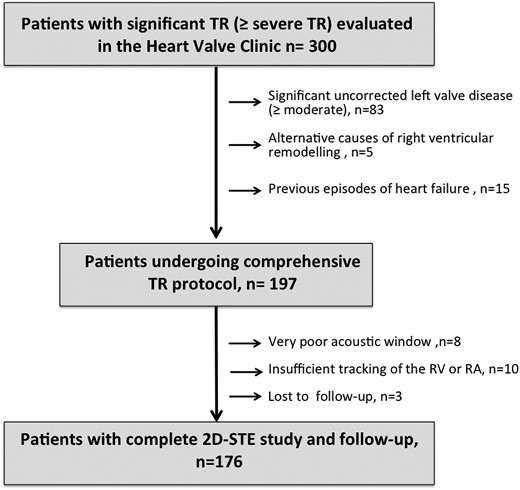
Diagram for patients’ selection.
An additional independent cohort of 50 patients with ≥severe TR fulfilling the above inclusion criteria was sourced from a large-scale TR cohort for prospective validation.4
Clinical, demographic, and comprehensive biochemical data were recorded for all subjects. The New York Heart Association (NYHA) class was used to assess the baseline functional status.
Two additional cohorts without history of cardiac disease were included to provide comparative STREI values: a control group (n = 20) of healthy subjects and normal echocardiographic findings (normal chamber size and biventricular function) and an AF group (n = 20) that included patients in permanent AF with both atrium dilated, normal biventricular function, and no significant valve disease.
The study protocol was reviewed and received ethical approval from the institutional ethics committees. All patients provided written informed consent to participate in the study. The execution of all procedures adhered strictly to the guidelines and principles stipulated in the Declaration of Helsinki (2000).
Echocardiography
All subjects underwent a comprehensive echocardiogram study using a commercially available ultrasound system (EPIQ system, Philips Medical Systems, Andover, MA, USA). The imaging protocol included parasternal, four-, two-, and three-chamber views, RV-focused and subcostal views to acquire two-dimensional, colour, pulsed, and continuous-wave Doppler data following the current guidelines.13,18 All images were digitally stored, and subsequent analysis was conducted offline. Details of chamber quantification are included in Supplementary data online, Material.
The severity of TR was defined based on the new grading scheme.18,19 The aetiology of TR was classified into four primary categories: primary or organic TR, secondary atrial TR, secondary ventricular TR, and TR related to cardiac implantable electronic devices (CIEDs) (Supplementary data online).20
Strain analysis
Atrial and ventricular strain analysis were performed using an automated 2D analytical software as reported previously (AutoStrain, Philips Medical Systems)15 (Figure 2). The software utilizes an artificial intelligence algorithm to automatically identify the endocardial border and performs speckle-tracking analysis across a complete cardiac cycle. Details of strain post-processing analysis are including in the Supplementary data online, Material.
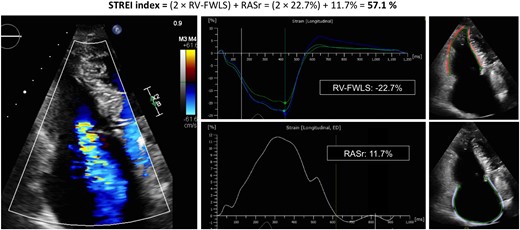
Representative case of STREI calculation in a patient with severe TR.
Novel STREI index was calculated based on biological plausibility and the relative prognostic weight of each abnormal strain value in multivariable Cox regression analysis.15 Based on Cox regression results, STREI index was developed with the formula: [2 ∗ RV-free wall longitudinal strain (RV-FWLS)] + reservoir RA strain (RASr) in absolute numbers. In addition, to develop a simplified novel risk stratification algorithm of right performance (STREI stratification), continuous RV and RA strain variables were dichotomized (above/below prognostic thresholds for both RASr and RV-FWLS).
In patients in AF, measurements were derived as the average of three cardiac cycles. All measures were performed by cardiologists with an expertise on cardiac imaging (R.H. and C.F.-G.) who were blinded to patient’s outcomes.
Outcomes and follow-up
The composite endpoint included hospital admission due to HF and all-cause mortality at follow-up. Clinical data were prospectively collected through direct communication with the patients and from hospital records in the Heart Valve Clinic.
Statistical analysis
The Kolmogorov–Smirnov test assessed the normality of data. Categorical variables were presented as percentages and compared using the χ2. Continuous variables were expressed as mean ± standard deviation or median (interquartile range). Student’s t-test was employed to compare normally distributed variables, and Mann–Whitney U test for not-normally distributed variables. The independent associations with the outcome were tested with multivariable Cox analysis using a forward selection [likelihood ratio (LR)] approach and including variables with a P-value of <0.05. The rule of thumb for logistic and Cox models suggesting a minimum of 10 events per predictor variable was applied.
Three models were pre-defined testing different variables of RV performance: RV-FWLS and RASr in Model 1; STREI index in Model 2, and STREI stratification in Model 3 in addition to indices of TR severity, RV size, and function (simulating a clinical scenario) and adjusted by TV intervention and TR velocity. The model with the highest predictive capacity and best goodness of fit was determined by evaluating the Harrell’s C index and the Akaike information criterion (AIC). Proportional hazard assumption was tested and verified. AIC was applied to determine the strongest variable of TR severity, RV dimensions, and RV function associated with outcomes. Multi co-linearity was avoided by low variance inflation factor (<2). The Kaplan–Meier method and the log-rank test estimated event distributions and compared cumulative event rates, respectively. Reproducibility of STREI values were evaluated in 30 randomly selected subjects (20 TR + 5 AF + 5 controls) by two cardiologists (R.H. and C.F.-G.), and was expressed by inter/intraobserver variability intraclass correlation coefficients (ICC).
A two-tailed was applied for all tests and a P-value of <0.05 was considered statistically significant.
The statistical analyses were performed using SPSS (version 21.0; SPSS, Chicago, IL, USA) and Stata Statistical Software (version 14.1, Stata Corporation, College Station, TX, USA).
Results
Table 1 shows demographic data and baseline characteristics of TR patients. Most of TR patients were females (70%) with a mean age of 76 ± 9 years. Regarding the aetiology, 10% had primary TR, 4% CIED-related TR, 40% functional atrial TR, and 46% functional ventricular TR.
Demographic and clinical characteristics in all patients and comparisons between patients with and without events
| Variable | All patients n = 176 | Patients with events. n = 67 | Patients without events. n = 109 | P-value |
|---|---|---|---|---|
| Age. years | 76 ± 9 | 78 ± 8 | 76 ± 9 | 0.43 |
| Female. n (%) | 123 (70) | 41 (61) | 82 (75) | 0.03 |
| Type 2 diabetes mellitus, n (%) | 27 (15) | 12 (18) | 13 (12) | 0.13 |
| Hypertension, n (%) | 82 (46) | 31 (46) | 51 (47) | 0.99 |
| Hypercholesterolaemia, n (%) | 72 (41) | 28 (42) | 44 (40) | 0.75 |
| Smoker, n (%) | 13 (7) | 7 (10) | 6 (6) | 0.23 |
| Atrial fibrillation, n (%) | 141 (80) | 59 (88) | 82 (75) | 0.08 |
| Coronary artery disease, n (%) | 15 (8) | 7 (10) | 8 (7) | 0.42 |
| COPD or asthma, n (%) | 18 (10) | 10 (15) | 8 (7) | 0.07 |
| Renal disease, n (%) | 28 (16) | 16 (24) | 12 (11) | 0.06 |
| Previous left valve surgery (mitral or aortic), n (%) | 59 (33) | 23 (34) | 36 (33) | 0.87 |
| Previous left valve surgery with tricuspid annuloplasty, n (%) | 16 (9) | 8 (12) | 8 (7) | 0.21 |
| Pacemaker carriers, n (%) | 38 (22) | 15 (22) | 23 (21) | 0.84 |
| TR aetiology | 0.36 | |||
| 1. Primary TR, n (%) | 17 (10) | 6 (9) | 11 (10) | |
| 2. CEID-related TR, n (%) | 8 (4) | 1 (2) | 7 (6) | |
| 3. Functional TR, n (%) | ||||
| A. Atrial TR, n (%) | 70 (40) | 27 (40) | 43 (39) | |
| B. Ventricular TR, n (%) | 81 (46) | 33 (49) | 48 (44) | |
| NYHA class, n (%) | 0.001 | |||
| I/II, n (%) | 149 (85) | 50 (75) | 99 (91) | |
| III, n (%) | 27 (15) | 17 (25) | 10 (9) | |
| IV, n (%) | 0 (0) | 0 (0) | 0 (0) | |
| Diuretic treatment | 0.08 | |||
| Number of diuretics | ||||
| Only one type, n (%) | 32 (18) | 13 (19) | 19 (17) | |
| Two types, n (%) | 40 (23) | 20 (29) | 20 (18) | |
| Three types, n (%) | 2 (1) | 2 (3) | 0 (0) | |
| Biochemistry | ||||
| Creatinin mg/dL, mean ± SD | 0.9 ± 0.22 | 1.02 ± 0.33 | 0.97 ± 0.8 | 0.5 |
| Haemoglobin (g/dL), mean ± SD | 12.7 ± 2 | 11.9 ± 1.8 | 13.2 ± 1.6 | <0.001 |
| Adjusted BNP (BNP/upper limit of normal for age/gender), median (IQR) | 1.0 (0.7–1.7) | 1.2 (0.9–2.1) | 0.9 (0.6–1.4) | 0.001 |
| Total bilirubin (mmol/L), median (IQR) | 0.8 (0.6–1.2) | 0.90 (0.6–1.2) | 0.76 (0.6–1.2) | 0.78 |
| ASAT (U/L), median (IQR) | 21 (18–25) | 21 (18–27) | 21 (18–26) | 0.65 |
| ALAT (U/L), median (IQR) | 16 (12–21) | 16 (12–21) | 16 (13–21) | 0.79 |
| GGT (U/L), median (IQR) | 51 (29–90) | 76 (30–150) | 45 (27–67) | 0.002 |
| LDH (U/L), median (IQR) | 228 (190–278) | 242 (200–280) | 225 (188–278) | 0.39 |
| ALP (U/L), median (IQR) | 80 (67–98) | 89 (70–137) | 76 (66–90) | 0.005 |
Table 2 shows the imaging parameters of the TR cohort. A total of 76% of the patients had severe TR and 24% massive or torrential TR. RV-FWLS was able to identify more patients with abnormal RV function compared with conventional RV parameters (see Supplementary data online, Figure S1). Supplementary data online, Tables S1 and S2 show right chamber mechanics in different groups (controls, AF subjects, and TR patients) and the association of strain parameters with demographics characteristics and imaging parameters.
Echocardiographic parameters in patients with TR
| Variable | All patients, n = 176 | Patients with events, n = 67 | Patients without events, n = 109 | P-value |
|---|---|---|---|---|
| Heart rate, mean ± SD, bpm | 70 ± 13 | 70 ± 14 | 69 ± 13 | 0.40 |
| Mean arterial pressure, mean ± SD, mmHg | 86 ± 11 | 84 ± 13 | 87 ± 12 | 0.69 |
| Left chambers | ||||
| LV-EDV index, mean ± SD, mL/m2 | 43 ± 16 | 46 ± 17 | 41 ± 15 | 0.10 |
| LV-ESV index, mean ± SD, mL/m2 | 16 ± 9 | 19 ± 11 | 14 ± 7 | 0.12 |
| LV SV, mean ± SD, mL/m2 | 28 ± 10 | 27 ± 10 | 29 ± 10 | 0.41 |
| LV ejection fraction, mean ± SD, % | 63 ± 9 | 62 ± 10 | 64 ± 9 | 0.20 |
| LV-GLS, mean ± SD, % | −19.5 ± 4 | −17.7 ± 5 | −18.9 ± 4 | 0.10 |
| LA volume, mL/m2, median (IQR) | 57 (37–87) | 70 (37–90) | 53 (36–72) | 0.24 |
| Average E/é, mean ± SD | 10 ± 4 | 10 ± 4 | 10 ± 4 | 0.40 |
| Right ventricle | ||||
| RV-basal diameter, mean ± SD, mm | 44 ± 7 | 47 ± 7 | 43 ± 8 | 0.007 |
| RV-mid diameter, mean ± SD, mm | 35 ± 8 | 37 ± 8 | 34 ± 8 | 0.007 |
| PASP, mean ± SD, mmHg | 39 ± 12 | 40 ± 12 | 39 ± 12 | 0.47 |
| RV end-diastolic area, mean ± SD, cm2 | 22 ± 6 | 25 ± 7 | 20 ± 6 | <0.001 |
| RV end-systolic area, mean ± SD, cm2 | 12 ± 4 | 14 ± 4 | 11 ± 4 | 0.002 |
| RV FAC, mean ± SD,% | 44 ± 13 | 43 ± 16 | 45 ± 8 | 0.41 |
| TAPSE, mean ± SD, mm | 20.6 ± 4 | 20.6 ± 4 | 20.7 ± 4 | 0.97 |
| TAPSE/PASP | 0.58 ± 0.23 | 0.57 ± 0.20 | 0.59 ± 0.25 | 0.42 |
| S′wave TDI, mean ± SD, cm/s | 10.3 ± 2 | 10.1 ± 2 | 10.6 ± 2 | 0.20 |
| TEI index, mean ± SD | 65.6 ± 22 | 67 ± 25 | 64 ± 15 | 0.48 |
| RV-FWLS, mean ± SD, % | −21.3 ± 6 | −16.9 ± 5 | −24 ± 5 | <0.001 |
| RV-GLS, mean ± SD, % | −18.1 ± 5 | −14.6 ± 5 | −20.2 ± 4 | <0.001 |
| STREI index, mean ± SD, % | 55.7 ± 17 | 43.2 ± 13 | 63.3 ± 15 | <0.001 |
| Right atrium | ||||
| RA area, mean ± SD, cm2 | 30 ± 13 | 32 ± 10 | 29 ± 13 | 0.23 |
| RA volume, median (IQR), mL/m2 | 60 (41–83) | 66 (50–98) | 53 (37–79) | 0.001 |
| IVC diameter mean ± SD (mm) | 20 ± 6 | 24 ± 6 | 20 ± 6 | 0.002 |
| Estimated RAP (IVC) | 8 (3–15) | 8 (8–15) | 8 (3–8) | 0.01 |
| RASr, median (IQR), % | 11 (7–16) | 8.7 (6–13) | 13 (10–19) | <0.001 |
| RASct, mean ± SD, % | −1.5 ± 9 | −2.8 ± 8 | −2.7 ± 6.7 | 0.40 |
| Tricuspid regurgitation | ||||
| Tricuspid annulus, mean ± SD, mm | 40 ± 7 | 41 ± 6 | 39 ± 7 | 0.23 |
| TR biplane vena contracta, mean ± SD, mm | 9.5 ± 4 | 10.1 ± 4 | 8 ± 3 | 0.001 |
| ERO, median (IQR), cm2 | 0.47 (0.35–0.67) | 0.54 (0.37–0.73) | 0.42 (0.33–0.58) | 0.001 |
| TR regurgitant volume, median (IQR), mL | 37 (29–51) | 42 (32–55) | 35 (28–43) | 0.006 |
LV, left ventricle; LV-EDV, left ventricle end-diastolic volume; LV-ESV, left ventricle end-systolic volume; LV-SV, left ventricle stroke volume; LV-GLS, left ventricle global longitudinal strain; LA, left atrium; PASP, pulmonary artery systolic pressure; TDI, Tissue Doppler imaging; RV-GLS, right ventricle global longitudinal strain, IVC, Inferior Vena Cava; RAP, right atrial pressure; RASct, right atrial contractile strain.
Details for the independent testing cohort of TR patients are included in the Supplementary data online, Table S2.
After a median follow-up of 2.2 years [interquartile range (IQR) 12–41 months], 38% (n = 67) reached the combined endpoint. A total of 37% were admitted due to HF (n = 65), and 8.5% of the sample (n = 15) died. A total of 26 patients underwent tricuspid valve surgery and 18 underwent percutaneous TV intervention.
Tables 1 and 2 show differences in clinical, laboratory, and imaging parameters. Patients who experienced events exhibited lower haemoglobin levels, higher basal brain natriuretic peptide (BNP) values, and higher cholestasis liver enzymes [gamma-glutamyl transpeptidase (GGT) and serum alkaline phosphatase (ALP)].
Patients with events showed a higher degree of TR [higher vena contracta (VC) P = 0.001; higher effective regurgitant orifice area P = 0.001; higher regurgitant volume P = 0.006], higher RV diameters (P = 0.007) and end-diastolic/end-systolic areas (P < 0.001 and P = 0.002, respectively), higher RA volume (P = 0.001) and lower values of RV-FWLS (P < 0.001), and lower RASr (P < 0.001) (Table 2). TAPSE, TEI, S′wave, and FAC were not significantly different in patients with or without events (P > 0.05 for all).
Univariate and multivariate Cox regression analyses are shown in Table 3. RASr and RV-FWLS were included in multivariate Model 1 with additional imaging prognostic parameters. RASr and RV-FWLS remained independent predictors of HF and all-cause mortality (Table 3; LR χ2: 57.8, P < 0.001). Supplementary data online, Table S4 shows additional Cox regression analysis performed in the subgroup of patients with severe functional ventricular TR in the context of previously corrected left valve disease with similar results.
Results of univariate and multivariate analyses in prediction of the outcome endpoints
| Univariate | Multivariate Model 1 (LR χ2: 57.8) | Multivariate Model 2 (LR χ2: 63.1) | Multivariate Model 3 (LR χ2: 72.13) | |||||
|---|---|---|---|---|---|---|---|---|
| unadj HR (95% CI) | P | Adj HR (95% CI) | P | Adj HR (95% CI) | P | Adj HR (95% CI) | P | |
| Age (years) | 1.02 (0.99–1.05) | 0.12 | — | — | — | — | — | — |
| Gender (female) | 1.61 (0.98–2.63) | 0.06 | — | — | — | — | — | — |
| BMI (kg/m2) | 0.95 (0.89–1.02) | 0.15 | — | — | — | — | — | — |
| NYHA class | 1.96 (1.42–2.70) | <0.001 | — | — | 1.62 (1.16–2.28) | 0.006 | 1.47 (1.05–2.06) | 0.02 |
| TV intervention (surgical or percutaneous) | 0.36 80.22–0.60) | <0.001 | 0.57 (0.34–0.98) | 0.05 | 0.54 (0.32–0.90) | 0.02 | 0.75 (0.42–1.33) | 0.08 |
| Haemoglobin (g/dL), | 0.79 (0.70–0.90) | <0.001 | — | — | — | — | ||
| Adjusted BNP, | 1.52 (1.18–1.97) | 0.001 | — | — | — | — | — | — |
| GGT (U/L), | 1.01 (1.00–1.01) | <0.001 | — | — | — | — | — | — |
| ALP (U/L), | 1.01 (1.01–1.02) | <0.001 | — | — | — | — | — | — |
| LVEF, % | 0.98 (0.96–1.01) | 0.17 | — | — | — | — | — | — |
| LV-GLS, % | 1.03 (0.98–1.09) | 0.18 | — | — | — | — | — | — |
| RV-basal diameter, mm | 1.03 (1.003–1.06) | 0.02 | — | — | — | — | — | — |
| RV-mid diameter, mm | 1.03 (1.004–1.06) | 0.02 | — | — | — | — | — | — |
| RA volume, mL/m2 | 1.00 (0.99–1.01) | 0.51 | — | — | — | — | — | — |
| RV end-diastolic area, cm2 | 1.07 (1.04–1.10) | <0.001 | 1.02 (0.98–1.06) | 0.42 | 1.02 (0.97–1.06) | 0.45 | 1.04 (1.01–1.08) | 0.02 |
| RV end-systolic area, cm2 | 1.09 (1.04–1.14) | <0.001 | — | — | — | — | — | — |
| TR velocity, mm/s | 0.99 (0.99–1.01) | 0.22 | 1.01 (0.97–1.02) | 0.96 | 1.00 (0.99–1.00) | 0.97 | 0.99 (0.97–1.02) | 0.97 |
| RV FAC, | 2.76 (0.29–29.4) | 0.40 | — | — | — | — | — | — |
| TAPSE, mm | 0.99 (0.94–1.05) | 0.83 | — | — | — | — | — | — |
| TAPSE/PASP | 0.68 (0.23–2.00) | 0.48 | ||||||
| S′wave TDI, cm/s | 0.92 (0.80–1.05) | 0.20 | — | — | — | — | — | — |
| TEI index | 0.61 (0.13–2.77) | 0.51 | — | — | — | — | — | — |
| RV-FWLS, % | 1.15 (1.10–1.21) | <0.001 | 1.15 (1.10–1.19) | <0.001 | — | — | — | — |
| RV-GLS,% | 1.16 (1.12–1.22) | <0.001 | — | — | — | — | — | — |
| RA volume, mL | 1.01 (0.99–1.00) | 0.43 | — | — | — | — | — | — |
| RASr, % | 0.90 (0.86–0.95) | <0.001 | 0.96 (0.87–0.99) | 0.05 | — | — | — | — |
| STREI, % | 0.94 (0.93–0.96) | <0.001 | — | — | 0.95 (0.93–0.96) | <0.001 | — | — |
| STREI stratification | 2.18 (1.76–2.71) | <0.001 | — | — | — | — | 1.89 (1.40–2.34) | <0.001 |
| Biplane VC, mm | 1.78 (1.22–2.62) | 0.003 | 1.22 (0.69–2.17) | 0.48 | 0.94 (0.52–1.71) | 0.85 | 1.17 (0.63–2.16) | 0.61 |
| ERO, median (IQR), cm2 | 1.21 (1.15–2.39) | 0.06 | — | — | — | — | — | — |
| TR regurgitant volume, mL | 1.01 (1.00–1.01) | 0.03 | — | — | — | — | — | — |
For univariate analyses, results are presented with unadjusted hazard ratios (unadj HR) with 95% confidence intervals (95% CI). Model 1: RV-FWLS, RASr, RV-EDA, TR velocity, biplane VC and TV intervention. Model 2: STREI index, NYHA class, RV-EDA, TR velocity, biplane VC and TV intervention. Model 3: STREI stratification, NYHA class, RV-EDA, TR velocity, biplane VC and TV intervention.
Both RV-FWLS and RASr were predictors of the probability of undergoing TV intervention in univariate Cox analysis (HR for RV-FWLS: 1.08 [1.02–1.13], P = 0.004 and for RASr 0.93 [0.87–0.98], P = 0.012); in a multivariate model adjusted also for VC, RV-EDA, and TR velocity, RV-FWLS remained an independent predictor of TV intervention (χ2: 25.2, P < 0.001).
Novel STREI index calculation based on outcome data and external testing in an independent cohort
On time-dependent receiver operating characteristic curve analysis, a cut-off value of RV-FWLS of >−20%, RASr of <10% demonstrated the highest accuracy in predicting outcomes [area under the curve (AUC) for RV-FWLS and RASr: 0.82 (0.74–0.89); 0.73 (0.65–0.82), respectively, P < 0.001 for all]. Cox regression analysis showed that both, abnormal RV-FWLS and abnormal RASr (as binary variables), were predictors of outcomes (LR χ2: 62.24, P < 0.001, adjusted HR for RV-FWLS: 3.9 [2.1–7.1] and for RASr: 2.1 [1.2–3.6]). Based on these results, STREI index was developed with the formula: [2 ∗ RV-FWLS] + RASr in absolute numbers.
STREI index was significantly lower in at least severe TR in comparison to controls and compared with AF (P < 0.001, Supplementary data online, Table S1). Massive and torrential TR showed lower STREI compared with severe TR (P < 0.001, Supplementary data online, Figure S2). Patients with events showed lower STREI values compared with patients without events (P < 0.001, Table 2).
STREI index showed stronger association with outcomes with higher AUC and lower AIC compared with RV-FWLS, RASr, and conventional 2D RV indices (STREI: AIC 591.3, AUC 0.86; RV-FWLS: AIC 597, AUC 0.82; and RASr: AIC 621.8, AUC 0.73, Supplementary data online, Table S5). Similar results were shown in the atrial-functional and ventricular-functional subgroups (see Supplementary data online, Material).
In a multivariable analysis including STREI index instead of RASr and RV-FWLS, STREI index remained an independent predictor of events (Table 3; Model 2, LR χ2: 63.6, P < 0.001). If all strain variables (STREI, RASr, and RV-FWLS) were included in the model, only STREI remained independent predictor of outcomes (AIC 577.9, Harrell’s C index 0.76, P < 0.001). In the subgroup of patients undergoing TV intervention, lower RV-FWLS and STREI were predictors of readmission of HF or all-cause mortality (HR for RV-FWLS: 1.19 [1.03–1.40], P = 0.016; HR for STREI: 0.92 [0.88–0.98], P = 0.011).
A cut-off value of STREI of <50% demonstrated the highest accuracy to predict outcomes [AUC: 0.86 (0.79–0.91), P < 0.001]. A STREI index above the prognostic threshold was associated with 6.69-fold increased risk of HF or all-cause mortality [HR 6.69 (3.8–11.7), P < 0.001] (Figure 3).

Kaplan Meier curves. Patients with STREI < 50% showed a significantly higher rate of HF events and all-cause of death.
Intra and interobserver reproducibility for STREI values within the cohort demonstrated strong concordance (ICC: 0.985 and 0.981, respectively).
Prospective testing of above thresholds of strain parameters in an independent cohort of patients (n = 50) achieved similar performance [AUC for RV-FWLS, RASr, and STREI: 0.85 (0.74–0.96); 0.82 (0.73–0.94); and 0.89 (0.81–0.97), respectively, P < 0.001 for all]. A STREI value of 50% held a sensitivity of 75% and specificity 82% to predict events (positive predictive value = 67% and negative predictive value = 88%).
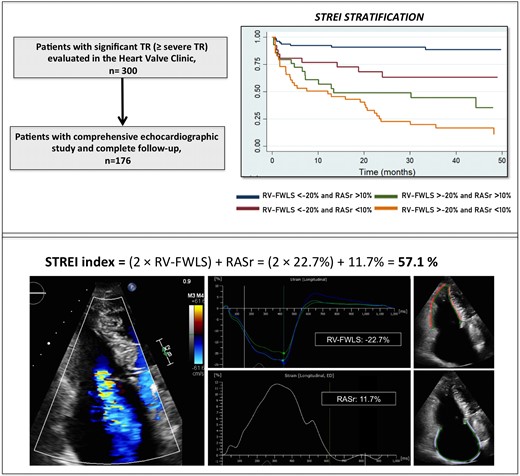
STREI stratification: stratification risk based on strain groups
In order to be able to use STREI index during clinical practice, four risk groups were built combining RV-FWLS and RASr strain values as binary variables (STREI stratification, based on the defined thresholds, Figure 4). Group 1 (patients with normal values of both indices of strain, RV-FWLS < −20% and RASr > 10% strain) had a significantly better prognosis (P = 0.003 vs. Group 2, P < 0.001 vs. Group 3, and P < 0.001 vs. Group 4). Group 4 (patients with abnormal RV-FWLS and abnormal RASr, RV-FWLS > −20% and RASr < 10%) showed a significantly higher rate of events (P = 0.001 vs. Group 2 and P = 0.04 vs. Group 3). Those patients with a single abnormal strain parameter (Groups 2 and 3) showed an intermediate event rate. In this scenario, the event rate trend was higher in those with abnormal RV-FWLS (Group 3) than in those with abnormal RASr (Group 2) (Group 3 = 54% vs. Group 2 = 33%, P = 0.12).
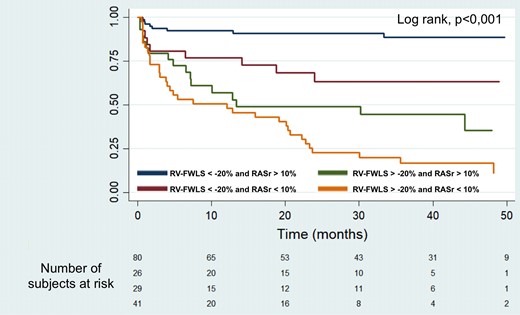
Kaplan–Meier survival curves according to STREI stratification based on RV-FWLS above/below −20% and RASr above/below 50% (Groups 1–4).
In a multivariate Cox analysis (Model 3, Table 3), the STREI stratification predicted HF and all-cause mortality independently of parameters of TR severity, RV dimensions, and clinical status (χ2: 72.1, adjusted HR per each stratum (1.89 [1.40–2.34]), P < 0.001 Table 3). Stratification based on STREI demonstrated a better performance in the prediction of outcomes compared with each abnormal strain parameter separately (STREI vs. RV-FWLS: C-statistic 0.74 (0.69–0.80) vs. 0.68 (0.63–0.74), Δ C-statistic −0.044 [−0.074–−0.014], P = 0.004, net reclassification index (NRI) 0.31; STREI vs. RASr: C-statistic 0.74 = 0.74 (0.69–0.80) vs. 0.65 (0.59–0.70), Δ C-statistic −0.094 [−0.145–−0.043], P ≤ 0.001, NRI 0.43).
Discussion
Our results demonstrate the clinical prognostic value of a new index to evaluate right chamber performance in patients with severe TR. STREI index by STE–TTE integrates RV and RA information, detecting early changes in right heart function with an independent prognostic impact on all-cause mortality and HF episodes. STREI stratification identifies different groups of risk based on prognostic thresholds of strain with impact on patient prognosis.
RV dimension and function are pivotal in the diagnostic work-up of patients with severe TR. The complex RV shape and geometry are a significant limitation for an accurate assessment using 2D echocardiography. Application of conventional echocardiographic indices of RV systolic function is limited in severe TR, partly because of the fact that it is influenced by loading conditions and the use of often-incorrect geometric assumptions. Previous studies have demonstrated that these indices fail to demonstrate early RV dysfunction remaining within normal ranges until advanced stages of tricuspid valve disease.11 Although strain indices are also affected by haemodynamic conditions, myocardial deformation impairment starts to develop before conventional parameters (TAPSE, FAC, ejection fraction) fall.10–12,18
STREI combines RA and RV strain information describing better the effects of TR in right performance. The traditional myocardial performance index or TEI index pursued the same objective of combining systolic and diastolic function into a single parameter. However, despite initial expectations, the use of the traditional TEI index to assess RV function, particularly in severe TR, has been relegated in clinical practice. The TEI index is highly influenced by the load conditions and cannot consistently reflect the contractile function.21
The utility of combining RV function (RV-FWLS) and RA remodelling was first demonstrated in pulmonary hypertension.17 In severe TR, the interplay between dynamic changes of the TV annulus, RV, and RA is key to understand the natural evolution of the valve disease.22
In our selected sample (before an episode of HF), conventional indices of RV function did not demonstrate association with clinical outcomes. For the first time, the present study demonstrates that a STREI index below <50% and RV-FWLS below >−20% are more sensitive to detect RV dysfunction and superior for outcome prediction compared with conventional 2D assessment.
Recently, a recent study from our group showed that RA function plays an important role in patients with severe TR.15 Assessment of RA function by 2D-STE is feasible and reproducible. This study demonstrated that in patients with severe TR and permanent AF, RA strain is impaired beyond the atrial dysfunction expected in patients with isolated permanent AF. Subsequently, these results were confirmed in a larger cohort of TR patients.16
The present study expands the recent evidence combining both strain parameters. It shows that impaired RA or RV function may not coexist in early stages. This study demonstrated different risk levels based on the combination of RA and RV strain indices. Compared with RV-FWLS, the value of RA strain deterioration has a less important contribution in terms of prognostic impact (Figure 4) that was subsequently confirmed in an external validation cohort. Further studies are needed to externally validate our results in independent cohorts of patients with TR. If confirmed, RA strain parameters could have a role as risk modifiers for decision-making, especially in those patients displaying borderline RV performance values. Although this study did not include serial longitudinal follow-up echocardiographic variables, advanced stages of self-perpetuating TR probably lead to both RV and RA remodelling resulting in increased right chamber stiffness, reduced relaxation, and impaired myocardial contractility. At this stage, both RA and RV strain would be significantly reduced, reflecting the last level of risk with worse prognosis. The quantification of changes in RA and RV function during the disease course may help to detect earlier deleterious effects of TR that impact on patient prognosis.
Adding RA function to RV assessment complements the evaluation of right heart function performance in severe TR. The combination of RA and RV function may stratify better patients’ risk, reflecting a broader effect of TR on right heart chambers. In this cohort, patients’ stratification through the combination of different RA and RV stratum (STREI stratification) was more discriminative in predicting prognosis and probably more easily applicable in clinical routine. The present study shows stronger association with outcomes (higher AUC, C statistics, and NCI) when patients were stratified using both RASr and RV-FWLS compared with each strain parameter separately.
Appropriate timing of intervention is crucial to improve patients’ outcomes; however current recommendations lack of robust evidence resulting in discrepancy in the implementation of clinical guidelines.4,5,23 Although untreated severe TR is associated with unfavourable prognosis,1,6 TR interventions are underutilized owing to increased surgical risk and late patient presentation. RV performance is crucial in clinical decisions prior the development of HF symptoms. Our data confirm that the evaluation of the right chambers at this stage should be approached with earlier indices of RA and RV dysfunction.
A comprehensive approach that includes not only quantitative measures of jet severity but also parameters of chamber dimensions, relaxation, stiffness, and contractility may help re-define severity of tricuspid vale disease in future. This approach holds promise in the identification and selection of patients who could benefit from early intervention.
The current prospective study establishes the prognostic utility of combining RA and RV function through the new STREI index in patients with TR. This novel index represents a new tool for early detection of RV dysfunction, holding promise for future studies or clinical trials to guide optimal timing for valve intervention.
Limitations
This was an observational study conducted at a single centre, which may potentially limit the generalizability and statistical power of the findings. Strain values were measured at one time point whereas longitudinal variation over time may provide additional prognostic information. A considerable number of patients in our study exhibited AF, reflecting the prevalent clinical scenario observed in cases of severe TR. The highly specialized cohort may affect the generalizability of the findings, since symptomatic patients and those with previous admission due to HF were not included. Right ventricular ejection fraction from 3D echocardiography was not measured in this study. Lastly, invasive haemodynamic assessment was not performed routinely in all patients.
Conclusions
STREI is a novel index by speckle-tracking echocardiography (STREI index) that includes both RA and RV strain information in a single parameter. STREI index outperforms conventional indices of RV performance in patients with ≥severe TR. The combination of RA and RV strain (STREI stratification) stratifies better different TR groups of risk and may aid in identifying patients who may benefit from earlier intervention.
Supplementary data
Supplementary data are available at European Heart Journal - Cardiovascular Imaging online.
Funding
This study was supported by the Instituto de Salud Carlos III, grant number PI20/01206.
Data availability
The data underlying this article will be shared on reasonable request to the corresponding author.
References
Author notes
Conflict of interest: None declared.
