


Abstract
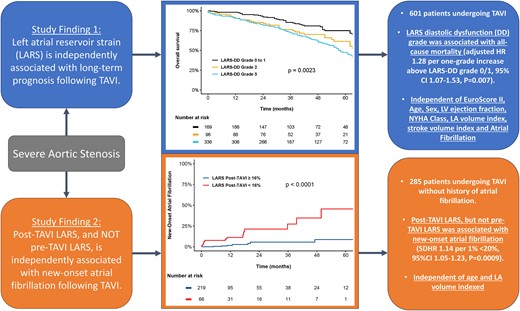
To evaluate the prognostic implications of the left atrial reservoir strain–defined diastolic dysfunction (LARS-DD) grade in patients undergoing transcatheter aortic valve implantation (TAVI) for severe aortic stenosis (AS) and to determine whether post-TAVI LARS was more closely associated with new-onset atrial fibrillation than pre-TAVI LARS.
Pre-TAVI LARS-DD was evaluated by speckle-tracking echocardiography and was assigned as Grade 0 to 1 (LARS ≥24%), Grade 2 (LARS 19–24%), and Grade 3 (LARS <19%). Patients were followed up for the primary endpoint of all-cause mortality from the date of TAVI. For the secondary endpoint, patients with pre- and post-TAVI LARS measurements and no history of atrial fibrillation were evaluated for the occurrence of new-onset atrial fibrillation. A total of 601 patients [median age 81 (76–85) years, 53% males] were included. Overall, 169 patients (28%) were LARS-DD Grade 0/1, 96 patients (16%) were LARS-DD Grade 2, and 336 (56%) were LARS-DD Grade 3. Over a median follow-up of 40 (interquartile range 26–58) months, a total of 258 (43%) patients died. In a comprehensive multivariable Cox regression model, the LARS-DD grade was independently associated with all-cause mortality [adjusted hazard ratio (HR) 1.28 per one-grade increase, 95% confidence interval (CI) 1.07–1.53, P = 0.007]. For the secondary endpoint of new-onset atrial fibrillation, a total of 285 patients were evaluated. Post-TAVI LARS (subdistributional HR 1.14 per 1% <20%, 95% CI 1.05–1.23, P = 0.0009), but not pre-TAVI LARS (P = 0.93), was independently associated with new-onset atrial fibrillation.
An increased LARS-DD grade was independently associated with long-term post-TAVI survival in patients with severe AS. Post-TAVI LARS was closely related to the occurrence of new-onset atrial fibrillation.
Introduction
Severe aortic stenosis (AS) is an important cause of morbidity and mortality worldwide, although it remains highly amenable to treatment with surgical aortic valve repair or transcatheter aortic valve implantation (TAVI).1,2 Current guidelines recommend intervention in patients with symptoms or impaired left ventricular (LV) systolic function [LV ejection fraction (EF) <50%].3,4 However, LV diastolic dysfunction is highly prevalent and typically precedes symptoms and LV systolic dysfunction in patients with severe AS,5 and the identification of worse diastolic function could be used to improve patient risk stratification, prognostication, or selection for intervention.6
Previously, a more sensitive evaluation of LV diastolic dysfunction severity through the quantification of left atrial reservoir strain (LARS), a parameter of left atrial (LA) deformation, was proposed, termed LARS-defined diastolic dysfunction (LARS-DD) grading.7 In severe AS, due to chronic LV pressure overload, it is likely that pre-procedural impairment of LA deformation primarily reflects LV diastolic dysfunction, LV myocardial fibrosis, and elevated LV filling pressures, which may be associated with poor outcome following TAVI.6 However, until now, only several small studies have evaluated the prognostic implications of LARS in patients with severe AS undergoing TAVI.8–12
Furthermore, following TAVI and the alleviation of LV pressure overload, it is probable that impaired post-TAVI LARS more closely reflects intrinsic LA dysfunction. Therefore, we hypothesized that post-TAVI LARS, rather than pre-TAVI LARS, would predict the new onset of atrial fibrillation and facilitate the identification of underlying atrial cardiomyopathy or intrinsic LA dysfunction.
Therefore, this study aimed to: (i) evaluate the association between pre-TAVI LARS-DD grade and post-procedural survival in patients undergoing TAVI for severe AS and (ii) examine the hypothesis that post-TAVI LARS is more closely associated with new-onset atrial fibrillation than pre-TAVI assessment of LA deformation.
Methods
Study population
Patients with severe AS who underwent transfemoral TAVI at the Leiden University Medical Center between November 2007 and December 2019 were selected from the departmental echocardiographic database. Patients who underwent valve-in-valve TAVI, or in whom two-dimensional speckle-tracking analysis was not feasible due to inadequate tracking (n = 72), were excluded. Patient demographic and clinical data were obtained from the departmental electronic medical record (EPD-vision; Leiden University Medical Centre, Leiden, The Netherlands), and included demographic characteristics, cardiovascular risk factors, EuroSCORE II, New York Heart Association (NYHA) functional class, estimated glomerular filtration rate (eGFR), haemoglobin, and comorbidities. The institutional review board of the Leiden University Medical Centre waived the requirement for written patient informed consent as this study involved the retrospective analysis of clinically acquired data. This investigation conforms to the principles outlined in the Declaration of Helsinki. The data that support the findings of this study are available on reasonable request to the corresponding author.
Echocardiography
Comprehensive transthoracic echocardiography was performed by qualified personnel as a component of routine clinical practice, using an E9 or an E95 ultrasound system (General Electric Vingmed Ultrasound, Horten, Norway) with patients at rest in the left lateral decubitus position. Electrocardiogram (ECG)-triggered echocardiographic data were stored digitally in a cine-loop format for offline analysis (EchoPAC Version 203, 204, General Electric Vingmed Ultrasound). Measurements were performed by four personnel with at least 2 years of experience in the evaluation of LA strain by speckle-tracking echocardiography. Echocardiographic images used for the evaluation of post-TAVI LA deformation were acquired at ∼1 month following TAVI, as per institutional protocol. AS severity was evaluated according to peak aortic jet velocity, mean pressure gradient, and aortic valve area.13 Aortic and mitral regurgitation (MR) severity were graded accordingly as none, mild, moderate, or severe, using a multi-parametric approach, as per guideline recommendations.14 LV end-diastolic and end-systolic volumes were measured using planimetry in apical two- and four-chamber views. LVEF was subsequently calculated using the Simpson biplane method, while LV mass was quantified using a two-dimensional linear approach.15 LA volume was measured on apical two- and four-chamber views using the biplane method and was indexed for body surface area. Diastolic dysfunction was graded utilizing a multi-parametric method, as per guideline recommendations.16 All other standard measurements were performed according to the American Society of Echocardiography and European Association of Cardiovascular Imaging guidelines.15
Speckle-tracking echocardiography
LARS was measured on an apical four-chamber view with the onset of the QRS complex used as the zero-reference point (R–R gating), according to guideline recommendations17 (Figure 1). The endocardial border of the LA was manually traced when it was at its minimum volume following atrial contraction. Automatic tracking of the LA wall by the software was visually verified and corrected by adjusting the region of interest or the width of the contour, ensuring appropriate capture of LA motion. LARS was estimated from the first peak of the LA strain curve, immediately prior to mitral valve opening, using LA end systole as reference. LV global longitudinal strain (GLS) was measured from apical two-, three-, and four-chamber views, according to guideline recommendations.17
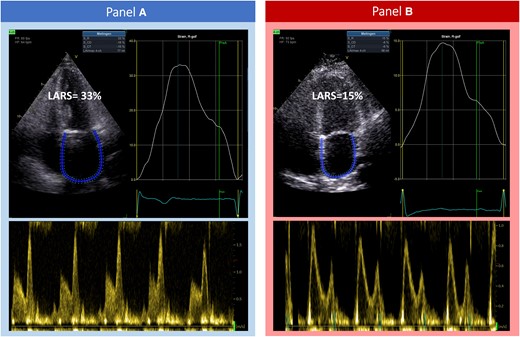
A demonstration of the acquisition of LARS in patients undergoing TAVI for severe aortic stenosis, with left atrial strain curves and corresponding transmitral pulsed wave Doppler flow. (A) A patient with Grade 0/1 LARS-DD (LARS 33%), who survived at long-term follow-up. (B) A patient with Grade 3 LARS-DD (LARS 15%). This patient did not survive at long-term follow-up. LARS, left atrial reservoir strain; LARS-DD, left atrial reservoir strain diastolic dysfunction; TAVI, transcatheter aortic valve implantation.
Follow-up
Patients were followed up for the primary endpoint of all-cause mortality from the date of TAVI. Mortality data were collected through the Social Security Death Index or by medical record review and were complete for all patients. The secondary endpoint of the study was the occurrence of new-onset atrial fibrillation from the date of the post-TAVI echocardiogram. Atrial fibrillation was documented on a standard 12-lead ECG, defined as irregular R–R intervals in the absence of distinct repeating P waves and irregular atrial activation, lasting for at least 30 s or during the entire 12-lead ECG.18
Statistical analysis
Categorical variables are expressed as numbers and percentages, while continuous variables are presented as median and interquartile range (IQR). Differences between groups were compared using the Pearson χ2 test for categorical variables and the Kruskal–Wallis test for continuous variables. Multiple comparisons were tested using Bonferroni’s correction. To examine the nature of the association between LARS and the hazard ratio (HR) change for the primary and secondary endpoints, restricted cubic spline curves were fitted. In addition, to evaluate the prognostic importance of the pre-TAVI LARS-DD grade in severe AS, patients were divided into three groups, as previously described7: LARS-DD Grade 0 to 1 (LARS ≥35 and 24–35%, respectively), Grade 2 (LARS 19–24%), and Grade 3 (LARS <19%). To account for missing data, multiple imputations by predictive mean matching using a chained-equation approach were performed to generate 100 imputed data sets.19 The results of the survival analyses were obtained by averaging the parameter estimates across the multiple imputed data sets using Rubin’s rules to combine the standard errors.20 The cumulative incidence of all-cause mortality according to the LARS-DD grade was calculated using the Kaplan–Meier method and compared using the log-rank test. Univariable Cox proportional hazards regression analysis was used to evaluate the association between the LARS-DD grade and the endpoint of all-cause mortality. Multivariable Cox proportional hazards regression analyses were performed using two levels of adjustment. First, adjustment was made for baseline clinical and biochemical characteristics such as age, sex, EuroSCORE II, NYHA Class III–IV symptoms, eGFR, haemoglobin (core model). Second, further adjustment was made for prognostically important echocardiographic factors and cardiac rhythm such as LVEF, LA volume index, LV stroke volume index, and atrial fibrillation (comprehensive model).
To evaluate the association of pre- and post-TAVI LARS with the occurrence of new-onset atrial fibrillation, univariable Cox proportional hazards regression analyses were performed. The Kaplan–Meier method was used to compare the cumulative incidence of the occurrence of new-onset atrial fibrillation according to pre- and post-TAVI LARS divided by thresholds estimated from the fitted spline curves. Multivariable Cox regression analyses were performed for pre- and post-TAVI LARS fitted with linear spline terms (to reduce variance and minimizing model overfitting), adjusting for a limited number of predefined variables (age and LA volume index) to minimize the risk of model overfitting.21 In addition, to account for the competing risk of death, a multivariable Fine–Gray regression analysis was performed.22
Hazard ratio and 95% confidence intervals (CIs) were reported for each Cox regression model, while subdistributional HRs (SDHRs) and 95% CI were reported for the Fine–Gray regression analysis. The proportional hazards assumption was verified through the evaluation of scaled Schoenfeld residuals. All tests were two-sided and P-values <0.05 were considered statistically significant. Statistical analysis was performed using SPSS version 25.0 (IBM Corporation, Armonk, NY, USA) and R version 4.1.1 (R Foundation for Statistical Computing, Vienna, Austria).
Results
Patient characteristics
A total of 601 patients with severe AS were included, with LARS evaluation feasible in 89% (601/673 patients; see Supplementary data online, Figure S1). The median age of the population was 81 (IQR 76–85) years and 53% were males. Overall, 42 patients (7%) had LARS-DD Grade 0, 127 patients (21%) had LARS-DD Grade 1, 96 patients (16%) showed LARS-DD Grade 2, and 336 (56%) had LARS-DD Grade 3. Patients with a higher LARS-DD grade were more likely to have previous or current atrial fibrillation and to present with NYHA Class III or IV symptoms. Table 1 summarizes the baseline clinical characteristics of the population.
Patient characteristics according to the LARS-DD grade
| Variable | Overall n = 601 | LARS-DD Grade 0/1 n = 169 | LARS-DD Grade 2 n = 96 | LARS-DD Grade 3 n = 336 | P-value |
|---|---|---|---|---|---|
| Age, years | 81 (76–85) | 81 (76–84) | 81 (77–85) | 81 (77–85) | 0.30 |
| Male sex | 316 (53%) | 83 (49%) | 54 (56%) | 179 (53%) | 0.50 |
| BMI, kg/m2 | 26.1 (23.9–28.7) | 26.7 (24.3–29.3) | 25.4 (23.9–28.6) | 26.0 (23.8–28.6) | 0.20 |
| Systolic blood pressure, mmHg | 139 (123–152) | 144 (129–155) | 145 (125–156) | 136 (120–150)*, ** | 0.003 |
| Diastolic blood pressure, mmHg | 67 (60–76) | 66 (60–75) | 68 (62–78) | 68 (60–75) | 0.71 |
| Hypertension | 448 (75%) | 131 (78%) | 79 (82%) | 238 (71%) | 0.057 |
| Dyslipidaemia | 356 (60%) | 104 (62%) | 61 (64%) | 191 (57%) | 0.43 |
| Diabetes mellitus | 174 (29%) | 49 (29%) | 26 (27%) | 99 (30%) | 0.89 |
| Previous stroke/TIA | 93 (18%) | 25 (18%) | 12 (15%) | 56 (20%) | 0.58 |
| Coronary artery disease | 351 (59%) | 94 (56%) | 58 (60%) | 199 (59%) | 0.70 |
| History of atrial fibrillation | 163 (27%) | 10 (6.0%) | 14 (15%) | 139 (41%)*, ** | <0.001 |
| COPD | 102 (17%) | 24 (15%) | 20 (21%) | 58 (18%) | 0.40 |
| NYHA Class III or IV | 335 (56%) | 77 (46%) | 51 (53%) | 207 (62%)* | 0.002 |
| Beta-blocker | 347 (58%) | 100 (60%) | 50 (52%) | 197 (59%) | 0.44 |
| ACEi or ARB | 317 (53%) | 89 (53%) | 55 (57%) | 173 (52%) | 0.62 |
| Diuretics | 324 (54%) | 69 (41%) | 50 (52%) | 205 (61%)* | <0.001 |
| Statin | 377 (63%) | 114 (68%) | 64 (67%) | 199 (59%) | 0.13 |
| eGFR, mL/min/1.73 m2 | 64 (49–81) | 68 (51–83) | 67 (49–81) | 62 (48–77) | 0.13 |
| Haemoglobin, mmol/L | 7.90 (7.10–8.50) | 7.85 (6.90–8.40) | 7.70 (7.00–8.30) | 7.90 (7.20–8.65) | 0.035 |
The values are expressed as median (IQR) and n (%).
ACEi, angiotensin-converting enzyme inhibitor; ARB, angiotensin receptor blocker; BMI, body mass index; COPD, chronic obstructive pulmonary disease; eGFR, estimated glomerular filtration rate; LARS-DD, left atrial reservoir strain diastolic dysfunction; NYHA, New York Heart Association; TIA, transient ischaemic attack.
*P < 0.05 vs. Group I.
**P < 0.05 vs. Group II.
Echocardiographic characteristics
The echocardiographic characteristics of the population are summarized in Table 2. The median LARS was 17% (IQR 10–24%). Patients with a higher LARS-DD grade had increased LV dimensions, increased LV mass, lower LVEF, and reduced LV stroke volume index. In addition, LA dimensions were increased, the aortic valve area was reduced, and there was a higher prevalence of significant MR in patients with a higher LARS-DD grade. Other echocardiographic parameters related to LV diastolic function (E/e′, tricuspid regurgitation maximum velocity, and E/A ratio) were all worse in patients with a higher LARS-DD grade.
Echocardiographic characteristics according to the LARS-DD grade
| Variable | Overall n = 601 | LARS-DD Grade 0/1 n = 169 | LARS-DD Grade 2 n = 96 | LARS-DD Grade 3 n = 336 | P-value |
|---|---|---|---|---|---|
| LV end-diastolic diameter index, mm/m2 | 24.9 (22.5–28.0) | 24.3 (22.3–26.8) | 25.1 (22.5–28.1) | 25.1 (22.5–28.7) | 0.068 |
| LV end-systolic diameter index, mm/m2 | 17.3 (14.1–20.4) | 15.5 (13.4–19.0) | 17.1 (14.3–21.1) | 17.7 (14.8–21.5)* | <0.001 |
| LV mass index, g/m2 | 121 (100–147) | 112 (91–133) | 122 (103–142) | 126 (104–151)* | <0.001 |
| LV end-diastolic volume index, mL/m2 | 47 (37–60) | 44 (35–55) | 49 (39–61) | 47 (38–64)* | 0.019 |
| LV end-systolic volume index, mL/m2 | 19 (13–30) | 16 (12–23) | 19 (14–28)* | 21 (14–36)* | <0.001 |
| LVEF, % | 58 (48–65) | 63 (56–69) | 60 (50–66)* | 55 (43–62)*, ** | <0.001 |
| Left atrial volume index, mL/m2 | 40 (31–51) | 33 (26–39) | 35 (27–44) | 47 (37–58)*, ** | <0.001 |
| Stroke volume index, mL/m2 | 38 (31–47) | 43 (35–51) | 39 (32–47) | 35 (29–43)*, ** | <0.001 |
| Aortic peak velocity, m/s | 4.00 (3.48–4.44) | 4.09 (3.66–4.51) | 4.14 (3.64–4.65) | 3.90 (3.36–4.36)*, ** | 0.001 |
| Aortic mean pressure gradient, mmHg | 41 (31–52) | 43 (34–54) | 42 (35–56) | 39 (30–49)*, ** | 0.002 |
| Aortic valve area, cm | 0.78 (0.62–0.93) | 0.83 (0.70–0.96) | 0.73 (0.59–0.93)* | 0.76 (0.60–0.92)* | 0.001 |
| Significant aortic regurgitation | 95 (16%) | 15 (9.2%) | 16 (17%) | 64 (19%)* | 0.016 |
| Mean mitral pressure gradient, mmHg | 2.22 (1.58–3.32) | 2.05 (1.51–2.85) | 2.02 (1.61–3.13) | 2.35 (1.60–3.55)* | 0.008 |
| Significant mitral regurgitation | 126 (21%) | 16 (9.8%) | 8 (8.3%) | 102 (31%)*, ** | <0.001 |
| Average e′ velocity, cm/s | 5.09 (4.00–7.00) | 5.00 (4.00–7.00) | 5.00 (4.00–6.00) | 6.00 (4.00–7.00) | 0.070 |
| E/e′ | 16 (12–22) | 13 (10–18) | 14 (11–19) | 17 (13–26)*, ** | <0.001 |
| Tricuspid regurgitation maximal velocity, m/s | 2.65 (2.36–3.01) | 2.55 (2.22–2.73) | 2.52 (2.26–2.82) | 2.78 (2.48–3.18)*, ** | <0.001 |
| Mitral inflow E-wave velocity, cm/s | 87 (66–114) | 70 (56–87) | 76 (58–93) | 103 (81–126)*, ** | <0.001 |
| Mitral inflow A-wave velocity, cm/s | 98 (76–123) | 102 (87–122) | 99 (80–124) | 94 (65–124) | 0.033 |
| Mitral inflow E/A ratio | 0.77 (0.59–1.15) | 0.66 (0.57–0.84) | 0.69 (0.57–0.89) | 1.04 (0.69–1.47)*, ** | <0.001 |
| Conventional multi-parametric diastolic dysfunction gradinga | <0.001 | ||||
| Grade 1 diastolic dysfunction | 198 (45%) | 104 (65%) | 51 (59%) | 43 (22%) | |
| Grade 2 diastolic dysfunction | 205 (47%) | 53 (33%) | 35 (41%) | 117 (60%) | |
| Grade 3 diastolic dysfunction | 37 (8.4%) | 2 (1.3%) | 0 (0%) | 35 (18%) | |
| LV global longitudinal strain (%) | −13.6 (−10.7 to −16.4) | −16.2 (−13.4 to −18.3) | −14.6 (−11.7 to −17.6) | −12.2 (−9.2 to −14.7) | <0.001 |
The values are expressed as median (IQR) and n (%).
LARS-DD, left atrial reservoir strain diastolic dysfunction; LV, left ventricle; LVEF, left ventricular ejection fraction.
aIn subset of patients without atrial fibrillation.
*P < 0.05 vs. Group I.
**P < 0.05 vs. Group II.
Association between LARS-DD grade and all-cause mortality
Over a median follow-up of 40 (IQR 26–58) months, a total of 258 (43%) patients died. Spline curve analyses were performed to investigate the association between values of LARS and all-cause mortality (Figure 2). Overall post-procedural survival at 5 years was markedly different according to the LARS-DD grade: 75% for patients with LARS-DD Grade 0 or 1 vs. 62% for patients with LARS-DD Grade 2 and 48% for patients of LARS-DD Grade 3 (P = 0.002, Figure 3). In addition, LARS-DD grade was significantly associated with all-cause mortality on univariable Cox regression analysis (HR 1.30 per one-grade increase above LARS-DD Grade 0/1, 95% CI 1.12–1.52, P = 0.0006). In the multivariable Cox regression proportional hazard core model adjusted for age, sex, EuroSCORE II and NYHA Class III–IV symptoms, LARS-DD grade remained associated with all-cause mortality (Table 3). In addition, in a comprehensive model with further adjustment for LVEF, atrial fibrillation, LA volume index, and LV stroke volume index, LARS-DD grade was independently associated with all-cause mortality (adjusted HR 1.28 per one-grade increase above LARS-DD Grade 0/1, 95% CI 1.07–1.53, P = 0.007). Even following adjustment for LV GLS, LARS-DD grade was significantly associated with all-cause mortality (adjusted HR 1.34 per one-grade increase above LARS-DD Grade 0/1, 95% CI 1.12–1.61, P = 0.002). In addition, in a comprehensive model, a similar association between LARS-DD grade and a combined endpoint of heart failure hospitalization and all-cause mortality was observed (adjusted HR 1.31 per one-grade increase above LARS-DD Grade 0/1, 95% CI 1.10–1.56, P = 0.003).
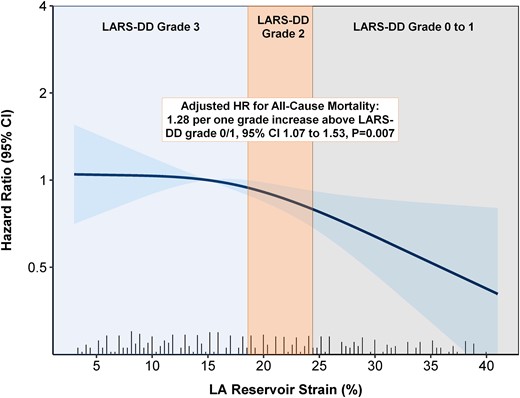
The association between LARS and outcome in patients with severe AS undergoing TAVI. The panel demonstrates the adjusted HR of the LARS-DD grade for all-cause mortality in patients undergoing TAVI for severe AS. LARS-DD grading is superimposed over a spline curve showing the association between LARS and the HR for all-cause mortality. AS, aortic stenosis; HR, hazard ratio; LARS-DD, left atrial reservoir strain diastolic dysfunction; TAVI, transcatheter aortic valve implantation.
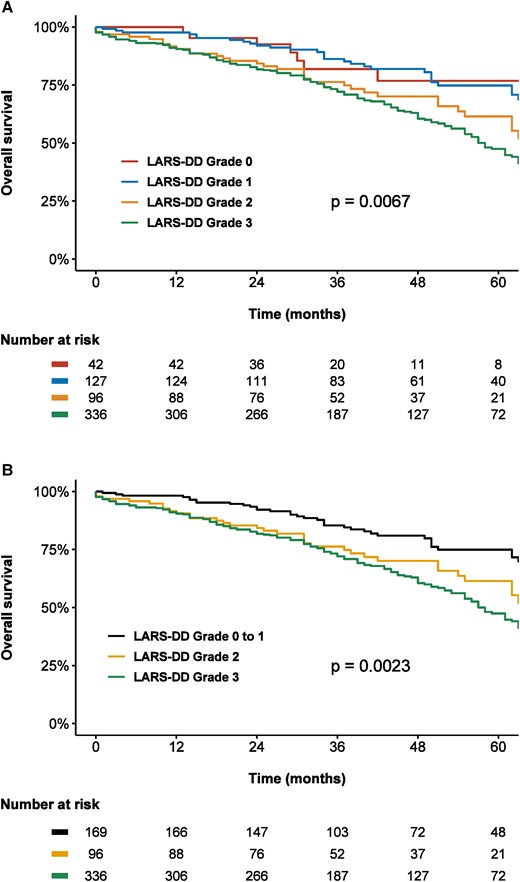
Kaplan–Meier curves demonstrating the association between LARS-DD grade and all-cause mortality according to (A) four LARS-DD groups and (B) three LARS-DD groups. An increased LARS-DD grade was associated with worse post-TAVI survival in patients with severe AS. LARS-DD, left atrial reservoir strain diastolic dysfunction.
Association between LARS-DD grade and all-cause mortality
| All-cause mortality n = 601 | LARS-DD (per 1 grade increase)a | LARS-DD Grade 0/1 n = 169 | LARS-DD Grade 2 n = 96 | LARS-DD Grade 3 n = 336 |
|---|---|---|---|---|
| Events/person-years | 52/643 | 37/331 | 169/1181 | |
| Incidence rate, per 1000 person-years (95% CI) | 80.88 (60.41–106.07) | 111.70 (78.65–153.96) | 143.16 (122.39–166.45) | |
| Unadjusted HR (95% CI) | 1.30 (1.12–1.52) | Reference | 1.39 (0.91–2.12) | 1.72 (1.26–2.35) |
| P-value for HR | 0.0006 | 0.13 | 0.0007 | |
| HR (95% CI) adjusted for age, sex, EuroSCORE II, eGFR, haemoglobin, NYHA Class III–IV symptoms (core model) | 1.29 (1.11–1.51) | Reference | 1.39 (0.91–2.12) | 1.69 (1.23–2.33) |
| P-value for adjusted HR | 0.001 | 0.13 | 0.001 | |
| HR (95% CI) further adjustment for LVEF, AFib, LAVI, and LV SVi (comprehensive model) | 1.28 (1.07–1.53) | Reference | 1.40 (0.91–2.14) | 1.65 (1.15–2.37) |
| P-value for adjusted HR | 0.007 | 0.13 | 0.007 |
AFib, atrial fibrillation; eGFR, estimated glomerular filtration rate; HR, hazard ratio; LARS-DD, left atrial reservoir strain diastolic dysfunction; LAVI, left atrial volume indexed; LVEF, left ventricular ejection fraction; LV SVi, left ventricular stroke volume indexed; NYHA, New York Heart Association.
aPer one-grade increase above Grade 0/1.
In a sensitivity analysis of the subgroup of patients without a history of atrial fibrillation, the LARS-DD grade remained associated with all-cause mortality in a comprehensive multivariable Cox regression model (adjusted HR 1.28 per one-grade increase above LARS-DD Grade 0/1, 95% CI 1.05–1.55, P = 0.014). Further adjustment for multi-parametric diastolic dysfunction grading according to guideline recommendations yielded similar results (adjusted HR 1.32 per one-grade increase above LARS-DD Grade 0/1, 95% CI 1.06–1.53, P = 0.011). Notably, guideline-directed classification of diastolic dysfunction grade was indeterminate in 55 patients. In patients without atrial fibrillation, there was no significant association between LA contractile strain (P = 0.26) or A-wave velocity (P = 0.28) and all-cause mortality following adjustment in a comprehensive model.
Association between pre- and post-TAVI LA strain and new-onset atrial fibrillation
A total of 285 patients with pre- and post-TAVI LARS measurements, no history of atrial fibrillation, and clinical/ECG follow-up following the post-TAVI follow-up echocardiogram were evaluated for the occurrence of new-onset atrial fibrillation (see Supplementary data online, Figure S2). The median time from TAVI to follow-up echocardiogram was 31 (IQR 31–41) days. The estimated mean change in LARS was 1.31%, from 21.6% (95% CI 20.5–22.7%) pre-TAVI to 22.9% (95% CI 21.9–24.0%) post-TAVI (P = 0.015). Over a median follow-up of 11.3 (IQR 10.8–23.7) months, a total of 21 (7.4%) patients experienced new-onset atrial fibrillation. Restricted cubic spline curve analysis was performed to investigate the association between values of pre- and post-TAVI LARS and new-onset atrial fibrillation (see Supplementary data online, Figures S3 and S4). Following a plateau phase, a marked increase in the HR for new-onset atrial fibrillation was seen for values of post-TAVI LARS under 20%, although no strong association was observed between values of pre-TAVI LARS and new-onset atrial fibrillation. Subsequently, a cut-off of LARS of 16% was estimated from spline curve analysis for the purpose of Kaplan–Meier analyses. The estimated cumulative incidence of new-onset atrial fibrillation at 3 years was significantly higher for values of post-TAVI LARS <16% compared with values of post-TAVI LARS ≥16% (27.3 vs. 5.6%, P < 0.0001, Figure 4). In contrast, there was no significant difference observed between patients with pre-TAVI LARS <16% and pre-TAVI LARS ≥16% (P = 0.10, Figure 4). Likewise, on univariable Cox regression analysis, post-TAVI LARS (HR 1.14 per 1% < 20%, 95% CI 1.06–1.23, P = 0.0003), but not pre-TAVI LARS (HR 1.04 per 1% < 20%, 95% CI 0.95–1.13, P = 0.40), was related to the occurrence of new-onset atrial fibrillation (Table 4). Multivariable Cox regression analysis adjusting for age and LA volume index demonstrated that post-TAVI LARS remained independently associated with new-onset atrial fibrillation (adjusted HR 1.11, per 1% < 20%, P = 0.014). To account for the competing risk of all-cause mortality, Fine–Gray analysis was performed, demonstrating results consistent with the Cox regression analyses. On multivariable Fine–Gray regression analysis adjusting for age and LA volume index, post-TAVI LARS (SDHR 1.14 per 1% < 20%, 95% CI 1.05–1.23, P = 0.0009), but not pre-TAVI LARS (SDHR 1.00 per 1% < 20%, 95% CI 0.91–1.11, P = 0.93) was associated with new-onset atrial fibrillation, even when accounting for the competing risk of death.
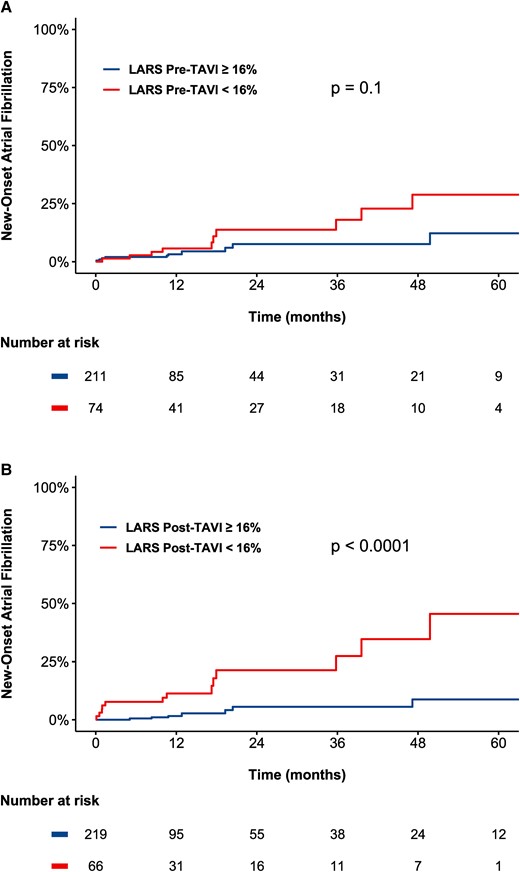
Kaplan–Meier curves demonstrating the association between LARS and new-onset atrial fibrillation according to (A) pre-TAVI LARS and (B) post-TAVI LARS. Lower values of post-TAVI LARS, but not of pre-TAVI LARS, were associated with an increased occurrence of new-onset atrial fibrillation. LARS, left atrial reservoir strain; TAVI, transcatheter aortic valve implantation.
Association between pre- and post-TAVI LARS and new-onset atrial fibrillation in patients without a history of atrial fibrillation
| New-onset AF n = 285 | LARS pre-TAVI | LARS post-TAVI | LARS post-TAVI ≥16% | LARS post-TAVI <16% |
|---|---|---|---|---|
| Events/person-years | 8/369 | 13/108 | ||
| Incidence rate, per 1000 person-years (95% CI) | 2.17 (0.94–4.27) | 11.98 (6.38–20.48) | ||
| Unadjusted HR (95% CI) | 1.04 (0.95–1.13) | 1.14 (1.06–1.23) | Reference | 5.54 (2.29–13.43) |
| P-value for HR | 0.40 | 0.0003 | 0.0002 | |
| HR (95% CI) adjusted for age and LAVI, per 1% < 20% | 0.97 (0.87–1.07) | 1.11 (1.02–1.22) | Reference | 5.10 (2.01–12.91) |
| P-value for adjusted HR | 0.53 | 0.014 | 0.0006 | |
| SDHR (95% CI) adjusted for age and LAVI, per 1% < 20% | 1.00 (0.91–1.11) | 1.14 (1.05–1.23) | Reference | 5.55 (2.17–14.24) |
| P-value for adjusted SDHR | 0.93 | 0.0009 | 0.0004 |
AF, atrial fibrillation; HR, hazard ratio; LARS-DD, left atrial reservoir strain diastolic dysfunction; LAVI, left atrial volume indexed; SDHR, subdistributional hazard ratio for new-onset atrial fibrillation.
Consistent with the analysis of pre- and post-TAVI LARS, post-TAVI LA contractile strain (see Supplementary data online, Figure S5) was independently associated with the occurrence of new-onset atrial fibrillation (adjusted HR 1.13 per 1% < 14%, 95% CI 1.01–1.26, P = 0.026), while pre-TAVI LA contractile strain (see Supplementary data online, Figure S6) was not (adjusted HR 1.03 per 1% decrease, 95% CI 0.94–1.12, P = 0.55).
Discussion
In this study of 601 patients undergoing TAVI for severe AS, (i) LARS-DD was ubiquitous among patients undergoing TAVI with severe AS, with 93% demonstrating at least Grade 1 LARS-DD and 56% classified as LARS-DD Grade 3, (ii) in a comprehensive multivariable analysis, an increased LARS-DD grade was independently associated with reduced long-term post-TAVI survival, and (iii) post-TAVI LARS, but not pre-TAVI LARS, was closely related to the occurrence of new-onset atrial fibrillation, likely reflecting intrinsic LA dysfunction.
Association between left atrial deformation and post-TAVI survival in patients with severe AS
In the presence of LV diastolic dysfunction, the LA plays an important role in augmenting preload, modulating cardiac output, and buffering elevations in LV filling pressures.23 Previously, Singh et al.7 proposed a novel grading system of LV diastolic function based on values of LARS, demonstrating that LARS decreases in a stepwise fashion with worsening LV diastolic dysfunction. Subsequent studies have demonstrated the prognostic utility of LARS-DD grading in patients with hypertrophic cardiomyopathy and community-dwelling elderly adults without ischemic risk factors, although not yet in severe AS.24,25 In severe AS, the presence of diastolic dysfunction is frequent due to impaired LV compliance, LV hypertrophy, concentric remodelling, and myocardial fibrosis6,26,27 and is closely associated with the presence of symptoms.28 Indeed, in the present study, 93% of patients demonstrated LV diastolic dysfunction by LARS-DD grading. Therefore, in patients with severe AS, prior to alleviation of pressure overload with TAVI and subsequent reverse remodelling, it could be hypothesized that impaired LARS primarily represents LV diastolic dysfunction and elevated filling pressures.
Overall, previous studies have demonstrated the prognostic value of diastolic dysfunction when using conventional Doppler evaluation of patients with severe AS, although with some conflicting results.16,26,27,29,30 However, when substituted for conventional Doppler assessment, LARS appears to offer improved sensitivity for the detection of diastolic dysfunction and elevated filling pressures, in addition to reducing the frequency of indeterminate diastolic dysfunction grading.31 Interestingly, no large study has convincingly demonstrated the prognostic value of LARS in patients with severe AS, although clear prognostic utility has been demonstrated in patients with severe degenerative mitral regurgitation, hypertrophic cardiomyopathy, and heart failure with reduced EF, for example.24,32,33 Several smaller studies evaluating LA strain in severe AS have shown an association with clinical outcome, although have been limited by small sample size, and none have evaluated the prognostic value of LARS-DD grading.8–12 The present study of over 600 patients with severe AS demonstrates that an increased LARS-DD grade is associated with worse long-term post-TAVI survival, independent of comorbidities, LVEF, stroke volume index, severity of symptoms, atrial fibrillation, and LA size. This finding may suggest that patients with a higher LARS-DD grade may have increased LA/LV myocardial fibrosis and functional impairment, which, despite restoration of normal aortic valve function, may be irreversible.
Association between post-TAVI LARS and new-onset atrial fibrillation
Following TAVI and the alleviation of LV pressure overload, a significant number of patients undergo LV reverse remodelling, with a reduction in LV mass, myocardial fibrosis, and subsequently, improvement in LV diastolic function.34 However, for many patients, LV diastolic dysfunction is persistent, myocardial fibrosis does not regress, or intrinsic, irreversible LA dysfunction may be present.35,36 Previous studies have demonstrated that LARS is associated with post-operative atrial fibrillation following surgical aortic valve replacement.37 However, post-procedural atrial fibrillation is less common following TAVI, and no study has compared the association of pre-TAVI LARS and post-TAVI LARS with new-onset atrial fibrillation. The present study demonstrates that post-TAVI LARS is strongly associated with new-onset atrial fibrillation, whereas pre-TAVI LARS is not. It is probable that a significant degree of impairment of LARS pre-TAVI is due to reduced LV compliance, elevated filling pressures and diastolic dysfunction directly due to LV pressure overload, pathophysiological changes which are reversed substantially following TAVI. Indeed, due to a reduction in LV afterload, post-TAVI LARS may more closely reflect intrinsic LA dysfunction than pre-TAVI LARS, and subsequently, would be expected to be more closely associated with the development of atrial fibrillation.
Clinical implications
The use of LARS-DD grading offers several advantages in the evaluation of diastolic function in severe AS in a clinical setting: (i) a single measurement by speckle-tracking echocardiography is required to evaluate LV diastolic dysfunction, rather than a multi-parametric evaluation with conventional Doppler assessment, which may be more reproducible and less time-consuming, (ii) evaluation of LARS is angle independent, (iii) evaluation of LV diastolic function with LARS may be more sensitive, accurate, and feasible than conventional assessment.7,31 In addition, the present study demonstrates that LARS-DD grading is independently associated with long-term post-TAVI survival, even after adjustment for multi-parametric diastolic dysfunction grading according to guideline recommendations, LVEF, LA volume index, and LV GLS, and may have an important role in patient risk stratification and prognostication. Further research in asymptomatic patients with severe AS is required to evaluate whether LARS-DD grading could improve patient selection for intervention. The current study also demonstrates that post-TAVI LARS may be a better predictor of new-onset atrial fibrillation following TAVI than pre-TAVI LARS, emphasising the need to re-evaluate LA and LV function following the treatment of pressure overload. Indeed, it is possible that reduced post-TAVI LARS reflects insufficient reverse remodelling, an alternative aetiology of diastolic dysfunction or intrinsic LA dysfunction, important considerations for the clinician.
Limitations
This study is subject to all the limitations of its single centre, retrospective, observational design. In addition, LARS was evaluated with vendor-specific software, and this should be considered when interpreting the values of LARS with different types of software. Although this study provides a prognostic validation of LARS-DD grading in severe AS, further comparison with invasive haemodynamics is needed for this patient subgroup. Furthermore, while alterations in haemodynamics and LV compliance occur soon after TAVI, LV reverse remodelling may continue to occur over 1 year following the procedure, and post-TAVI LARS assessed at ∼1 month (as in the current study) is likely also influenced by the degree and rapidity of cardiac reverse remodelling, reflecting persistent LV diastolic dysfunction and not only a pure estimate of intrinsic LA function.38 Studies have shown a wide range of normal values of LA strain in the general population.39 Therefore, it is imperative that a single low value of LARS not be used in isolation for risk stratification or clinical decision-making. Although all patients underwent systematic clinical follow-up after TAVI with routine 12-lead ECG assessment, it is probable that some cases of paroxysmal atrial fibrillation were not detected.
Conclusion
An increased LARS-DD grade was independently associated with long-term post-TAVI survival in patients with severe AS and may enhance risk stratification. In addition, post-TAVI LARS, but not pre-TAVI LARS, was closely related to the occurrence of new-onset atrial fibrillation, probably better reflecting intrinsic LA dysfunction.
Supplementary data
Supplementary data are available at European Heart Journal - Cardiovascular Imaging online.
Funding
S.C.B. received funding from the European Society of Cardiology (ESC Research Grant App000080404). K.H. received funding from the European Society of Cardiology (ESC Research Grant, R-2018-18122).
Data availability
The data that support the results of this study are available from the corresponding author upon reasonable request.
References
Author notes
Steele C Butcher and Kensuke Hirasawa contributed equally to this work.
Conflict of interest: The Department of Cardiology of the Leiden University Medical Center received research grants from Abbott Vascular, Bayer, Bioventrix, Medtronic, Biotronik, Boston Scientific, GE Healthcare, and Edwards Lifesciences. N.A.M. and J.J.B. received speaker fees from Abbott Vascular. Victoria Delgado received speaker fees from Abbott Vascular, Edwards Lifesciences, GE Healthcare, MSD, Novartis, and Medtronic and consultancy fees from Edwards Lifesciences and Novo Nordisk. The remaining authors have nothing to disclose.
