


Abstract
Ubiquitin-Proteasome System (UPS) is of paramount importance regarding the function of the myocardial cell. Consistently, inhibition of this system has been found to affect myocardium in experimental models; yet, the clinical impact of UPS inhibition on cardiac function has not been comprehensively examined. Our aim was to gain insight into the effect of proteasome inhibition on myocardial mechanics in humans.
We prospectively evaluated 48 patients with multiple myeloma and an indication to receive carfilzomib, an irreversible proteasome inhibitor. All patients were initially evaluated and underwent echocardiography with speckle tracking analysis. Carfilzomib was administered according to Kd treatment protocol. Follow-up echocardiography was performed at the 3rd and 6th month. Proteasome activity (PrA) was measured in peripheral blood mononuclear cells.
At 3 months after treatment, we observed early left ventricular (LV) segmental dysfunction and deterioration of left atrial (LA) remodelling, which was sustained and more pronounced than that observed in a cardiotoxicity control group. At 6 months, LV and right ventricular functions were additionally attenuated (P < 0.05 for all). These changes were independent of blood pressure, endothelial function, inflammation, and cardiac injury levels. Changes in PrA were associated with changes in global longitudinal strain (GLS), segmental LV strain, and LA markers (P < 0.05 for all). Finally, baseline GLS < −18% or LA strain rate > 1.71 were associated with null hypertension events.
Inhibition of the UPS induced global deterioration of cardiac function.
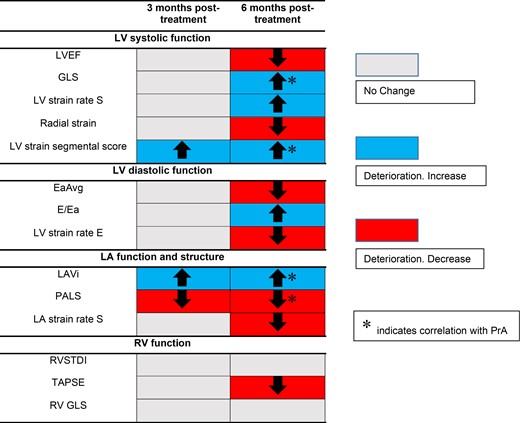
Cardiac markers change at 3 and 6 months after Kd treatment and their association with PrA. Carfilzomib induced a global deterioration of cardiac function, with LA remodelling markers and LV strain segmental score deteriorating earlier.
Introduction
The role of Ubiquitin-Proteasome System (UPS) is fundamental in cardiac cell physiology, as it prevents cardiomyocyte toxicity, by recycling normal short-lived proteins and also by degrading unfolded or misfolded dysfunctional polypeptides.1 The latter lead (among others) to accumulation of insoluble protein aggregates in the cell and subsequent cellular injury and death.2,3 Although there is evidence regarding the clinical implications of UPS in terms of cardiac disease4 and endothelial dysfunction,5 the clinical role of UPS has not yet been fully elucidated.
Previous evidence from animal experimental models1,6 suggest that UPS inhibition correlates with myocardial dysfunction, in terms of echocardiographic markers worsening. Proteasome inhibitors (PIs) induce proteotoxic stress and are extensively used in the treatment of multiple myeloma (MM) due to their substantial activity against malignant plasma cells. These drugs have shown improved response rates and survival of the patients,7 but, their use, especially of the 2nd generation non-reversible PIs, is associated with relatively frequent cardiovascular adverse reactions such as heart failure (HF), hypertension, and ischaemic heart disease.8,9 Thus, proteasome inhibition as a therapeutic strategy provides an attractive model for studying UPS function in human heart. Notably, (i) a mechanistic link between the observed cardiac dysfunction in humans and the level of proteasome inhibition has not been established, (ii) the sequence of cardiac dysfunction events in response to UPS inhibition has not been explored, and (iii) data regarding the prognostic value of more sophisticated and sensitive echocardiographic markers following UPS inhibition, are lacking. Thus, the aim of the current prospective study was to gain insight on the effect(s) of PIs on myocardial function in humans; to identify any association between echocardiographic changes and proteasome activity (PrA) and also to evaluate the clinical significance of these echocardiographic changes. To this end, we evaluated patients treated with carfilzomib, which is a 2nd generation irreversible PI approved for the treatment of patients with relapsed and/or refractory MM.7 An independent group of 11 MM patients not receiving carfilzomib served as a cardiotoxicity positive control group.
Methods
Study design, population, and methods
This study was part of a prospective, single centre, non-interventional study conducted in the Department of Clinical Therapeutics of the National and Kapodistrian University of Athens (NKUA, Greece), between June 2017 and September 2019 (ClinicalTrials.gov identifier: NCT03543579). Forty-eight patients with relapsed or refractory MM and an indication to receive Carfilzomib treatment were consecutively enrolled. The inclusion and exclusion criteria are presented in Supplementary data online, Table S1. All participants attended an initial visit and echocardiography study at baseline, 3 months, and 6 months as detailed in the Supplementary data online.
All participants underwent standard echocardiography and speckle tracking-derived measurements. We also implemented a semi-quantitative score to report changes in left ventricular (LV) longitudinal strain per cardiac segment (Supplementary data online). Measurements of pulse wave velocity (PWV), flow mediated dilation (FMD), and central aortic pressures were also available at the three timepoints of the study. PrA was measured in peripheral blood mononuclear cells (PBMCs) and red blood cells (RBCs) at pre-specified time points. Serial measurements of white blood cells (WBC) count and serum levels of high sensitivity C-reactive protein (hsCRP) and high sensitivity troponin T (hsTnT) were also performed in blood. The methods used to measure these markers are described in detail in the Supplementary data online. Patients were followed for carfilzomib-related new or worsening hypertension. Hypertension events were graded according to the US National Cancer Institute Common Terminology Criteria for Adverse Events v4.03.
Eleven patients with MM who underwent bone marrow transplant, not receiving carfilzomib, were included and had echocardiographic study at baseline and at 6 months after transplant in the 2nd Cardiology Department of the National and Kapodistrian University of Athens from September 2018 to May 2020. These patients received high dose chemotherapy after the baseline echocardiography study followed by stem cell transplantation. These regimens are known to be cardiotoxic,10 so this cohort served as a cardiotoxicity positive control group.
The primary objective of the current analysis was to evaluate patterns of cardiac dysfunction assessed by advanced echocardiography in response to PI, and their association with carfilzomib-mediated inhibition of PrA. The secondary objective was to further explore mechanistic associations between baseline echocardiographic markers and the incidence of carfilzomib-associated new or worsening hypertension.
The study was approved by the Local Ethics Committee of Alexandra Hospital (approval reference number 122/08-02-2018) and was conducted in full compliance with ΗΙPAA and the principles of Good Clinical Practice and the Declaration of Helsinki. All patients gave written informed consent.
Statistical methods
We employed linear mixed models to examine repeated measurements of echocardiographic markers and their association with concomitant changes in PrA, in LV/left atrial (LA) structural and functional indices, in FMD and in markers of inflammation and myocardial damage or group classification (patients with MM who were treated with carfilzomib or with high dose chemotherapy and stem cell transplant). We implemented Cox regression analysis to identify echocardiography markers that could predict the occurrence of adverse events across the follow-up period. Statistical analysis was performed using SPSS software v21.0.0.0 (SPSS Inc., Chicago, IL, USA) and Stata v16.0 (StataCorp, TX, USA). Statistical analysis is described in detail in the Supplementary data online.
Results
Baseline characteristics
The baseline characteristics of the study population and the control group population are shown in Supplementary data online, Tables S2 and S3, respectively. Study’s flowchart is shown in Supplementary data online, Figure S1.
Patterns of echocardiographic changes in response to carfilzomib
LV systolic function
As shown in Table 1 and Figures 1 and 2, a global deterioration of markers of LV systolic function was observed during follow-up. Specifically, LV ejection fraction (LVEF) decreased significantly at 6 months compared with baseline (P = 0.022). Strain markers also deteriorated at 6 months visit including global longitudinal strain (GLS) (P = 0.003), LV strain rate S wave (LVSRS) (P = 0.006), and radial strain (P = 0.029) (Figure 1). No significant change was observed in these parameters at 3 months as compared with baseline (Table 1). In contrast, LV strain segmental score deteriorated from baseline to 3 months (4.43 ± 2.8 vs. 5.26 ± 2.3, P = 0.05) and from baseline to 6 months (4.43 ± 2.8 vs. 7.06 ± 3.8, P = 0.001) (Table 1 and Figure 1). Regarding rotational systolic LV parameters, LV twist and torsion and apical rotation increased, albeit not significantly, at 3 months compared with baseline (Table 1). Interestingly, both twist and torsion decreased from 3rd to 6th month follow-up (20.46 ± 7.87° to 16.2 ± 7.59° and 2.62 ± 1.08 to 2.02 ± 0.97°/cm, P = 0.005 and 0.004, respectively) (Table 1). Adjustment of systolic parameters for systolic and diastolic blood pressure (SBP, DBP), central aortic pressures, and the occurrence of hypertension events did not materially change these results (see Supplementary data online, Table S5).
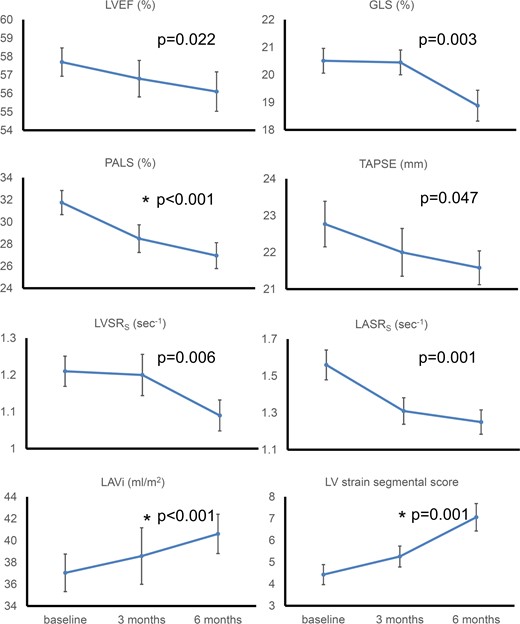
Cardiac markers change at 3 and 6 months after Kd treatment. A global deterioration of cardiac function in response to carfilzomib was observed. Absolute values are shown for GLS. P-values represent statistical significance for changes from baseline to 6 months. Values depicted are mean ± standard error. * indicates statistical significance for changes from baseline to 3 months. GLS, global longitudinal strain; LAVi, left atrial volume index; LASRS, left atrial strain rate s wave; LV, left ventricular; LVEF, left ventricular ejection fraction; LVSRS, left ventricular strain rate s wave; PALS, peak atrial longitudinal strain; TAPSE, tricuspid annulus plain systolic excursion.
Cardiac parameters change
| Baseline value (n = 48) | 3 months value (n = 29) | 6 months value (n = 45) | P-value change baseline to 6 months | P-value change baseline to 3 months | P-value change 3 to 6 months | |
|---|---|---|---|---|---|---|
| LV systolic function | ||||||
| LVEF (%), mean ± SD | 57.7 ± 5.4 | 56.78 ± 5.34 | 56.1 ± 7.19 | 0.022 | 0.086 | 0.987 |
| LV GLS (%), mean ± SD | −20.51 ± 2.78 | −20.44 ± 2.22 | −18.88 ± 3.45 | 0.003 | 0.36 | 0.028 |
| LV strain rate s wave (s−1), mean ± SD | −1.21 ± 0.26 | −1.2 ± 0.27 | −1.09 ± 0.26 | 0.006 | 0.361 | 0.068 |
| LV radial strain (%), mean ± SD | 45.88 ± 20.09 | 40.01 ± 12.94 | 38.27 ± 19.27 | 0.029 | 0.29 | 0.33 |
| LV apical rotation (o), mean ± SD | 11.83 ± 5.81 | 12.97 ± 5.72 | 11.5 ± 5.5 | 0.626 | 0.935 | 0.249 |
| LV circumferential apical strain (%), mean ± SD | −24.33 ± 7.62 | −22.23 ± 10.23 | −20.99 ± 6.87 | 0.020 | 0.503 | 0.627 |
| LV twist (o), mean ± SD | 17.66 ± 8.06 | 20.46 ± 7.87 | 16.2 ± 7.59 | 0.315 | 0.331 | 0.005 |
| LV torsion (o/cm), mean ± SD | 2.22 ± 1.11 | 2.62 ± 1.08 | 2.02 ± 0.97 | 0.326 | 0.324 | 0.004 |
| LV strain segmental score, mean ± SD | 4.43 ± 2.8 | 5.26 ± 2.3 | 7.06 ± 3.8 | 0.001 | 0.050 | 0.134 |
| LV diastolic function | ||||||
| EaAvg (cm/s), mean ± SD | 7.27 ± 1.83 | 6.81 ± 1.75 | 6.66 ± 1.65 | 0.011 | 0.608 | 0.234 |
| E/Ea, mean ± SD | 10.10 ± 3.46 | 10.81 ± 3.93 | 11.19 ± 4.14 | 0.023 | 0.087 | 0.798 |
| LV strain rate E wave (s−1), mean ± SD | 1.1 ± 0.37 | 1.01 ± 0.28 | 0.95 ± 0.36 | 0.01 | 0.16 | 0.116 |
| LA parameters | ||||||
| LAVi (mL/m2), mean ± SD | 37.04 ± 10.89 | 38.58 ± 12.43 | 40.61 ± 11.39 | <0.001 | 0.029 | 0.01 |
| PALS (%), mean ± SD | 31.75 ± 6.44 | 28.49 ± 5.85 | 26.95 ± 7 | <0.001 | 0.033 | 0.042 |
| LA strain rate s wave (s−1), mean ± SD | 1.56 ± 0.48 | 1.31 ± 0.34 | 1.25 ± 0.39 | 0.001 | 0.058 | 0.036 |
| RV function | ||||||
| RVSTDI (cm/s), mean ± SD | 13.64 ± 2.45 | 13.36 ± 2.04 | 13.53 ± 2.31 | 0.62 | 0.777 | 0.791 |
| TAPSE (mm), mean ± SD | 22.77 ± 4.29 | 22 ± 3.51 | 21.58 ± 3.1 | 0.046 | 0.589 | 0.324 |
| TR Vmax (m/s), mean ± SD | 2.65 ± 0.42 | 2.7 ± 0.41 | 2.62 ± 0.37 | 0.561 | 0.553 | 0.23 |
| RV GLS (%), mean ± SD | −22.45 ± 4.98 | −23.57 ± 3.58 | −21.86 ± 4.01 | 0.3 | 0.945 | 0.039 |
| RV free wall LS (%), mean ± SD | −28.37 ± 5.58 | −29.48 ± 3.77 | −27.02 ± 4.29 | 0.12 | 0.715 | 0.068 |
| Arterial stiffness | ||||||
| PWV (m/s), mean ± SD | 11.26 ± 2.58 | 11.82 ± 2.82 | 11.64 ± 2.42 | 0.296 | 0.965 | 0.483 |
| Endothelial function | ||||||
| FMD (%), mean ± SD | 5.44 ± 3.74 | 4.15 ± 3.54 | 4.30 ± 2.98 | 0.016 | 0.875 | 0.098 |
Continuous variables are described as mean ± SD. P-values are derived from Wilcoxon Signed Ranks Test for two related pairs. P-values <0.05 are depicted in bold. E/Ea, ratio of early diastolic transmitral flow velocity to early diastolic mitral annulus velocity; EaAvg, average nearly diastolic velocity at median mitral annulus and at lateral mitral annulus; FMD, flow mediated dilation; GLS, global longitudinal strain; LA, left atrial; LAVi, left atrial volume index; LS, longitudinal strain; LV, left ventricular; LVEF, left ventricular ejection fraction; PALS, peak atrial longitudinal strain; PWV, pulse wave velocity; RV, right ventricular; RVSTDI, systolic tricuspid annulus velocity; SD; standard deviation, TAPSE; tricuspid annulus plain systolic excursion, TR; tricuspid regurgitation
LV diastolic function
Early diastolic mitral annulus velocity (Ea) (P = 0.011), as well as early diastolic mitral flow (E)/Ea (P = 0.023) and LV strain rate E wave (LVSRE) (P = 0.01) decreased compared with baseline (Table 1). Accordingly, LA volume index (LAVi) (Figure 1) increased at 6th and 3rd month (P < 0.001 and P = 0.029, respectively). Peak atrial longitudinal strain (PALS) decreased both at 6th and 3rd month measurements (P < 0.001 and P = 0.033, respectively) while LA strain rate at reservoir function (LASRS) was reduced compared with baseline at 6th month (P = 0.001) but not at 3rd month (P = 0.058) (Table 1 and Figure 2). To further assess the direct association of treatment with LA function, we adjusted changes in LAVi and PALS for changes in LV diastolic markers (Ea, E/Ea, and LVSRE) and endothelial function as assessed by FMD. We found that LAVi and PALS changes were independent of these confounders (see Supplementary data online, Table S6). Of note, LA indices changes following carfilzomib treatment remained significant after controlling for changes in BP measurements (see Supplementary data online, Table S5).
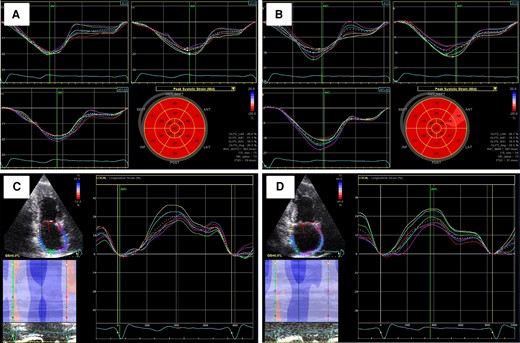
Carfilzomib-induced left ventricular and left atrial markers deterioration. GLS measurement at baseline (A) and at 6 months (B). PALS measurement at baseline (C) and at 6 months (D). GLS, global longitudinal strain; PALS, peak atrial longitudinal strain.
RV systolic function
Tricuspid annular plane systolic excursion (TAPSE) decreased (P = 0.046), whereas for the other RV function markers there was a trend towards deterioration, with RV longitudinal strain (RVLS) presenting significant reduction between 3rd and 6th month (P = 0.039) but not from baseline (Table 1).
Comparison with cardiotoxicity control MM group
By linear mixed model analysis, we found more prominent changes in LAVi, but not in GLS, in patients treated with carfilzomib compared with the cardiotoxicity control group (Figure 3).
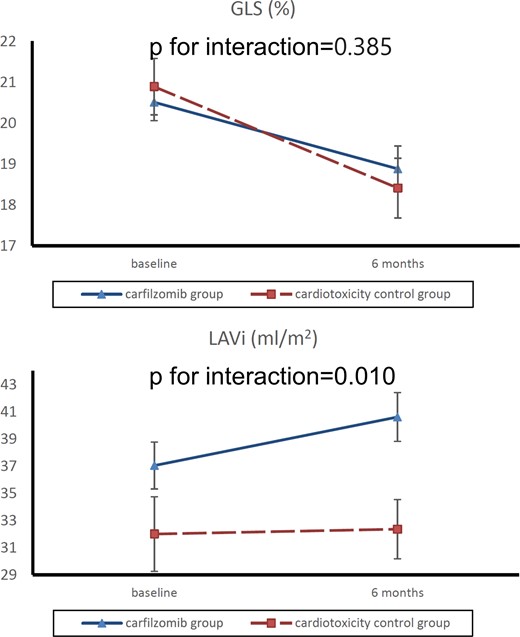
Comparison of GLS and LAVi changes from baseline to 6 months for carfilzomib and cardiotoxicity control groups. Absolute values are shown for GLS. Values depicted are mean ± standard error. GLS, global longitudinal strain; LAVi, left atrial volume index.
Association between changes in echocardiographic markers and changes in PrA and markers of inflammation and myocardial damage
Longitudinal analysis revealed significant associations between carfilzomib-induced changes in PrA and changes observed in echocardiographic markers. Univariable analysis, revealed a statistically significant association between PrA and LAVi (mean change −0.72, P = 0.012), PALS (mean change 0.948, P = 0.025), and GLS (−0.445, P = 0.016). After multivariable analysis for age, gender, SBP, and heart rate (HR) (Figure 4), these associations remained significant (P < 0.05 for all, Supplementary data online, Results). LV strain segmental score changes were also found to correlate with PrA changes from baseline to 6 months (P = 0.029) (Figure 4, Supplementary data online, Figure S2). In contrast, changes in GLS, PALS, LAVi did not correlate with fluctuations in WBC, hsCRP, and hsTnT (P > 0.05 for all). WBC count, hsCRP, and hsTnT did not change from baseline to 3 months or to 6 months (see Supplementary data online, Table S7). PWV did not change after treatment either (Table 1).
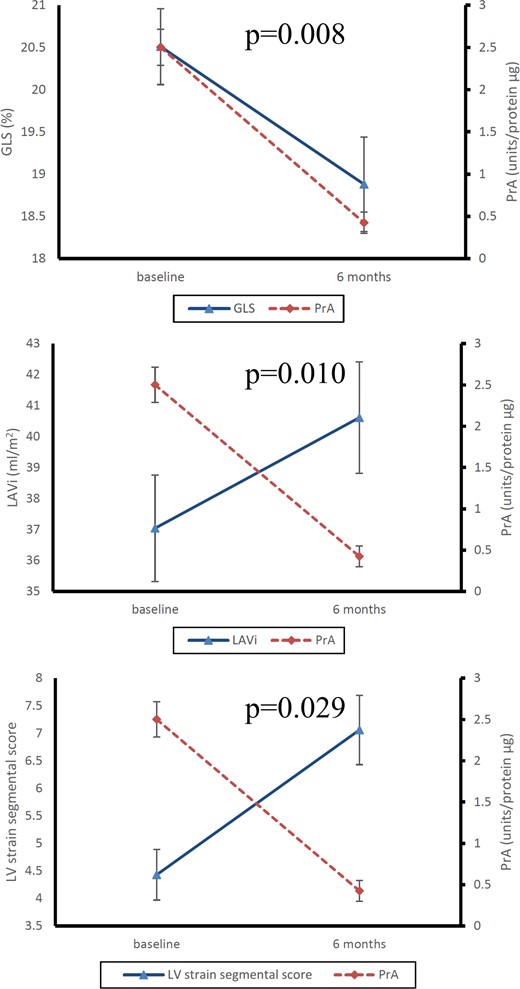
Association of GLS, LAVi and LV strain segmental score changes with PrA change from baseline to 6 months. Absolute values are shown for GLS. P-values represent statistical significance for association with PrA changes. Values depicted are mean ± standard error. GLS, global longitudinal strain; LAVi, left atrial volume index; LV, left ventricular; PrA, proteasome activity.
Association of baseline echocardiographic markers with Kd-related hypertension events
Median follow-up of the patients in the study was 10 months. Events are described in the Supplementary data online.
By Cox regression analysis, the development of new or worsening hypertension could be predicted by baseline LV diastolic dysfunction (LVDD) grade (P = 0.021; HR = 3.97, CI: 1.24–12.76) and LASRS (P = 0.040; HR = 0.12, CI: 0.002–0.87) after adjusting for age and gender. Impaired LASRS (<1.71 s−1)11 or decreased GLS (>−18%)12 was associated with higher incidence of worsening or new hypertension across the follow-up period (log rank test P = 0.015 for LASRs and log rank test P = 0.036 for GLS, respectively) (Figure 5). None of the patients with LASRS above 1.71 s−1 or GLS<−18% at baseline developed hypertension during the study.
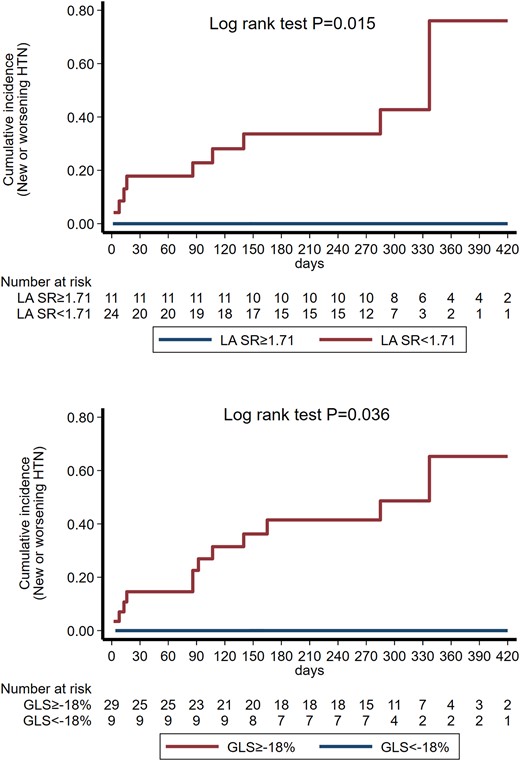
Nelson Aalen curves for the incidence of new or worsening hypertension in patients divided by baseline LASRS and GLS. GLS, global longitudinal strain; HTN, hypertension; LASRS, left atrial strain rate s wave.
Discussion
In this prospective study, we examined the effect of carfilzomib, a 2nd generation irreversible PI, on cardiac mechanics of patients with relapsed/refractory MM. To the best of our knowledge, this study presents several novel findings, i.e. (i) carfilzomib-based treatment induced a global deterioration in cardiac function starting with LA remodelling and LV strain segmental dysfunction and followed with LV and RV dysfunction; (ii) the observed changes in cardiac mechanics were independent of BP and endothelial function markers, suggesting direct associations between treatment and cardiac dysfunction, (iii) changes in cardiac mechanics correlated with PrA, also supporting a direct association of UPS inhibition with cardiac dysfunction; (iv) impaired LASRS and GLS at baseline could predict the occurrence of new or worsening hypertension in these patients, (v) we used a MM cohort receiving high dose chemotherapy previously shown to induce cardiotoxicity 6 months after treatment initiation. We found that deterioration in response to carfilzomib was more pronounced for LAVi, and similar for GLS, suggesting that carfilzomib may specifically affect LA mechanics as compared with other cardiotoxicity treatments.
The clinical value of echocardiographic monitoring in patients receiving carfilzomib is still under investigation, with limited evidence. The position statement of the Heart Failure Association, the European Association of Cardiovascular Imaging, and the Cardio-Oncology Council of the European Society of Cardiology13 advocates echocardiographic surveillance in medium-/high-risk patients receiving carfilzomib and strongly recommends prompt echocardiography in the presence of new cardiac signs or symptoms. Previous evidence indicates that LVEF, GLS, and diastolic function as assessed by transmitral flow and tissue Doppler indices deteriorate after carfilzomib containing therapeutic regimens,14–16 but a systematic approach to assess global cardiac mechanics had not been performed. Moreover, whether the observed cardiac effects of these regimens were directly associated with UPS inhibition had not been addressed. Herein, we report a decline in a broad range of echocardiographic parameters suggesting a global deteriorating effect of Kd. The correlation of these changes with PrA changes suggests that they are largely attributed to carfilzomib-induced proteasome inhibition and not to other components of Kd treatment, such as dexamethasone. Of importance, our novel findings on LA mechanics using a contemporary assessment by LA strain and strain rate revealed that LA remodelling preceded LV and RV dysfunction. This is in accordance with previous knowledge that LA dysfunction is an early finding in the processes of the failing systolic and diastolic components of the myocardium.17 Furthermore, in order to evaluate the direct association of carfilzomib with LV wall dysfunction, we implemented a score to quantify the segmental longitudinal strain impairment of LV. Interestingly, deterioration of the LV strain segmental score preceded that of GLS. This important finding coincides with early changes in LA function and structure. This direct association is further supported by a significant interaction between changes in the LV strain segmental score and changes in PrA as well as the observation that changes in cardiac markers were largely independent of changes in blood pressure and endothelial function. Overall, the observed changes in LV function might be attributed to a local effect of proteasome inhibition rather than to secondary effects through hypertension. Early LA indices impairment suggests that baseline determination and follow-up of LA strain and strain rate after carfilzomib treatment may be useful for early detection of cardiac dysfunction. Indeed, we found that a low systolic LASR was associated with development of hypertension after treatment initiation. Another point of interest is our observation of a trend for initial improvement in rotational parameters at 3 months, and subsequent deterioration later at 6 months to coincide with LVEF and longitudinal strain changes. This pattern has been previously described in patients at early stages of systolic HF,18 as well as in hypertensive cardiomyopathy19 suggesting that the observed deterioration in cardiac function may be largely driven by hypertension. However, changes in LA and LV function were independent of concordant changes in blood pressure or hypertension events. Similarly, post-treatment changes in LAVi and PALS were found to be independent of changes in LV diastolic parameters and changes in markers of endothelial dysfunction. In addition, we found that PWV as a marker of arterial stiffness did not change after treatment. Therefore, it is unlikely that the observed associations between myocardial mechanics and carfilzomib treatment to be influenced by changes in arterial stiffness. These results underpin a direct association between carfilzomib and cardiac dysfunction, which is further supported by the observed interaction between cardiac function and PrA.
The mechanisms responsible for cardiac dysfunction after partial proteasome inhibition are still under investigation. Myocardial cells’ function depends on a critical balance between protein synthesis, protein folding, and protein turnover. UPS and the autophagy-lysosome system are responsible for the degradation of damaged proteins.20 In support, accumulation of misfolded protein oligomers has been identified in patients with cardiomyopathies.3 Kostin et al.21 used explanted hearts from patients with idiopathic dilated cardiomyopathy and demonstrated a link between the UPS and autophagic cell death. Preclinical studies in mice have shown a relationship between cardiac stress and the accumulation of protein aggregates in the post-mitotic myocardial cells.2 Furthermore, pigs receiving the PI MLN-273 were found to have 77% lower cardiac proteasome chymotrypsin-like activity and significantly lower LVEF,6 whereas mice receiving carfilzomib had also lower levels of CT-L proteasomal peptidase activity in both the myocardial tissue and PBMCs and also worsening of echocardiographic markers.1,22 In our study, we described a temporal correlation between carfilzomib-induced PrA changes and echocardiographic markers of LV systolic function and LA function and size. While passive effects of increased SBP on LA function cannot be excluded, LV contractility and LA function deterioration and volume increase following PrA changes support a likely direct impact of carfilzomib-induced PrA changes on myocardial wall, since PrA association with GLS and LAVi was independent of SBP changes. This hypothesis is further strengthened by the early deterioration of segmental strain, and the cardiac function changes in response to carfilzomib independently of BP, LV diastolic function, or endothelial function changes. In contrast, cardiac injury and inflammation biomarkers did not change significantly following proteasome inhibition and neither was associated with changes in echocardiographic indices. A previous study in patients with MM treated with PIs failed to show any value of troponins’ fluctuations in predicting cardiovascular adverse events (CVAEs).23 Further research evaluating inflammation biomarkers in the setting of proteasome inhibition, using MRI examinations with T2* and LGE in addition to T1 and T2 mapping, would provide us with a more detailed understanding of carfilzomib cardiotoxicity mechanism.
The most common carfilzomib-related CVAE is hypertension, which itself can trigger other CVAEs. We found that well validated markers of diastolic and systolic cardiac function at baseline were independent predictors of incidence of hypertension. Although, previous studies have shown that some baseline cardiac characteristics have been associated with carfilzomib-related CVAEs such as LVDD and Ea,24,25 the association of more sensitive indices of cardiac function such as GLS or LA strain analysis with the occurrence of hypertension following UPS inhibition has not been previously explored. Importantly, none of our patients with LASRS or GLS beyond the identified cutoff values developed new or worsened hypertension. Thus, our results highlight the importance of thorough echocardiographic assessment integrating sophisticated speckle tracking parameters at baseline on top of traditional CV evaluation. Early detection, before overt clinical symptoms, of more advanced deterioration of cardiac mechanics, could allow close monitoring for hypertension development and early intervention, either with carfilzomib dose adjustments or with parallel pharmacotherapy (ACEis/ARBs, beta-blockers).
Conclusion
In conclusion, we found clinical evidence that UPS inhibition with an irreversible PI such as carfilzomib induces a global deterioration of cardiac function starting with LA remodelling and segmental LV dysfunction and followed by left and right ventricular dysfunction. Furthermore, the clinical utility of implementing sensitive contemporary markers of cardiac function for the prediction of development or worsening of hypertension after carfilzomib treatment is supported by the results of this study and merits further investigation. Overall, these findings provide novel mechanistic insights into the effect of proteasome inhibition on cardiac function and reveal a sequence of events in the deterioration of cardiac mechanics after UPS inhibition. This new information further highlights the possible clinical utility of detecting LA remodelling as an early marker of cardiotoxicity in patients receiving carfilzomib.
Study limitations
The main limitation of this study includes the relatively small sample size which, however, provided adequate power for assessment of cardiac changes according to our a priori sample size calculations. In addition, NT-proBNP levels were not available in this study. However, given that (i) natriuretic peptide (NP) levels are well studied after carfilzomib treatment,15,23,26 (ii) echocardiographic markers are closely associated with NP levels, and (iii) they clearly and globally changed after treatment, measuring NT-proBNP would likely add little new information regarding the association of carfilzomib with cardiac mechanics. Also, markers of inflammatory burden reflecting specific pathways, such as interleukin 6 or 1beta were not assessed. However, hsCRP is the downstream product of the cytokine cascade and it is therefore unlikely that we missed critical associations with carfilzomib-related cardiotoxicity. Finally, cardiac data after carfilzomib treatment completion were not available and therefore possible recovery of cardiac function could not be evaluated.
Supplementary data
Supplementary data are available at European Heart Journal – Cardiovascular Imaging online.
Acknowledgments
We thank Marina Karakitsou for performing the vascular tests of the study.
Funding
This study was supported by Amgen and by institutional funding to E.K., I.P.T., K.S., and M.-A.D.
Data availability
The data underlying this article will be shared on reasonable request to the corresponding author.
References
Author notes
Nikolaos Makris and Georgios Georgiopoulos equal authorship.
Efstathios Kastritis and Kimon Stamatelopoulos equal senior authors.
Conflict of interest: E.K. Janssen: consultancy, honoraria, other: travel/accommodations/expenses, research funding; Pfizer: consultancy; Genesis Pharma: consultancy, honoraria, other: travel/accommodations/expenses; Amgen: consultancy, honoraria, research funding; Takeda: consultancy, honoraria, other: travel/accommodations/expenses. E.T. Janssen: honoraria, other: travel expenses, research funding; Takeda: honoraria, other: travel expenses, research funding; Celgene: honoraria; Medison: honoraria; Amgen: honoraria, research funding; Genesis: honoraria, other: travel expenses, research funding. K.S. Amgen: honoraria. M.-A.D. BMS: consultancy, membership on an entity's Board of Directors or advisory committees, other: personal fees; Celgene: consultancy, honoraria, membership on an entity's Board of Directors or advisory committees, other: personal fees, speakers bureau; Takeda: consultancy, honoraria, membership on an entity's Board of Directors or advisory committees, other: personal fees, research funding, speakers bureau; Janssen: consultancy, honoraria, membership on an entity's Board of Directors or advisory committees, other: personal fees, research funding, speakers bureau; Amgen: consultancy, honoraria, membership on an entity's Board of Directors or advisory committees, other: personal fees, research funding, speakers bureau. The remaining authors have nothing to disclose.
