


Abstract
The role of coronary artery calcium score (CACS) in predicting cardiovascular disease (CVD) and non-CVD mortality in young adults is unclear. We investigated the association of CACS with CVD and non-CVD mortality in young and older individuals.
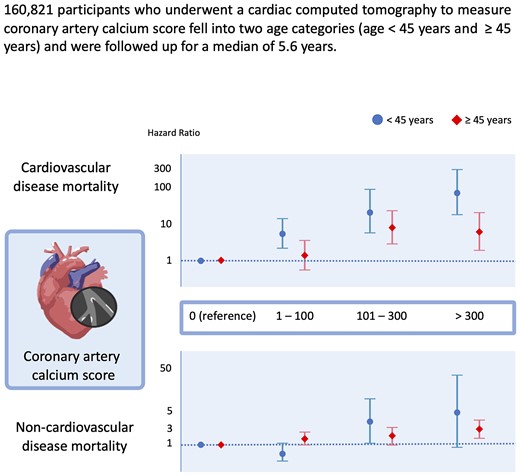
CVD-free Koreans (n = 160 821; mean age, 41.4 years; 73.2% young individuals aged <45 years) who underwent cardiac tomography estimation of CACS (69.7% one-time measurement), were followed-up for a median of 5.6 years. The vital status and cause of death were ascertained from the national death records. Sub-distribution hazard ratios (SHR) and 95% confidence intervals (CIs) for cause-specific mortality were estimated using the Fine and Gray proportional hazards models. Overall, a higher CACS was strongly associated with an increased risk of CVD mortality. Among young individuals, multivariable-adjusted SHR (95% CIs) for CVD mortality comparing a CACS of 1–100, 101–300, and >300 to 0 CACS were 5.67 (2.33–13.78), 22.34 (5.72–87.19), and 74.1 (18.98–239.3), respectively, and among older individuals, corresponding SHR were 1.51 (0.60–3.84), 8.57 (3.05–24.06), and 6.41 (1.98–20.74). The addition of CACS to Framingham risk score significantly but modestly improved risk prediction for CVD mortality in young individuals. Conversely, CACS was significantly associated with non-CVD mortality only in older individuals.
Strong associations of CACS with CVD mortality, but not non-CVD mortality, were observed in young individuals, beginning in the low CACS category. Our findings reaffirm the need for early intervention for young adults even with low CACS to reduce CVD mortality.
See the editorial comment for this article ‘Current role of coronary calcium in younger population and future prospects with photon counting technology’, by F. Cademartiri and P. Maurovich-Horvat, https://doi.org/10.1093/ehjci/jeac214.
Introduction
The incidence of cardiovascular disease (CVD) in young adults has been increasing over the past few decades despite the great efforts to prevent atherosclerotic CVD.1 Moreover, awareness and assessment of cardiovascular risk in young adults remain less ideal, although an early risk assessment and prevention are considered important.2,3 According to the traditional CVD risk assessment tools, which are largely affected by age, younger individuals are typically estimated to have a low 10-year risk of CVD despite the presence of unfavourable cardiovascular risk factors and an elevated lifetime risk of CVD.3,4 This possibly leads to the loss of opportunity in this young group who might benefit from aggressive preventive measures such as statin therapy.
Coronary artery calcium score (CACS), a reliable measure of coronary atherosclerosis, is well known as an independent predictor of future cardiovascular events.5 Intriguingly, recent studies have suggested that CACS can also predict non-CVD health outcomes such as cancer, chronic kidney disease, chronic pulmonary obstructive disease, dementia, and all-cause and non-CVD mortality.6–8 However, despite growing evidence of the relationship of CACS with cardiovascular and non-cardiovascular outcomes, the predictive role of CACS in CVD and non-CVD risk in the young population has not been well elucidated. Furthermore, most CACS studies included mainly Caucasians and a few individuals of other ethnicities; thus, the predictive role of CACS in different ethnic young adults, including East Asians, is unknown.9,10
Therefore, we evaluated the association between CACS and cause-specific mortalities, including CVD mortality, in young and older adults who measured CACS as a part of a routine health-screening programme.
Methods
Study population
This study was part of the Kangbuk Samsung Health Study—a cohort study of Korean men and women (age: ≥18 years) who underwent a comprehensive annual or biennial health examination at the Kangbuk Samsung Hospital Total Healthcare Centers in Seoul and Suwon, South Korea as previously described.11,12
Participants who underwent a cardiac computed tomography (CT) for the measurement of CACS as part of a comprehensive health examination from January 2010 to December 2020 (n = 167 743) were eligible for this study. A total of 6922 participants who met one or more of the following criteria at baseline were excluded: missing data on age and body mass index (BMI; n = 126), a history of CVD (n = 2271), and a history of cancer (n = 4642). Finally, 160 821 individuals were included in the study. History of CVD was defined based on participants’ reports of physician-diagnosed CVD including angina/myocardial infarction and stroke (ischaemic or haemorrhagic) using a standardized self-administered questionnaire. The study was approved by the Institutional Review Board of Kangbuk Samsung Hospital (IRB No. 2020-03-019). The requirement for informed consent was waived because we used de-identified data routinely collected as a part of health-screening examinations and already linked to the mortality data from the Korea National Statistical Office (KNSO).
Measurements
Data on lifestyle factors, educational level, medical and medication history, and first-degree family history of CVD and cancer were collected by standardized, self-administered questionnaires as well as anthropometric parameters, blood pressure, and blood sampling was measured by trained nurses or technicians (further details in Supplementary data online).11
Coronary artery calcium score
Coronary artery calcification was detected using a Lightspeed VCT XTe-64 slice multi-detected CT scanner (GE Healthcare, Tokyo, Japan) with the same standard scanning protocol11 of 2.5-mm thickness, 400-ms rotation time, 120-kV tube voltage, and 124-mAS (310 mA × 0.4 s) tube current under electrocardiogram-gated dose modulation without the use of intravenous contrast medium. To reduce motion artefacts from breathing and improve image quality, participants were instructed to hold their breath at the end of inspiration during cardiac scans. The CACS was initially analysed through a semi-automatic methodology by well-trained technicians using the ‘GE Smartscore’ software. Reconstructed images in a 512 × 512 matrix in the axial plane and those with labelling in the area of CAC using the standard minimum calcium threshold of 130 Hounsfield units were confirmed by experienced radiologists. CACS was calculated using the Agatston units. The inter- and intra-observer reliability for CACS was excellent (intra-class correlation coefficient: 0.99).11 CACS was categorized into 0, 1–100, 101–300, and >300.13,14
Mortality follow-up
Vital status until the end of 2020 was ascertained through linkage to the nationwide death certificate data from the KNSO. The cause of death was classified according to the International Classification of Diseases and Related Health Problems Tenth Revision (ICD-10). Patient diagnoses in the medical utilization data were compared with the cause of death on the death certificate, and the overall accuracy of the stated cause of death was found to be 91.9% for all-cause deaths and 94.9% for cancer deaths.15,16 Cause-specific mortality was classified as CVD mortality (ICD codes: I00–I99), ischaemic heart disease (IHD) mortality (ICD codes: I20–I25), lung cancer mortality (ICD codes: C33, C34), and cancer mortality (ICD codes: C00–C97). Deaths, except ICD-10 codes I00–I99, were defined as non-CVD mortality.
Statistical analyses
The primary endpoints were CVD and non-CVD mortality, including cancer mortality. Each participant was followed-up from their baseline examination until either death or the last examination conducted before December 31, 2020, whichever came first. The mortality rate was calculated as the number of deaths divided by the number of person-years of follow-up. Hazard ratios (HRs) and 95% confidence intervals (CIs) for mortality were estimated using the Cox proportional hazards regression model using age as the timescale. This approach effectively controlled for age. To account for the competing risks of CVD and non-CVD mortality and cancer mortality from non-cancer mortality, sub-distribution HRs (SHR) were estimated based on a competing risk analysis using the Fine and Gray proportional hazard model.17 The proportional hazards assumption was assessed by examining graphs of the estimated log [–log (SURVIVAL)].
The multivariable models were adjusted for age (timescale), sex, centre, year of screening examination, education level, smoking status, alcohol intake, regular exercise, BMI, history of diabetes, history of hypertension, family history of CVD (only for all-cause and CVD mortality), family history of cancer, HOMA-IR, medication for dyslipidaemia, systolic blood pressure, low-density lipoprotein cholesterol, high-density lipoprotein cholesterol, triglyceride, and glucose.
Since previous epidemiologic studies regarding CVD events specified young adults under the age of 45 years, we performed subgroup analysis by age (<45 and ≥45 years).18 Framingham risk score (FRS) was also divided by 10% and analysed the association between CACS categories and mortality. The predictive performance of the FRS and the addition of CACS for CVD and IHD mortality, separately in each model, were determined using the area under the receiver operating characteristics (AUROC).19 In addition, we performed stratified analyses by sex.
Statistical analysis was performed using STATA version 16.0, software (StataCorp LP, College Station, TX, USA). All P-values were two-tailed. A P-value of <0.05 was considered statistically significant.
Results
The mean (standard deviation) age of the 160 821 individuals was 41.4 (8.7) years. The proportion of young adults aged <45 years was 73.2% (Table 1 and Supplementary data online, Table S1). The number of participants with 1–100, 101–300, and >300 of CACS at the baseline was 17 087 (10.6%), 2648 (1.6%), and 1433 (0.9%), respectively. CACS was positively associated with age, male sex, current smoking status, BMI, physical activity, alcohol intake, diabetes, hypertension, family history of coronary heart disease, worse lipid profile, and higher high-sensitivity C-reactive protein, and HOMA-IR in both the young and older groups.
Age-specific baseline characteristics of the study population according to coronary artery calcium score category
| Characteristics | Overall | CACS category | P for trend | |||
|---|---|---|---|---|---|---|
| 0 | >0–100 | 101–300 | >300 | |||
| Age <45 years, n | n = 117 728 | n = 109 917 | n = 7155 | n = 522 | n = 134 | |
| Age (years)a | 37.3 (4.6) | 37.1 (4.6) | 39.7 (3.8) | 40.8 (3.1) | 40.8 (3.0) | <0.001 |
| Male (%) | 76.7 | 75.4 | 94.5 | 97.7 | 98.5 | <0.001 |
| Alcohol intake (%)b | 24.7 | 24.1 | 33.1 | 37.0 | 37.8 | <0.001 |
| Regular exercise (%)c | 12.8 | 12.7 | 14.1 | 16.7 | 16.9 | <0.001 |
| Lipid-lowering drugs (%) | 2.2 | 1.8 | 6.5 | 12.5 | 21.8 | <0.001 |
| Traditional risk factors | ||||||
| Current smoking (%) | 22.3 | 21.5 | 33.3 | 38.6 | 42.8 | <0.001 |
| Diabetes (%) | 3.3 | 2.8 | 9.0 | 12.5 | 23.9 | <0.001 |
| Hypertension (%) | 11.5 | 10.4 | 25.7 | 41.8 | 50.0 | <0.001 |
| Dyslipidaemia (%) | 41.5 | 40.1 | 61.7 | 63.2 | 67.9 | <0.001 |
| Family history of CHD (%) | 6.2 | 6.1 | 8.5 | 9.2 | 11.3 | <0.001 |
| Number of risk factors | <0.001 | |||||
| 0 | 41.2 | 42.9 | 18.5 | 13.1 | 7.6 | |
| 1 | 37.4 | 37.4 | 39.3 | 34.1 | 26.7 | |
| 2 | 17.1 | 16.1 | 29.9 | 32.7 | 38.9 | |
| ≥3 | 4.3 | 3.6 | 12.4 | 20.2 | 26.7 | |
| Framingham risk score, % | ||||||
| <10 | 96.4 | 97.1 | 87.4 | 79.1 | 70.2 | |
| 10–19 | 3.4 | 2.7 | 11.5 | 17.8 | 26.0 | |
| ≥20 | 0.2 | 0.2 | 1.0 | 3.1 | 3.8 | |
| Age ≥45 years, n | n = 43 093 | n = 29 736 | n = 9 932 | n = 2 126 | n = 1 299 | |
| Age (years)a | 52.7 (7.0) | 51.3 (5.9) | 54.7 (7.6) | 58.1 (8.5) | 61.7 (8.6) | <0.001 |
| Male (%) | 67.7 | 61.6 | 80.5 | 82.7 | 85.5 | <0.001 |
| Alcohol intake (%)b | 29.0 | 26.1 | 34.7 | 36.8 | 39.3 | <0.001 |
| Regular exercise (%)c | 17.7 | 16.8 | 18.9 | 21.2 | 23.4 | <0.001 |
| Lipid-lowering drugs (%) | 10.6 | 7.6 | 14.9 | 21.8 | 27.2 | <0.001 |
| Traditional risk factors | ||||||
| Current smoking (%) | 22.8 | 21.0 | 27.1 | 27.9 | 23.6 | <0.001 |
| Diabetes (%) | 12.6 | 8.7 | 18.1 | 27.3 | 35.1 | <0.001 |
| Hypertension (%) | 28.6 | 21.3 | 40.5 | 52.8 | 65.6 | <0.001 |
| Dyslipidaemia (%) | 46.4 | 43.7 | 53.3 | 51.3 | 48.7 | <0.001 |
| Family history of CHD (%) | 8.0 | 7.7 | 8.8 | 8.2 | 8.0 | 0.028 |
| Number of risk factors | <0.001 | |||||
| 0 | 27.6 | 33.4 | 16.2 | 11.9 | 8.9 | |
| 1 | 37.9 | 38.6 | 37.5 | 32.9 | 30.8 | |
| 2 | 24.4 | 20.9 | 31.1 | 34.6 | 35.9 | |
| ≥3 | 10.1 | 7.1 | 15.2 | 20.6 | 24.4 | |
| Framingham risk score, % | ||||||
| <10 | 65.4 | 75.0 | 49.3 | 34.0 | 22.2 | |
| 10–19 | 25.6 | 20.4 | 36.2 | 40.4 | 40.1 | |
| ≥20 | 9.0 | 4.7 | 14.5 | 25.7 | 37.8 | |
CACS, coronary artery calcium score; CHD, coronary heart disease.
Data are presented as mean (standard deviation), or percentage.
≥20 g of ethanol per day.
≥3 times/week.
During a median follow-up period of 5.6 years (interquartile range, 3.3–8.2 years; maximum, 10.8 years), there were 470 all-cause deaths (all-cause mortality rate, 0.51/103 person-years), 73 CVD deaths (CVD mortality rate, 0.08/103 person-years), and 201 cancer deaths (cancer mortality rate, 0.22/103 person-years) (see Supplementary data online, Table S2). Associations of the CACS categories with increased risk of CVD, including IHD, non-CVD, and cancer mortality, were consistently observed. In competing risk analysis (Table 2), multivariable-adjusted SHR (95% CIs) for CVD mortality, comparing a CACS of 1–100, 101–300, and >300 to 0 CACS, were 3.75 (1.82–7.75), 16.33 (6.48–41.14), and 18.55 (6.12–56.25), respectively. Meanwhile, a significant association of CACS with non-CVD and cancer mortality was observed among individuals with a CACS of >100 and >300, respectively. In analyses stratified by age groups (Table 2 and Supplementary data online, Table S3), significant associations of CACS with all-cause and cause-specific mortality were consistently observed among individuals aged ≥45 years, whereas, among young adults aged <45 years, CACS was significantly associated with an increased risk of CVD, but not non-CVD mortality. Among all the cancer mortality cases (n = 201), 38 (18.9%) participants died from lung cancer, the most common cause of cancer mortality in this study, and the risk of lung cancer mortality was significantly higher only in adults aged >45 years with CACS >300 (see Supplementary data online, Table S3). Notably, the excess risk of CVD mortality increased from CACS 1 to 100 in younger individuals. Among young individuals, the multivariable-adjusted SHR (95% CI) for CVD mortality comparing a CACS of 1–100, 101–300, and >300 to 0 CACS were 5.67 (2.33–13.78), 22.34 (5.72–87.19), and 74.1 (18.98–239.3), respectively, and among older individuals, corresponding HR (95% CI) were 1.51 (0.60–3.84), 8.57 (3.05–24.06), and 6.41 (1.98–20.74), respectively.
Sub-distribution hazard ratios (95% ci) for cardiovascular disease, non-cardiovascular disease and cancer mortality according to coronary artery calcium score category using competing risk analysis
| CACS categories | Sub-distribution hazard ratios (95% CI)a | ||
|---|---|---|---|
| CVD mortality | Non-CVD mortality | Cancer mortality | |
| Overall | |||
| 0 | 1.00 (reference) | 1.00 (reference) | 1.00 (reference) |
| >0–100 | 3.75 (1.82–7.75) | 1.19 (0.91–1.55) | 1.13 (0.79–1.63) |
| 101–300 | 16.33 (6.48–41.14) | 1.58 (1.01–2.48) | 1.36 (0.74–2.47) |
| >300 | 18.55 (6.12–56.25) | 2.40 (1.53–3.77) | 2.46 (1.36–4.46) |
| P for trend | <0.001 | <0.001 | 0.008 |
| Age <45 years | |||
| 0 | 1.00 (reference) | 1.00 (reference) | 1.00 (reference) |
| >0–100 | 5.67 (2.33–13.78) | 0.39 (0.14–1.06) | 0.29 (0.04–2.03) |
| 101–300 | 22.34 (5.72–87.19) | 3.44 (1.08–10.89) | — |
| >300 | 74.1 (18.98–289.30) | 5.49 (0.71–42.28) | — |
| P for trend | <0.001 | 0.865 | 0.174 |
| Age ≥45 years | |||
| 0 | 1.00 (reference) | 1.00 (reference) | 1.00 (reference) |
| >0–100 | 1.51 (0.60–3.84) | 1.34 (0.99–1.81) | 1.19 (0.80–1.77) |
| 101–300 | 8.57 (3.05–24.06) | 1.47 (0.91–2.35) | 1.34 (0.72–2.49) |
| >300 | 6.41 (1.98–20.74) | 2.30 (1.44–3.68) | 2.35 (1.29–4.30) |
| P for trend | <0.001 | 0.001 | 0.012 |
CI, confidence interval; CVD, cardiovascular disease; HDL-C, high-density lipoprotein cholesterol; HOMA-IR, homeostasis model assessment of insulin resistance; LDL-C, low-density lipoprotein cholesterol.
Fine and Gray proportional hazard model with age as a time scale was used to estimate sub-distribution hazard ratios and 95% confidence intervals (CIs). The model was adjusted for age (timescale), sex, centre, year of examination, smoking status, alcohol consumption, physical activity, body mass index, education level, history of diabetes, history of hypertension, family history of CVD (only for CVD mortality), family history of cancer, HOMA-IR, lipid-lowering medication, systolic blood pressure, LDL-C, HDL-C, triglycerides, and glucose.
In CVD risk-stratified analysis based on the FRS, a strong association between CACS and CVD mortality was consistently observed among young individuals with a 10-year CVD risk of <10% (Table 3). None of those with FRS >10% and 0 CACS among older individuals developed CVD mortality. In the AUROC analysis, the addition of CAC to the FRS significantly but modestly improved the prediction of CVD and IHD mortality in young adults. A similar tendency was observed in older individuals, but it did not reach statistical significance (see Supplementary data online, Table S4).
Hazard ratios (95% ci) for cardiovascular disease according to coronary artery calcium score category by cardiovascular disease-risk stratification based on Framingham risk score and different age strata
| CACS categories | FRS <10% (n = 136 603) | FRS≥10% (n = 17 888) | ||||||
|---|---|---|---|---|---|---|---|---|
| Person-years (PY) | Number of events | Mortality rate (103/PY) | Multivariable-adjusted HRa (95% CI) | Person-years (PY) | Number of events | Mortality rate (103/PY) | Multivariable-adjusted HRa (95% CI) | |
| Age < 45 | ||||||||
| 0 | 590 819 | 16 | 0.03 | 1.00 (reference) | 21 008 | 2 | 0.10 | 1.00 (reference) |
| >0–100 | 35 203 | 8 | 0.23 | 5.71 (2.34–13.96) | 5 735 | 2 | 0.35 | 3.10 (0.43–22.46) |
| 101–300 | 2321 | 2 | 0.86 | 21.41 (4.58–100.06) | 724 | 1 | 1.38 | 11.43 (0.94–138.47) |
| >300 | 523 | 3 | 5.74 | 139.86 (36.35–538.14) | 249 | — | — | — |
| P for trend | <0.001 | 0.132 | ||||||
| Age ≥45 | ||||||||
| 0 | 113 759 | 12 | 0.11 | 2.98 (0.38–23.42) | 40 141 | — | — | — |
| >0–100 | 24 337 | 1 | 0.04 | 1.00 (reference) | 25 510 | 5 | 0.20 | 1.00 (reference) |
| 101–300 | 3312 | 3 | 0.91 | 18.17 (1.86–177.46) | 6281 | 8 | 1.27 | 3.41 (1.04–11.18) |
| >300 | 1243 | — | — | — | 4183 | 5 | 1.20 | 3.36 (0.91–12.37) |
| P for trend | 0.525 | <0.001 | ||||||
CACS, coronary artery calcium score; CI, confidence interval; CVD, cardiovascular disease; FRS, Framingham risk score; HOMA-IR, homeostasis model assessment of insulin resistance; HDL-C, high-density lipoprotein cholesterol; HR, hazard ratio; LDL-C, low-density lipoprotein cholesterol; PY, person-years.
Estimated using the Cox proportional hazard model with age as a timescale to estimate hazard ratios (HRs) and 95% confidence intervals (95% CIs). The multivariable model was adjusted for age (timescale), sex, centre, year of screening examination, smoking status, alcohol consumption, physical activity, body mass index, education level, history of diabetes, history of hypertension, family history of CVD, HOMA-IR, medication for dyslipidaemia, systolic blood pressure, LDL-C, HDL-C, triglyceride, and glucose.
In sex-stratified analyses, the overall mortality rate was lower in women than in men (0.41 per 103 person-years vs. 0.54 per 103 person-years) (see Supplementary data online, Table S5). This pattern was similarly observed in individuals with zero CAC (0.30 vs. 0.36 per 103 person-years), but not in those with non-zero CAC (1.94 vs. 1.58 per 103 person-years). However, there was no significant interaction between sex and CACS categories for all-cause, CVD, IHD, non-CVD, and cancer mortality.
Discussion
In this large cohort study of relatively young individuals without CVD and cancer at baseline, higher CACS was independently associated with CVD and non-CVD mortality in a dose–response manner. The strong association of CACS with IHD and CVD mortality was pronounced in young individuals aged <45 years and the excess risk began in the low level of the CACS category. This strong association was consistently observed in young individuals with a 10-year CVD risk of <10%; furthermore, the addition of CACS to the FRS significantly but modestly improved risk prediction for CVD mortality in young individuals. Meanwhile, a moderate association of CACS with non-CVD mortality was observed only in older individuals but not in young individuals.
Despite consistent reporting on the association between increasing CAC and CVD mortality,8,20–22 studies in young or low-risk populations are limited.23–25 A cohort study of adults aged 30–49 years showed an association between CAC and risk of major adverse cardiovascular events and all-cause mortality, but not for CVD mortality due to a low number of deaths attributable to cardiac causes (n = 30).23 The long-term CAC consortium studies of young adults that were referred due to major CVD risk factors (mainly either hyperlipidaemia or a family history of CVD) showed an association between elevated CACS and increased risk of coronary heart disease and CVD death.21,24 Our study is by far the largest cohort study to investigate the association of CACS with both CVD and cause-specific mortality in a real-world screening setting of young East Asians.
Another clinical consideration in CACS measurement, except for applicable age, is how low or minimal CACS levels are associated with CVD mortality. We found a significant association between a CACS of 1–100 and increased CVD mortality, particularly in young adults. This suggests that the implications of CAC may differ in young adults, and CAC in this population may be reflective of plaque instability.26 Therefore, young adults with low-grade CACS may benefit from more aggressive intervention to reduce CVD mortality. Although CACS measurement is recommended for individuals at intermediate risk, the significantly elevated risk of CVD has been reported even in low-risk groups with no risk factors other than CAC. In the Walter Reed Cohort Study, the presence and severity of CAC were independently predictive of CVD events in participants without conventional risk factors.22 Traditional CVD risk assessment tools, including FRS and other global risk scores, are largely age-dependent with the potential for misclassifying young individuals with a high burden of coronary atherosclerosis into low-risk groups.27,28 In addition, a CACS of 0 is considered the best negative risk marker for CVD risk assessment.3 Our findings showed a consistently low CVD mortality rate in individuals with a CACS of 0 regardless of age or FRS, further supporting the potential utility of CACS in estimating the CVD mortality risk in individuals who would otherwise be considered eligible for statin therapy. Furthermore, CAC, the most common incidental finding on a chest CT scan performed for other purposes such as lung cancer screening, may provide an opportunity for employing risk assessment and intervention.29 Further research is needed to identify individuals that would benefit most from CAC-based risk stratification and intervention among young adults or those classified as a low-risk group based on conventional risk factors.
We also observed a positive dose–response relationship between non-CVD mortality, including lung cancer and other cancer mortality, and CACS only in individuals aged ≥45 years, which is in line with the previous result of the Multi-Ethnic Study of Atherosclerosis.30 This finding can be attributed to the shared risk factors of CVD and cancers. CACS not only reflects lifetime exposure to common risk factors for CVD and non-CVD outcomes, but also common underlying vulnerabilities for the development of tissue injury.7 The lack of association between cancer mortality and CACS in young individuals is thought to be attributable to insufficient follow-up or a greater contribution of genetic factors at a younger age and of lifestyle factors at an older age.21 For example, age <45 years may be earlier than the typical age at which cancer develops; cancer-related deaths can occur even later. Furthermore, although many cancers share common risk factors for CVD,31 cancers in young adults may reflect different pathophysiologies and are more likely to be attributed to genetic factors than in older adults. As CAC is considered to accumulate pathological changes according to measured and unmeasured risk factors for CVD, it may contribute to and possibly predict cancer occurrence in later ages.
Several limitations should be considered when interpreting our findings. First, with a limited number of participants with repeated CAC testing and other CVD risk factors during follow-up (30.3% of study participants), we could not consider the potential effect of changes in lifestyle factors and medical treatments (e.g. statin use) on the association between baseline CAC and mortality. CAC scanning has been reported to affect patients’ CVD risk factors and medication use (e.g. statins).32,33 Since participants were informed of the results of the CACS test, and those with a baseline positive CACS were more likely to change their unfavourable behaviours and adopt preventive measures, possibly leading to attenuation of the association between CACS and cause-specific mortality. Second, data on cardiovascular events were not available, limiting our ability to comprehensively evaluate the usefulness of CACS for risk stratification and its impact on CVD outcome given that CVD mortality is a part of total CVD events. Finally, the majority of participants in this study was young to middle-aged healthy Korean individuals who participated in regular health-screening examinations with easy access to health care resources. Hence, our results may not be generalizable to other age groups, ethnic groups, or populations with different demographics.
Conclusions
Our study demonstrated the age-stratified risks for CVD and non-CVD mortality of coronary artery calcification, suggesting the need for an age-specific stratified prevention strategy. Even young and low-risk adults should be the main target for primary CVD prevention if coronary artery calcification presents, while older adults with coronary artery calcification require simultaneous and integrative prevention strategies for non-CVD mortality in addition to CVD mortality.
Supplementary material
Supplementary materials are available at European Heart Journal—Cardiovascular Imaging online.
Acknowledgements
Y.C. and S.R. planned, designed, and directed the study, including quality assurance and control. S.R. analysed the data and designed the analytic strategy of the study. Y.C. and S.R. supervised the field activities. All authors conducted a literature review and prepared the Materials and Methods and Discussion sections of the text. J.K., S.K., and Y.C. drafted the manuscript. All authors interpreted the results and contributed to the critical revision of the manuscript. All authors have read and approved the final manuscript.
Funding
This study was supported by SKKU Excellence in Research Award Research Fund, Sungkyunkwan University, 2020.
Patient and public involvement
Patients and/or the public were not involved in the design, conduct, reporting, or dissemination plans of this research.
Patient consent for publication
The requirement for informed consent was waived because we used de-identified data routinely collected as a part of health-screening examinations and already linked to the mortality data from the Korea National Statistical Office (KNSO).
Ethics approval
The study was approved by the Institutional Review Board of Kangbuk Samsung Hospital (IRB No. 2020-03-019).
Provenance and peer review
Not commissioned; externally peer-reviewed.
Data availability
The data are not available to be shared publicly as we do not have IRB permission for distributing the data. However, supporting information or data is available from the corresponding author at a reasonable request.
References
Author notes
Jeonggyu Kang and Seolhye Kim contributed equally to this work.
Conflict of interest: None declared.
