


Abstract
Differentiating exudative from transudative effusions is clinically important and is currently performed via biochemical analysis of invasively obtained samples using Light’s criteria. Diagnostic performance is however limited. Biochemical composition can be measured with T1 mapping using cardiovascular magnetic resonance (CMR) and hence may offer diagnostic utility for assessment of effusions.
A phantom consisting of serially diluted human albumin solutions (25–200 g/L) was constructed and scanned at 1.5 T to derive the relationship between fluid T1 values and fluid albumin concentration. Native T1 values of pleural and pericardial effusions from 86 patients undergoing clinical CMR studies retrospectively analysed at four tertiary centres. Effusions were classified using Light’s criteria where biochemical data was available (n = 55) or clinically in decompensated heart failure patients with presumed transudative effusions (n = 31). Fluid T1 and protein values were inversely correlated both in the phantom (r = −0.992) and clinical samples (r = −0.663, P < 0.0001). T1 values were lower in exudative compared to transudative pleural (3252 ± 207 ms vs. 3596 ± 213 ms, P < 0.0001) and pericardial (2749 ± 373 ms vs. 3337 ± 245 ms, P < 0.0001) effusions. The diagnostic accuracy of T1 mapping for detecting transudates was very good for pleural and excellent for pericardial effusions, respectively [area under the curve 0.88, (95% CI 0.764–0.996), P = 0.001, 79% sensitivity, 89% specificity, and 0.93, (95% CI 0.855–1.000), P < 0.0001, 95% sensitivity; 81% specificity].
Native T1 values of effusions measured using CMR correlate well with protein concentrations and may be helpful for discriminating between transudates and exudates. This may help focus the requirement for invasive diagnostic sampling, avoiding unnecessary intervention in patients with unequivocal transudative effusions.
Introduction
Pericardial and pleural effusions are common in clinical practice1,2 and understanding the etiology is fundamental to treatment of both the underlying disease and the effusion. Transudates are often best managed medically with diuretics with no requirement for invasive drainage; however, exudates commonly require further microbiological and cytological analysis. Discriminating between transudates and exudates involves biochemical analysis of fluid obtained via pericardiocentesis or thoracocentesis—invasive procedures with inherent clinical risk.3,4 Light’s criteria5 is currently the gold standard method for differentiating effusion types and is used for both pericardial and pleural fluid evaluation, although only validated for pleural effusions.6 Misclassification is common7,8 with 15–30% of transudates misclassified as exudates,9 resulting in additional unnecessary investigations and delays to appropriate treatment.
Non-invasive assessment of effusions using imaging may offer insights into fluid composition, and thereby avoid invasive testing—particularly where further diagnostic analysis (including cytological or microbiological assessment) is not required. Computed tomography (CT) has shown good accuracy for discrimination between transudative and exudative effusions of both pleural and pericardial type using attenuation values or Hounsfield Unit (HU)10,11; however, magnetic resonance imaging (MRI) has not been used.
The value of cardiac magnetic resonance (CMR) for tissue characterization to aid diagnosis and guide management is increasingly recognized, particularly for investigation of heart failure.12 Parametric mapping techniques (including T1 mapping) are now commercially available and recommended across an expanding range of indications.13,14 The T1 (longitudinal relaxation time) changes with water content and the local macromolecular environment,15 and mapping displays values in a pixel-wise colour map. Serum T1 relaxation time is known to be influenced by total protein levels in phantom models,16 with an inverse linear relationship between serum protein and T1.17 Recently, native T1 mapping has been shown to provide information on blood composition, with anemia and iron deficiency being associated with increased blood T1 values.18
We hypothesize that T1 values correlate with protein composition of effusions, potentially helping to differentiate transudates from exudates. First, we estimate the relationship between T1 values and protein concentrations in vitro using a phantom, and then validate this relationship in clinical data from patients with effusions. Finally, we assess the diagnostic accuracy of CMR-derived T1 values for discrimination between transudative and exudative effusions.
Methods
Effect of protein concentration on fluid T1 mapping values: phantom validation
We designed and created a custom phantom to evaluate the relationship between fluid T1 values and protein concentration. Human albumin 20% solution (Zenalb®) containing 200 g/L of protein was serially diluted in distilled water, resulting in four different concentrations of albumin solution—25 g/L, 50 g/L, 100 g/L, and 200 g/L. Syringes filled with the different concentrations of albumin were then immersed in 2 L of water containing 2 mL (279.32 mg/mL) of Gadoterate meglumine (Gd-DOTA marketed as Dotarem, Guerbet S.A., Paris, France) to create background contrast. The test was performed twice with the syringes immersed in water at different temperatures, 18°C and at 39.3°C (close to body temperature). The phantom was placed in a 1.5 T MR scanner (Magnetom Aera; Siemens Medical Solutions, Erlangen, Germany) and T1 mapping was performed using a single-shot steady-state free-precession (SSFP)-based MOdified Look-Locker Inversion Recovery (MOLLI) with a 5s(3s)3s sampling protocol.15 No adjustment of the MOLLI sequence was required in the phantom at the evaluated temperatures, despite the prolonged T1 time.
Study population
Consecutive patients who had undergone clinical CMR with T1 mapping and drainage of pleural and/or pericardial effusions for diagnostic and/or therapeutic purposes between October 2015 and November 2020 at four tertiary referral centres in London (Barts Heart Centre, The Royal Free Hospital, Imperial College and King’s College Hospital) were identified retrospectively. Effusions were evaluated according to Light’s criteria5 and classified as an exudate if one or more of the following parameters were met: fluid total protein: serum total protein ratio >0.5, fluid LDH: serum LDH ratio >0.6, and fluid LDH greater than two-thirds of the upper limit of normal LDH (480 IU/L at our institutions). In cases of discrepancy between biochemical parameters, the final diagnosis was derived from the reported clinical diagnosis based on a consensus of fluid and blood cytology, biochemistry, immunology and microbiology, in conjunction with the overall clinical information including the results of further imaging tests.
As fluid biochemical data was available mostly for exudate effusions (reflecting real-world clinical practice), CMR data with T1 mapping values were also collected from a further cohort of patients with pleural and/or pericardial effusions and chronic severe left ventricular systolic dysfunction with left ventricular ejection fraction (LVEF) <30% and no co-morbidities that could contribute to an exudative effusion (auto-immune/inflammatory disease, malignancy, infection). In these patients effusions were presumed to be transudative therefore invasive sampling was not required, with the effusions managed with intravenous diuresis and optimization of heart failure treatment.
CMR with T1 mapping
Scans at all four sites were performed on 1.5-T MR scanners (Magnetom Aera; Siemens Medical Solutions, Erlangen, Germany) with CMR protocols performed according to clinical indication.13 All protocols included acquisition of cine images for cardiac volumetric and functional assessment, native T1 mapping (using an identical MOLLI 5s(3s)3s sampling protocol at all sites) in at least two views and late gadolinium enhancement for myocardial tissue characterization. Typical acquisition parameters were: pixel bandwidth 1085 Hz/pixel; echo time = 1.1 ms; flip angle = 35°; matrix = 256 × 144; slice thickness = 8 mm and minimum TI of 180 ms.
Imaging analysis
All T1 maps were analysed using CVI42 software (Circle Cardiovascular Imaging Inc., Version 5.1.2, Calgary, Canada) by two independent Level 3 CMR accredited observers blinded to clinical and biochemical data. Regions of interests (ROIs) were drawn in the pericardial and/or pleural fluid in the two views in which the effusion volume was visually largest, with mean T1 values calculated from a minimum of two ROIs. Care was taken to avoid areas of heterogeneity and partial volume effects in the edges of the region.
Statistical analysis
Data were analysed using SPSS (version 24.0, Statistical Package for the Social Sciences, International Business Machines, Inc., Armonk, NY, USA). Continuous variables were expressed as mean ± standard deviation, categorical as percentages. Normality was checked using the Shapiro–Wilk normality test. Independent sample t-test analysis was used for normally distributed variables and Mann–Whitney U test was used for comparison of not normally distributed variables. The relationships between bivariates were analysed using Pearson’s method. Receiver operating characteristic curve analysis was used to assess the diagnostic performance of effusion fluid T1 mapping for discriminating between exudates and transudates, with sensitivity, specificity, P-value and area under the curve (AUC) calculated for both pleural and pericardial effusions. Inter-observer agreement for fluid T1 measurement was calculated using Bland–Altman method, with correlation measured using Pearson’s correlation coefficient. Linear regression analysis was used to assess bias between measurements. Statistical tests were two-tailed with significance defined as p < 0.05.
Results
Phantom study to assess the relationship between fluid T1 and protein levels
There was a strong inverse correlation between albumin concentration in the phantom, and measured T1 values [r = −0.992, p= 0.008 (at 39.3°C)]. As expected, when the experiment was repeated at room temperature (18°C), the inverse relationship was maintained (r = −0.991, p = 0.009), but a shift in the measured T1 values to lower values was observed for any given albumin concentration, Figure 1A–C.
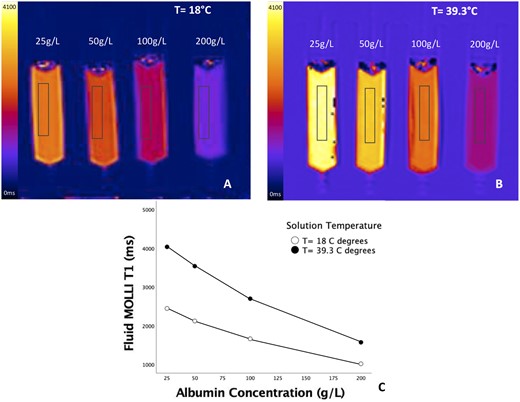
Relationship of fluid T1 and protein levels in phantom. Measured T1 values decreased with increasing albumin concentration in phantom both at room temperature (A) and at 39.3° (B), with a close correlation (r = − 0.992, p = 0.008 at 39.3°C) (C).
Clinical study
Patient demographics
Data were available from 86 patients (age range 53 ± 17 years, 63% male) with pleural or pericardial effusions who had undergone CMR with T1 mapping for clinical purposes (Figure 2). Patient characteristics and effusion profile are reported in Table 1.

Study population. Patient population and nature of effusions included in the analysis. aSix patients had both pericardial and pleural effusions.
Patient characteristics and effusion profile
| Patients with CMR and fluid biochemical data (n = 55 patients; 61 effusions) | Patients with CMR data onlya (n = 31 patients; 38 effusions) | |
|---|---|---|
| Male (number, %) | 34 (62) | 27 (87) |
| Age (years) | 52 ± 18 | 53 ± 16 |
| AF (number, %) | 1 (2) | 6 (19) |
| Heart rate at time of CMR (bpm) | 89 ± 14 | 83 ± 14 |
| Types of effusion (n) | Pleural: 24 | Pleural: 23 |
| Pericardial: 37 | Pericardial: 15 | |
| LVEF±SD (%) | 53 ± 15 | 20 ± 6 |
| RVEF±SD (%) | 48 ± 11 | 28 ± 8 |
| Fluid characterization | Exudate: 40 | Transudate: 38 |
| Transudate: 19 | ||
| Hemopericardium: 1 | ||
| Chylothorax: 1 | ||
| Time between CMR and drain (days) | 2.5 (−2.3 to 9.3) | NA |
| Clinical diagnosis: exudates | Neoplastic: 13 | N/A |
| Infective/Inflammatory: 22 | ||
| Indeterminate: 5 | ||
| Clinical diagnosis: transudates | Ischemic cardiomyopathy: 1 |
|
| Idiopathic DCM: 1 | ||
| Anthracycline-related cardiomyopathy: 4 | ||
| AL Amyloidosis: 3 | ||
| Hypertrophic cardioymopathy: 1 | ||
| Hypertensive cardiomyopathy: 1 | ||
| Chronic constrictive pericarditis: 4 | ||
| Malignant pericardial effusion: 1 | ||
| Renal failure: 1 | ||
| Indeterminate: 2 |
Values are mean ± SD or median (interquartile range), n = number of patients (five patients had both pleural and pericardial effusions).
AL, light chain; DCM, dilated cardiomyopathy; LVEF, left ventricular ejection fraction; RVEF, right ventricular ejection fraction; SD, standard deviation.
Seven patients had both pleural and pericardial effusions.
Fluid biochemical analysis was available for 55 (64%) patients, who had undergone invasive drainage (31 pericardiocentesis, 18 pleurocentesis, 6 both) of the effusions for diagnostic and/or therapeutic purposes. The median interval between CMR acquisition and biochemical fluid analysis was 2.5 [interquartile range (IQR) −2.3 to 9.3] days, with no difference between transudative and exudative effusions [2 (IQR −4 to 8) days vs. 3 (IQR 0–16) days, p = 0.613]. For patients with biochemical analysis of the pleural fluid samples, 8 (33%) were categorized as exudates, and 15 (63%) transudates, with one chylothorax. Of the pericardial samples with biochemical analysis available, 32 (86%) were exudates and 4 (11%) transudates, with one hemopericardium (iatrogenic post-endomyocardial biopsy). Of the exudative effusions, 13 were neoplastic, 22 inflammatory or infective with the 5 remaining effusions deemed idiopathic. As expected, compared to patients with exudative effusions, patients with transudative effusions had lower LV EF (56 ± 11% vs. 46 ± 19%, p = 0.010) and right ventricular (RV) EF (51 ± 9% vs. 41 ± 14%, p = 0.002). There was no difference in age (51 ± 19 years vs. 54 ± 15 years, p = 0.558) or heart rate (88 ± 15 bpm vs. 90 ± 14 bpm, p = 0.694) at time of the scan.
Thirty-one (36%) additional patients had presumed transudative effusions (8 pericardial, 16 pleural, 7 both) but without corresponding biochemical data available. These were patients with severe chronic heart failure who had been admitted due to pulmonary oedema, where clinical confidence in the diagnosis of a transudative effusion was sufficiently high that fluid aspiration was not deemed necessary for diagnostic purposes. Demographics (and heart rate) were similar between patients with transudative effusions with and without biochemical fluid analysis (mean age 54 ± 16 vs. 53 ± 16 years, p = 0.851 and heart rate 88 ± 14 bpm vs. 83 ± 14 bpm, p = 0.084); however, those without biochemical data had worse cardiac function (LVEF 21 ± 10% vs. 45 ± 20%, p < 0.0001 and RVEF 29 ± 9% vs. 40 ± 12%, p = 0.001).
Interobserver reproducibility of fluid T1 mapping measurement
Interobserver reproducibility for measurement of fluid T1 was excellent for both pericardial and pleural effusions (intraclass correlation coefficient 0.945, 95% CI: 0.863–0.975 and 0.952, 95% CI: 0.914–0.974, respectively), with no significant bias between measurements (pericardial p = 0.535, pleural p = 0.186), Supplementary data online, Figure S1.
Correlation between CMR T1 values and fluid protein levels
Fluid T1 measured by CMR and fluid protein values obtained by biochemical analysis of fluid samples (exudates and transudates only) were inversely correlated (combined pleural and pericardial effusions, r = −0.663, r2 = 0.439, p < 0.0001). For pleural fluid, this relationship was significant for both fluid total protein (r = −0.759, r2 = 0.576, p < 0.0001, Figure 3A) and for pleural fluid protein: plasma protein ratio (r = −0.645, r2 = 0.416 p = 0.001, Figure 3C). A weaker correlation was found between the pericardial fluid T1 and the pericardial fluid protein: plasma protein ratio (r = −0.351, r2 = 0.123, p= 0.042, Figure 3D), however the relationship with absolute pericardial fluid protein (r = −0.248, r2 = 0.061, p = 0.145, Figure 3B) was not significant. The range of pericardial fluid protein values was narrow with biochemical data available for only four subjects with pericardial transudates.
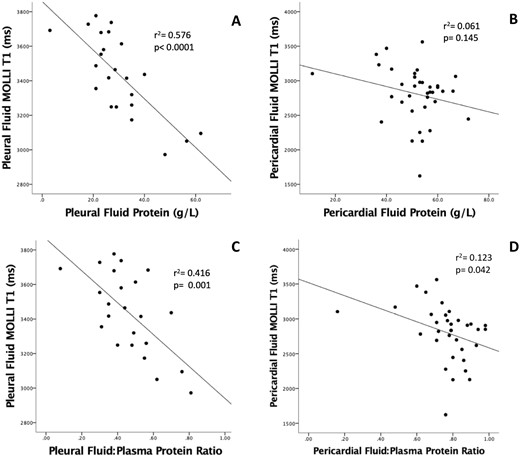
Relationship between fluid T1 values and fluid protein levels from biochemical analysis of clinical samples (transudates and exudates). There was an inverse correlation between both fluid protein (A) and fluid protein: plasma protein ratios (C) with fluid T1 values for pleural fluid, however for pericardial fluid, only the fluid: plasma protein ratio correlated with fluid T1 values (D), whilst no significant correlation was reached between pericardial fluid T1 values and fluid protein (B).
Comparison of T1 values of pleural and pericardial fluid
Across all samples, pleural fluid T1 values were higher than pericardial (3529 ± 251 ms vs. 2968 ± 436 ms, p < 0.0001). For pleural effusions, T1 values were significantly higher with transudates (n = 38) compared to exudates (n = 8), 3596 ± 213 ms vs. 3252 ± 207, respectively, p < 0.0001. This pattern was similar with pericardial effusions: transudates (n = 19) 3337 ± 245 ms vs. exudates (n = 32) 2749 ± 373 ms, p < 0.0001, Table 2, Figure 4. When analysing data in the subgroup of patients with pleural effusions with biochemical data available (n = 23), T1 values were significantly higher for transudates compared to exudates, respectively, 3543 ± 170 ms vs. 3231 ± 211 ms, respectively p= 0.001. This pattern was similar with pericardial effusions with biochemical data (n = 36), with T1 values for transudates of 3305 ± 210 ms vs. exudates T1 values of 2749 ± 373 ms, p = 0.007.
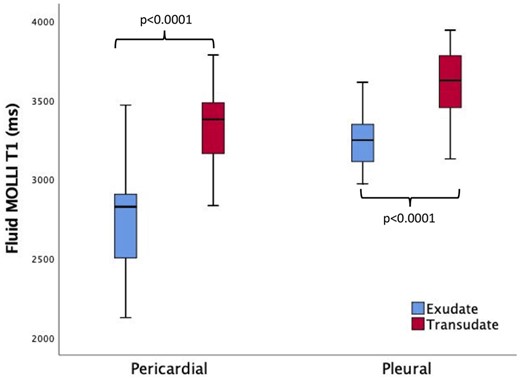
T1 values in pleural and pericardial effusions. T1 values were significantly higher in transudates than exudates for both pleural and pericardial effusions. Pleural fluid T1 values were higher when compared with pericardial effusions.
Fluid T1 values by CMR in the overall population and protein levels from biochemical analysis
| Transudates (n = 57) | Exudates (n = 40) | p-value | |||
|---|---|---|---|---|---|
| Overall | With fluid biochemistry | Without fluid biochemistry | |||
| Pleural T1 (ms) | 3596 ± 213 | 3552 ± 172 | 3624 ± 234 | 3252 ± 207 | <0.0001 |
| Pericardial T1 (ms) | 3337 ± 245 | 3305 ± 210 | 3345 ± 259 | 2749 ± 373 | <0.0001 |
| Pleural fluid protein (g/L) | 24 ± 7 | 42 ± 12 | <0.0001 | ||
| Pericardial fluid protein (g/L) | 36 ± 18 | 54 ± 8 | 0.002 | ||
| Serum protein (g/L) | 71 ± 14 | 68 ± 11 | 0.596 | ||
There was no difference in T1 values of the transudative pleural effusions obtained from patients with biochemical data available as compared to those without biochemical data (3552 ± 172 ms vs. 3624 ± 234 ms, p = 0.324—Supplementary data online, Figure S2), and blood T1 values were similar in all patients.
In the patient with the hemopericardium, the pericardial fluid T1 values were similar to the measured T1 values within the right atrial blood pool (1876 ms—compared to 1832 ms), clearly differentiating the haemopericardium from both transudative and exudative effusions, Figure 5. In the patient with a known chylothorax, fluid biochemistry measured triglycerides of 2.6 mmol/L, cholesterol 1.9 mmol/L, protein of 45 g/L, and LDH of 199 IU/L, and fluid T1 values were 3376 ms (within the range of exudative effusions).
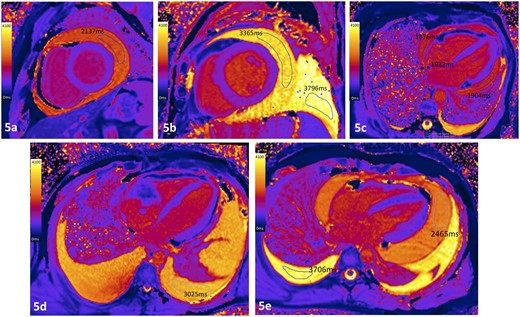
Case examples of T1 maps from patients with effusions of different etiologies. (A) Pericardial exudate in patient with active fibrinous pericarditis; (B) pericardial transudate in patient with severe LV systolic dysfunction (pleural effusion also a transudate); (C) patient with hemopericardium following complicated endomyocardial biopsy where the measured intracardiac blood and pericardial fluid T1 values were similar; (D) pleural exudate in a patient with angiosarcoma invading the right atrium with pericardial infiltration. (E) Exudative pericardial (2465 ms) and transudative pleural effusion (3706 ms) in a patient with acute lymphoblastic lymphoma, corresponding to fluid protein levels of 38 g/L and 26 g/L, respectively.
Diagnostic accuracy of T1 mapping by CMR to non-invasively distinguish transudates from exudates
Using a threshold value of 3440 ms, the diagnostic accuracy of T1 mapping for identifying transudative pleural effusions was very good: AUC of 0.88 (standard error 0.059, 95% CI 0.764–0.996, p = 0.001), with 79% sensitivity and 89% specificity. The optimal threshold for diagnosing transudative pericardial effusions was lower at 3015 ms with excellent diagnostic accuracy: AUC 0.93 (standard error 0.037, 95% CI 0.855–1.000, p < 0.0001) with sensitivity of 95% and specificity of 81%, Figure 6.
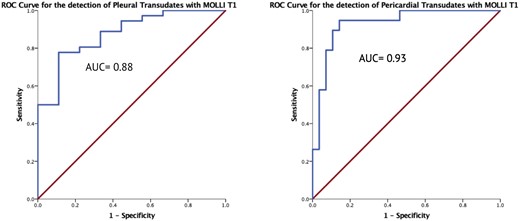
ROC curves for fluid T1 mapping. T1 values had very good diagnostic accuracy for discriminating transudates from exudates in pleural fluid using a cut-off T1 value of 3440 ms, and excellent accuracy for pericardial fluid using a cut-off of 3015 ms.
Considering only the subgroup of patients with biochemical data available, for pleural effusions, the optimal threshold for diagnosing a transudative effusion was 3290 ms with AUC of 0.88 (standard error 0.083, 95% CI 0.712–1.000, p = 0.004) with sensitivity 93% and specificity 75%. For pericardial effusions, the optimal threshold for diagnosing a transudative effusion was 3105 ms with AUC 0.95 (standard error 0.039, 95% CI 0.686–1.000, p = 0.004) with sensitivity 75% and specificity 87%. Graph in Supplementary data online.
Discussion
We demonstrate an inverse relationship between native T1 values measured by CMR and fluid protein levels both in vitro, using a custom-designed phantom model, and in patients with clinical pleural or pericardial effusions. Furthermore, we show that T1 mapping by CMR may be helpful for discriminating transudative from exudative effusions, with an AUC for diagnosis of pericardial transudates of 0.93 and pleural transudates of 0.88.
Diagnostic work-up of pleural and pericardial effusions generally requires invasive aspiration and biochemical fluid analysis, with an inherent risk of procedural complications.3,4 Although additional testing of exudative effusions may be required for cytology or microbiology, in the case of transudative effusions fluid analysis is generally not required for diagnostic purposes and treatment is generally medical aimed at fluid removal via diuresis rather than invasive drainage. Accurate non-invasive identification particularly of a transudative effusions would therefore remove the requirement for invasive sampling/drainage, hence reducing patient risk. Similarly, for patients where T1 mapping clearly showed an effusion to be blood (fluid T1 values similar to blood pool values), clinical decision-making could focus on the requirement and approach for drainage (surgical or percutaneous), with no requirement for diagnostic sampling.
By creating an albumin phantom we demonstrated a close inverse correlation between T1 mapping values by CMR and albumin concentrations. Evidently, the T1 relaxation time of a fluid will also be influenced by alterations in pH19 and temperature,20 the later of which we also confirm using the phantom. We then clinically validated this correlation using data from patients with effusions who had undergone both clinical CMR imaging with T1 measurement and biochemical analysis of invasively-obtained fluid sampling within the same clinical episode. There was an inverse relationship between fluid T1 values and protein levels in pleural fluid, suggesting T1 measurement may provide a potential non-invasive quantitative assessment of pleural fluid composition. Despite correlation between pericardial fluid: plasma protein ratio and T1 values, the relationship between pericardial T1 and fluid protein levels was not statistically significant due to the small number of patients with transudative pericardial effusions for whom fluid biochemical data was available.
In order to assess the diagnostic accuracy of fluid T1 measurement for detecting transudative effusions, we supplemented our dataset with CMR data from patients with presumed transudative effusions who had not undergone invasive sampling, and hence who had no corresponding biochemical data. We found T1 mapping to have very good or excellent diagnostic accuracy for diagnosing transudative effusions for pleural (79% sensitivity, 89% specificity) and pericardial (sensitivity of 95%, specificity of 81%) fluid, respectively.
In reality, dichotomizing effusions using single cut-off points of any biomarker, biochemical or imaging-derived, that generates continuous numerical results is likely to be associated with a certain degree of misclassification.21–23 This may partially explain the overlap between T1 values for transudates and exudates. Indeed, similar problems are encountered with the use of Light’s criteria5 for discriminating between effusion types; particularly with pericardial effusions in which the criteria have not been validated.6,24 The higher T1 values for pleural compared with pericardial fluid supports previous findings,6 and highlights the different biochemical composition of the two types of effusion. Pericardial fluid, despite being considered to be a plasma ultrafiltration product,25 has been found to differ from pleural fluid with higher levels of protein and LDH26 and application of Lights criteria to a sample of 120 pericardial effusions resulted in 118 cases being classified as exudates.6 Even for pleural effusions, Lights criteria have been shown a specificity of only 74% for the diagnosis of exudates, suggesting that one in four transudates are misclassified.7 Meta-analysis data has shown that the diagnostic accuracy of any one of the Light’s criteria decreases to as low as 65% as the value approached the cut-off point.27 These limitations hinder clinical management in patients with effusions, and also highlight the lack of a gold standard against which any novel biomarker can be compared.
Our data suggest that the performance of T1 mapping to discriminate transudate from exudate pericardial effusions is similar to that of any individual biochemical test, including total protein, protein ratio, and LDH ratio.28 Clearly, particularly for exudative effusions, this technique will not replace diagnostic aspiration if the fluid is required to be sent for microbiological or cytological analysis in order to guide further management. However, we propose that for effusions where T1 values are high and the clinical scenario is consistent with a transudative effusion, this non-invasive imaging marker may provide additional support and confidence for pursuing empirical medical management without pursuing additional invasive assessment with fluid aspiration.
Several studies have investigated the use of imaging for characterization of effusions including using CT and MRI11,29–34; however, no studies have compared T1 values with results from biochemical fluid analysis. Çullu et al.10 found that CT attenuation values <8.5 HU were able to identify transudates pleural effusions with a sensitivity of 84.6% and a specificity of 81.2%, while Çetin et al.11 showed that in pericardial effusions a cut-off value of 4.7 HU had a 80.0% sensitivity and 87.7% specificity for the identification of exudates. Native T1 mapping is now routine in clinical CMR imaging protocols for myocardial tissue characterization,13,14 and measurement and analysis is straightforward. Measurement of blood T1 values has shown that almost 80% of measured blood T1 variability can be explained by differences in hematocrit, iron, and HDL-cholesterol levels in healthy subjects.18 Recently, Thalén et al.35 evaluated the diagnostic utility of T1 mapping to determine quantitative contrast dynamics in pericardial and pleural effusions. In this study, no fluid biochemical data was available, but the estimation of native T1 mapping was performed using the same sequence (MOLLI) at the same field strength (1.5 T). Consistent with our results, the authors identified lower native T1 values in pericardial effusions (median 2919 ms) compared to pleural effusions (median 3148 ms).
Limitations
Our study is limited by the small sample size, which prevents differentiation of etiologies of exudative effusions (neoplastic vs. infective). However, this is one of the largest studies using a large proportion of paired biochemical and CMR data for both pleural and pericardial effusions supporting the assigned diagnosis, and providing an in vivo correlation of T1 mapping values and fluid protein content. The low number of pericardial transudative effusions reflects clinical practice, where invasive pericardial drainage is rarely undertaken when an effusion is suspected to be a transudate. The patients with heart failure and presumed transudates but without biochemical correlation had similar T1 values to those with biochemical analysis, and patients with other potential causes of the effusion (infective, inflammatory or neoplastic) were excluded, however alternative causes cannot be definitively ruled out. The protein phantom was constructed to test the inverse correlation between fluid protein and T1 values prior to initiation of the clinical study, and therefore protein levels do not cover the full range of fluid protein levels encountered clinically. However, the experiment was never designed to provide ‘look-up’ reference tables for protein levels based on measured T1, and should not be used for this purpose. Data collection was performed retrospectively; however, data from consecutive cases from across multiple sites with both T1 values from CMR and fluid biochemical analysis were analysed, with T1 measurements made by experienced observers blinded to the biochemical results and clinical diagnosis. A systematic protocol for comprehensive diagnostic workup of the effusions was not always undertaken; however, the length of follow-up (17 ± 11 months) provides confidence in the validity of the assigned diagnoses. Fluid biochemical analysis and CMR studies were not always performed on the same day; however, it is unlikely that effusion protein concentrations changed significantly within the median interval of 2.5 days. Indeed, any such change would weaken the correlation between protein and T1 values thereby reducing the diagnostic performance of T1 mapping observed.
Conclusion
Measurement of T1 values using CMR in pleural and pericardial fluid provides clinically useful non-invasive information regarding fluid composition. This initial data demonstrates that T1 values correlate with fluid protein levels and proposes a role for T1 mapping in non-invasive discrimination of transudative from exudative effusions. This may be of particular utility for transudative effusions whereby non-invasive diagnostic confirmation would remove the clinical requirement for invasive diagnostic sampling. Larger prospective studies with paired imaging and biochemical datasets are required to further validate these findings and determine the accuracy of T1 mapping for non-invasive identification of effusion types.
Supplementary data
Supplementary data are available at European Heart Journal - Cardiovascular Imaging online.
Data availability
The data underlying this article will be shared on reasonable request to the corresponding author.
Funding
J.C.M. and C.M. are directly and indirectly supported by the University College London Hospitals, NIHR Biomedical Research Centre and Biomedical Research Unit at Barts Hospital, respectively. A.S. is supported by a British Heart Foundation Fellowship (FS/18/83/34025) and a Barts Charity grant (MGU0422). T.A.T. is directly and indirectly supported by the University College London Hospitals NIHR Biomedical Research Centre and Biomedical Research Unit at Barts Hospital, respectively.
Conflict of interest: none declared.
