


Abstract
Diabetes mellitus (DM) is associated with increased cardiovascular morbidity and mortality. The multicentre, prospective Lipid-Rich Plaque trial (LRP) examined non-culprit (NC) non-obstructive coronary segments with a combined near-infrared spectroscopy (NIRS)-intravascular ultrasound (IVUS) catheter. This study assessed the differences in NC plaque characteristics and their influence on major adverse cardiac events (MACE) in diabetic and non-diabetic patients.
Patients with known DM status were divided into no diabetes, diabetes not treated with insulin (non-ITDM), and insulin-treated diabetes (ITDM). The association between presence and type of DM and NC-MACE was assessed at both the patient and coronary segment levels by Cox proportional regression modelling. Out of 1552 patients enrolled, 1266 who had their diabetes status recorded were followed through 24 months. Female sex, hypertension, chronic kidney disease, peripheral vascular disease, and high body mass index were significantly more frequent in diabetic patients. The ITDM group had more diseased vessels, at least one NC segment with a maxLCBI4 mm ≥400 in 46.2% of patients, and maxLCBI4 mm ≥400 in nearly one out of six Ware segments (15.2%, 125/824 segments). The average maxLCBI4 mm significantly increased from non-diabetic patients (NoDM) to non-insulin-treated diabetic patients (non-ITDM) to insulin-treated diabetic patients (ITDM; 137.7 ± 161.9, 154.8 ± 173.6, 182.9 ± 193.2, P < 0.001, respectively). In patients assigned to follow-up (692 ± 129 days), ITDM doubled the incidence of NC-MACE compared with the absence of diabetes (15.7% vs. 6.9%, P = 0.0008). The presence of maxLCBI4 mm>400 further increased the NC-MACE rate to 21.6% (Kaplan–Meier estimate).
Cholesterol-rich NC plaques detected by NIRS-IVUS were significantly more frequent in diabetic patients, especially those who were insulin-treated, and were associated with an increased NC-MACE during follow-up.
Introduction
In the last 40 years, the number of patients with diabetes mellitus (DM) has nearly quadrupled to 463 million people worldwide in 2019; this is expected to rise to 578 million in 2030.1 DM is a significant independent cardiovascular risk factor and a leading cause of cardiovascular morbidity and mortality. Silent myocardial ischaemia affects 20–35% of patients with DM, with a similar percentage of silent myocardial infarctions (MIs) detected as incidental findings or because of the development of heart failure.2,3 The relationship between DM and cardiovascular morbidity and mortality has recently increased because of the introduction of new classes of oral and injectable anti-diabetic drugs, such as glifozines and glucagon-like peptide-1 receptor agonists, with promising results in terms of reducing cardiovascular events.4–7
Multivessel and diffuse disease are more frequent in diabetic patients.8 Intravascular ultrasound (IVUS), virtual histology (VH)-IVUS, and optical coherence tomography (OCT) suggest greater plaque volume and burden and more frequent presence of a large necrotic lipid core, a thin-cap fibroatheroma (TCFA), macrophage infiltration, and focal calcification.9,10 Near infrared spectroscopy (NIRS) is the gold standard to study cholesterol content in the arterial wall, and this can be complemented by IVUS to determine the plaque burden (PB) because IVUS imaging has a limited availability to identify lipid core in plaques, a primary defining feature of vulnerable plaques.
‘Lipid-rich plaques’ are defined as any intimal thickening with cholesterol composition core strongly associated with MI and cardiac death.11–13 Coronary lesions of diabetic patients with stable chronic syndromes treated with insulin are characterized by negative lesion site remodelling due to arterial shrinkage, resulting in excess plaque accumulation on lumen as a result of a low-adaptive remodelling response.14,15 At present, there is limited information on the presence of lipid-rich plaques and associated outcomes of non-culprit (NC) major adverse cardiac events (MACE) in different glycometabolic settings.
The multicentre prospective Lipid-Rich Plaque (LRP) registry showed that lipid-rich plaques [maxLCBI4 mm, the maximum lipid core burden index (LCBI) of the 4 mm region within the highest lipid burden detected by NIRS] and an IVUS PB >70% and minimum lumen area (MLA) <4 mm2 within the maxLCBI4 mm segment were associated with a greater incidence of MACE. This post hoc sub-analysis of the LRP study examined the plaque characteristics in NC coronary segments of patients with and without DM, divided into insulin-treated (ITDM) and non-ITDM patients.
An illustrative figure is presented in Figure 1 showing angiography and NIRS-IVUS imaging of a diabetic patient enrolled in the LRP study at baseline and 1 year later.
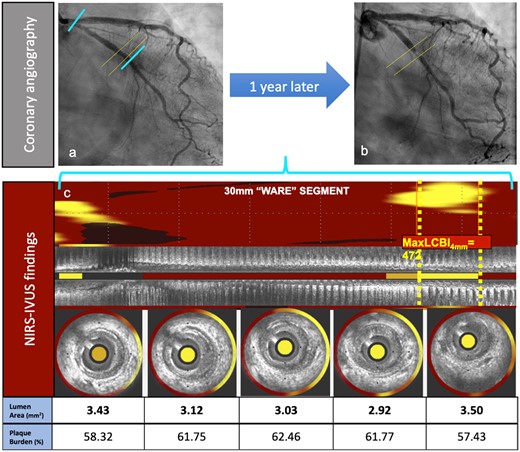
Clinical case illustration. A 64-year-old female patient with past medical history of hypertension, hyperlipidaemia, diabetes mellitus, and smoking. (A) Shows angiography at the non-culprit vessel at index (left circumflex artery). (B) Depicts the adverse event angiography (showing a concentric proximal left circumflex artery lesion) taken when the patient presented to the hospital with complaints of shortness of breath and left sided chest pain upon walking less than a block, which was relieved with rest. CK-MB was within normal limits. EKG showed normal sinus rhythm and non-specific ST-T segment abnormalities. Proximal left circumflex artery lesion was successfully treated with drug-eluting stent implantation. Panel (C) shows IVUS-NIRS longitudinal and cross-sectional details at the location of the maxLCBI4 mm at the index procedure. A focal lipid-rich plaque is shown in the maxLCBI4 mm location in (C).
Additionally, NC-MACE in these groups was assessed at 2 years and correlated with baseline characteristics.
Methods
This sub-analysis of the LRP study includes 1547 patients in whom the DM treatment status was known at the time of enrolment and who had evaluable LCBI measurements: 562 with DM (36.3%), 186 (12.0%) ITDM, and 376 (24.3%) non-ITDM. By design, follow-up was limited to an allocated cohort of 1266 patients, 464 of whom had DM (36.7%), including 162 (12.8%) with ITDM (Figure 2A). The overall population was used to characterize the cholesterol content and plaque volume by NIRS-IVUS at baseline in the different glycometabolic groups. The follow-up cohort was used to assess the correlation and interaction between plaque characteristics and DM status with NC-MACE at 24-month follow-up. In brief, patients with known or suspected coronary artery disease (CAD) undergoing cardiac catheterization with possible ad hoc percutaneous coronary intervention (PCI) were enrolled after uneventful and successful clinically indicated NIRS-IVUS interrogation of NC vessels. NC-MACE was defined as a composite of cardiac death, cardiac arrest, non-fatal MI, acute coronary syndrome (ACS), revascularization, and readmission to hospital for angina with >20% diameter stenosis progression. All patients provided informed consent before catheterization, and the study was approved by the local ethics boards of all participating centres. The study complies with the Declaration of Helsinki.
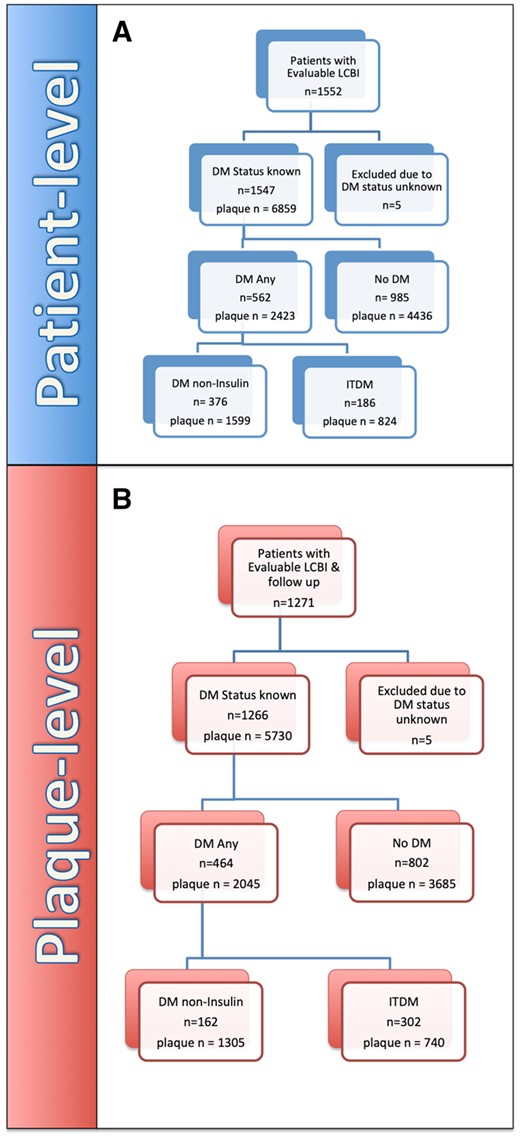
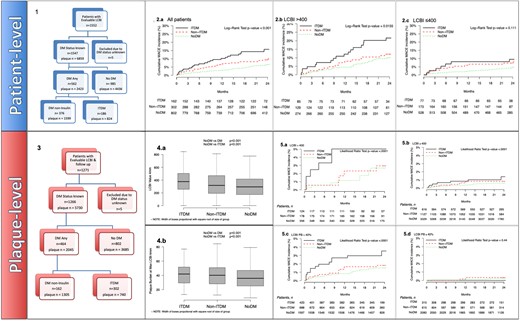
Patient-level. (A) Flow chart indicating overall patient LRP study cohort with evaluable follow-up up to 24 months. Plaque-level. (B) Flow Chart reporting overall LRP study cohort with evaluable follow-up up to 24 months. DM, diabetes mellitus (includes ITDM + non-ITDM); ITDM, insulin-treated diabetic patients; NC-MACE, non-culprit major adverse cardiac events; noDM, non-diabetic patients; non-ITDM, non-insulin-treated diabetic patients.
Details on NIRS-IVUS system used and imaging procedure performed, as well as the stratification and subsequent randomization to follow-up, were reported in the original LRP publication.16 Investigators were blinded to the NIRS-IVUS images in NC arteries. DM was defined as a known diagnosis of DM prior to presentation or a new diagnosis during hospitalization for baseline catheterization. The treatment of DM was recorded as controlled with diet or oral medication or requiring insulin. For this present sub-analysis, ITDM was defined as treatment with insulin regardless of additional oral medication management, and non-ITDM was defined as any therapeutic strategy without insulin and managed by either diet or oral medication.
Core laboratory analysis
All NIRS-IVUS analyses were done offline using validated NIRS-IVUS analysis software (QIVUS version 3.0.16.0, Medis Medical Imaging Systems, Leiden, The Netherlands) by a core laboratory (MedStar Cardiovascular Research Network, Washington, DC, USA) that was not aware of the clinical characteristics and outcomes. Ware segments were defined as 30 mm long segments starting from the ostium of the artery. Each segment was analysed for maxLCBI4 mm and, within each maxLCBI4 mm, MLA and PB were measured. Based on the original study design, a dichotomous analysis using a maxLCBI4 mm >400 cut-off both for patients and plaques was used. Because the LRP analysis included all Ware coronary segments and not just segments with visible lesions, only a minority of segments (<1%) had a PB >70%. To obtain a more meaningful and robust discrimination, an additional PB cut-off (40%) that was close to the median was also evaluated.
Statistical analysis
Categorical variables have been presented as percentages and fractions, and continuous variables as mean (±) standard deviations. To compare the study groups, we used χ2 tests for categorical variables and analysis of variance for continuous variables, except as otherwise noted. The cumulative incidence of NC-MACE across time was estimated using the Kaplan–Meier method, and a log-rank test was used to compare the KM curves. Cox proportional hazard models for patient-level analyses and random-effects Cox proportional hazard models for plaque-level analyses, were used to assess differences in distribution of time to first NC-MACE. For the plaque-level analysis, we adjusted for MLA <4 mm2 and PB >70% in the maxLCBI4 mm segment, while for the patient-level analysis, we adjusted for age, male gender, hypertension, chronic renal insufficiency, history of smoking, prior PCI, and ACS presentation in all of the predictive models.
All analyses were performed in SAS 9.4 (SAS Institute, Cary, NC, USA). A P value of ≤0.05 was considered statistically significant. The data underlying this article will be shared on reasonable request to the corresponding author.
Results
Overall patient cohort
The baseline characteristics, including cardiovascular risk factors and clinical presentation, are shown in Table 1 for the overall cohort. Presence of other cardiovascular risk factors was more common and body mass index was notably higher in the DM group, with a difference predominantly driven by the ITDM group. ITDM patients also had the highest rates of heart failure, peripheral artery disease, hypertension, prior stroke, or transient ischaemic attack, and chronic renal insufficiency including need for haemodialysis. Conversely, there were no differences in terms of clinical presentation (stable vs. unstable coronary syndromes) with an overall rate of 87.6% of patients undergoing PCI during the index procedure (Table 1).
Demographic data, risk factors and clinical presentation in the total population
| Variable | NoDM | Non-ITDM | ITDM | P-value |
|---|---|---|---|---|
| N = 985 | N = 376 | N = 186 | ||
| Age (years) | 64.3 ± 10.5 | 63.8 ± 9.6 | 62.5 ± 10.3 | 0.082 |
| Age >65 years | 49.3% | 46% | 44.6% | 0.350 |
| Male sex at birth | 72.4% | 71.8% | 53.2% | <0.001* |
| Smoking history (any) | 56.2% | 55% | 47.8% | 0.112 |
| Current smoker | 24.1% | 22.2% | 13.9% | 0.011* |
| Hypertension | 73.9% | 91.2% | 96.2% | <0.001* |
| Hyperlipidaemia | 76.7% | 89% | 87.4% | <0.001 |
| Peripheral vascular disease | 7.1% | 10.4% | 16% | <0.001 |
| Congestive heart failure | 6.1% | 7.8% | 15.1% | <0.001* |
| Chronic renal insufficiency | 4.6% | 8.3% | 22.3% | <0.001* |
| Dialysis dependent | 0.5% | 8.7% | 1.9% | <0.001 |
| Previous myocardial infarction | 25.1% | 23.5% | 23.2% | 0.743 |
| Previous PCI | 45.2% | 44.7% | 49.5% | 0.526 |
| Body-mass index | 29.04 ± 5.78 | 31.26 ± 6.55 | 33.71 ± 7.1 | <0.001* |
| LDL cholesterol (mg/dL) | 95.6 ± 41.7 (n = 610) | 82.8 ± 35.6 (n = 251) | 85.8 ± 39.1 (n = 120) | <0.001 |
| Clinical presentation | ||||
| Stabilized STEMI | 2.6% | 2.1% | 2.2% | 0.827 |
| Non-STEMI | 24.2% | 27.1% | 27.4% | 0.410 |
| Unstable angina | 26.1% | 25.3% | 26.3% | 0.944 |
| Stable angina or positive stress test | 47.1% | 45.5% | 44.1% | 0.696 |
| Baseline medication usage | ||||
| Statin usage alone | 66.1% | 75.7% | 71.5% | 0.002 |
| Dual antiplatelet agent usage | 43.5% | 39.2% | 43.5% | 0.341 |
| Discharge medication usage | ||||
| Statin usage alone | 85.6% | 86.7% | 81.1% | 0.194 |
| Dual antiplatelet agent usage | 85.9% | 88% | 86.5% | 0.586 |
Values are % or mean ± standard deviation unless otherwise noted.
ITDM, insulin-treated diabetic patients; LDL, low-density lipoprotein; NoDM, non-diabetic patients; non-ITDM, non-insulin-treated diabetic patients.
Significant difference between non-ITDM and ITDM with a P < 0.05.
Flow charts showing the design of the overall patients and plaques in the LRP study cohort with evaluable follow-up up to 24 months are represented in Figure 2A and B.
Angiographic, NIRS, and IVUS findings
The number of vessels with severe stenoses (angiography) was higher in the ITDM group (1.2 ± 0.8 vs. 1.0 ± 0.7 in the non-ITDM vs. 1.0 ± 0.7 for NoDM, P < 0.001).
On average, 2.13 ± 0.45 vessels per patient were scanned using NIRS-IVUS. Nearly half of the ITDM patients had a patient-level maxLCBI4 mm >400, which was significantly higher than either the non-ITDM or non-diabetic groups (P = 0.006 and P < 0.001, respectively, Table 2). This result was also reflected in the measurements of the maxLCBI4 mm: 380.2 ± 201.4 in the ITDM group vs. 325.2 ± 180.4 in the non-ITDM group, P = 0.001, and 303 ± 179 in NoDM patients, P < 0.001 (Table 2).
Core laboratory findings
| NoDM | Non-ITDM | ITDM | P-value | |
|---|---|---|---|---|
| N = 985 | N = 376 | N = 186 | ||
| Patient-level | ||||
| Evaluable scanned length (mm) | 90.1 ± 40.87 | 93.7 ± 39.1 | 97.3 ± 44 | 0.018 |
| Patient-level maxLCBI4 mm | 303 ± 179 | 325.2 ± 180.4 | 380.2 ± 201.4 | <0.001* |
| Patient-level maxLCBI4 mm >400 | 27.9% | 34.3% | 46.2% | <0.001* |
| WS count within patient | ||||
| 1 WS MaxLCBI4 mm>400 | 25.0% | 29.8% | 32.1% | <0.001* |
| 2 WS MaxLCBI4 mm>400 | 7.5% | 9.4% | 15.4% | <0.001* |
| 3 or more WS MaxLCBI4 mm>400 | 1.4% | 33.1% | 4.3% | <0.001* |
| No WS MaxLCBI4 mm>400 | 66.1% | 57.3% | 48.2% | <0.001* |
| Plaque-level | NoDM | Non-ITDM | ITDM | P-value |
| N = 4436 | N = 1599 | N = 824 | ||
| Ware segment maxLCBI4 mm | 137.7 ± 161.9 | 154.8 ± 173.6 | 182.9 ± 193.2 | <0.001* |
| Ware segment maxLCBI4 mm >400 | 8% | 11.1% | 15.2% | <0.001* |
| Ware segment length (mm) | 20.7 ± 9.32 | 20.7 ± 9.3 | 21.2 ± 9.1 | 0.150 |
| IVUS data at the site of maxLCBI4 mm | NoDM | Non-ITDM | ITDM | P-value |
| N = 4428 | N = 1596 | N = 822 | ||
| IVUS EEM (mm2) | 51.9 ± 27.64 | 53.6 ± 28 | 49.9 ± 27.2 | 0.008* |
| Plaque area (mm2) | 5.1 ± 3.4 | 5.7 ± 3.7 | 5.5 ± 3.7 | <0.001 |
| Plaque burden (%) | 36.8 ± 13.7 | 39.9 ± 13.9 | 41.2 ± 14.2 | <0.001* |
| Plaque burden >70% | 0.7% | 1.1% | 1.6% | 0.043 |
| MLA (mm2) | 6.8 ± 3.9 | 6.6 ± 3.7 | 5.9 ± 3.3 | <0.001* |
Values are % or mean ± standard deviation unless otherwise noted.
EEM, external elastic membrane; ITDM, insulin-treated diabetic patients; LCBI, lipid core burden index; MLA, minimal luminal area; noDM, non-diabetic patients; non-ITDM, non-insulin-treated diabetic patients; WS, Ware segment.
Significant difference between non-ITDM and ITDM with a P < 0.05.
The percentages of patients with specific numbers of Ware segments with maxLCBI4 mm>400 are shown in Table 2, with global P-values <0.001.
On the plaque-level analysis, 15.2% of the Ware segments in the ITDM group had a maxLCBI4 mm >400 vs. 11.1% and 8.0% in the non-ITDM and NoDM groups, respectively, P < 0.001. The average Ware segment maxLCBI4 mm was also statistically higher in the ITDM group than in either the non-ITDM or NoDM groups (182.9 ± 193.2 vs. 154.8 ± 173.6 and 137.7 ± 161.9, respectively, P < 0.001 for both comparisons). The IVUS measurements showed that in ITDM Ware segments, the MLA was smaller (ITDM 5.9 ± 3.3 mm2, non-ITDM 6.6 ± 3.7 mm2, and NoDM 6.8 ± 3.9 mm2, P < 0.001) and PB greater (ITDM 41.2 ± 14.1%, non-ITDM 39.9 ± 13.9.0%, and NoDM 36.8 ± 13.7%, P < 0.001, Table 2).
Boxplots in Figure 3A and B, represent the distribution of maxLCBI4 mm and of PB at the site of maxLCBI4 mm in ITDM, non-ITDM, and NoDM, respectively.
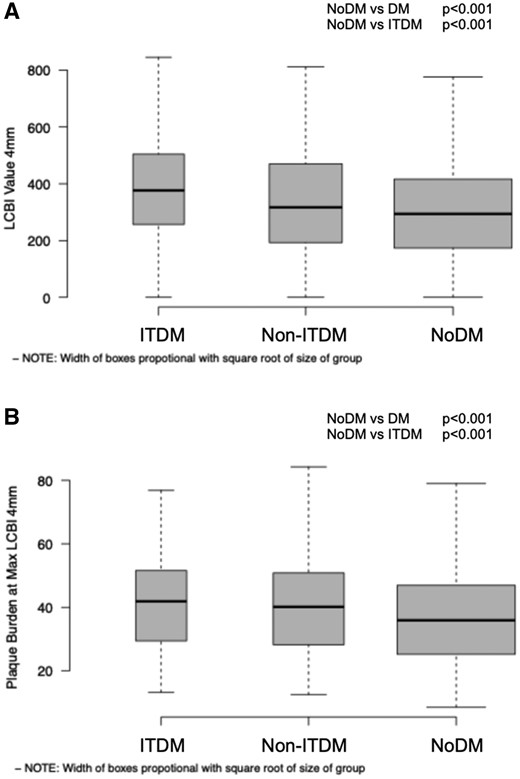
Boxplots indicating in panel A LCBI4 mm distribution, respectively, P < 0.001, for both comparisons (NoDM vs. DM; NoDM vs. ITDM); in panel B, PB at maxLCBI4 mm distribution, P < 0.001 for both comparisons (NoDM vs. DM; NoDM vs. ITDM). DM, diabetes mellitus (includes ITDM + non-ITDM); ITDM, insulin-treated diabetic patients; NC-MACE, non-culprit major adverse cardiac events; noDM, non-diabetic patients; non-ITDM, non-insulin-treated diabetic patients.
The 24-month outcomes
Within the follow-up cohort (baseline patient and plaque characteristics indicated in Supplementary data online, Tables S1 and S2), ITDM patients had statistically significantly higher NC-MACE at 24 months than NoDM patients (15.7% vs. 6.9%, P = 0.0008, Supplementary data online, Table S3). Significance did not hold for the non-ITDM group (10.1%, P = 0.1285). The presence of a maxLCBI4 mm >400 or ≤400 reset the cumulative incidence function curves at higher and lower levels for all three groups (Figure4,1A and 1B and Supplementary data online, Table S3), leading to a maximum incidence of events of 21.6% in the ITDM group (12.1% and 10.0% in the non-ITDM and NoDM groups, respectively). No interaction was noted between DM status, either non-ITDM or ITDM, and maxLCBI4 mm (P = 0.5 and P = 0.8, respectively).
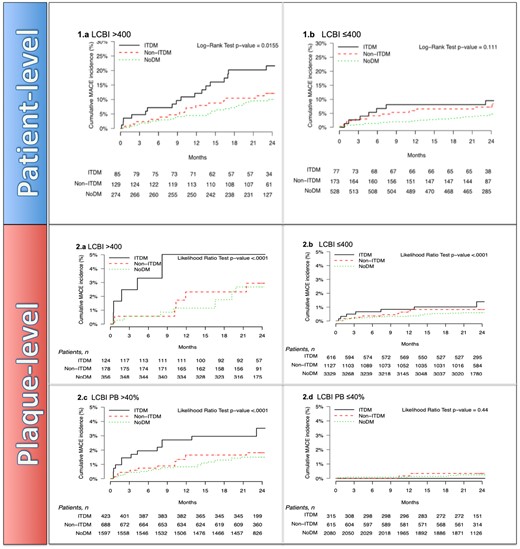
Patient-level cumulative incidence curves of NC-MACE comparing noDM, non-ITDM, and ITDM patients stratified by 1 (A) patient-level maxLCBI4 mm >400 and 1 (B) patient-level maxLCBI4 mm ≤400. Plaque-level incidence function curves of NC-MACE comparing DM status with NoDM, non-ITDM, and ITDM stratified by 2 (A) plaque-level of maxLCBI4 mm >400 and 2 (B) plaque-level of maxLCBI4 mm ≤400 over during follow-up. Cumulative incidence curves of NC-MACE of 2 (C) plaque-level of PB >40% and 2 (D) plaque-level of PB ≤40% over follow-up (24 months). DM, diabetes mellitus (includes ITDM + non-ITDM); ITDM, insulin-treated diabetic patients; NC-MACE, non-culprit major adverse cardiac events; noDM, non-diabetic patients; non-ITDM, non-insulin-treated diabetic patients.
Plaques with maxLCBI4 mm >400 and PB >40% had a numerically greater frequency of NC-MACE at follow-up in all three groups, with NC-MACE rates in the ITDM group of 5.02% and 3.53%, respectively, two times higher than in segments of NoDM patients with maxLCBI4 mm >400 and PB >40% (2.68% and 1.5%, P=NS), as shown in Figure 4,2A–D.
When the PB at the site of maxLCBI4 mm >40% was added to the adjusted plaque-level model, this variable assumed greater importance than ITDM and maxLCBI4 mm alone, as shown in Supplementary data online, Tables S4 and S5 and the forest plot of Figure 5 (A for patient-level and B for plaque-level).
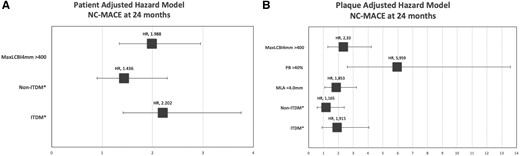
Forest plot of patient-level (A) and plaque-level (B) hazard model for 24 months NC MACE (*with NoDM patients as the reference). ITDM, insulin-treated diabetic patients; MLA, minimum lumen area; NC-MACE, non-culprit major adverse cardiac events; noDM, non-diabetic patients; non-ITDM, non-insulin-treated diabetic patients; PB, plaque burden.
Discussion
The main findings of this sub-analysis of the LRP study are that diabetic patients treated for CAD more often have lipid-rich plaques and a higher PB, with more than 50% of ITDM patients having at least one NC segment with a maxLCBI4 mm >400 and one out of six coronary segments with a maxLCBI4 mm >400. The findings of this sub-analysis, the first to use NIRS to study diabetic patients, help to explain the higher rate of events in diabetic patients with CAD, especially those treated with insulin.
In a post mortem study comparing plaques of diabetic vs. non-diabetic patients, plaques in diabetic patients presented with larger necrotic cores and more abundant macrophage infiltration; and the size of the necrotic core correlated with the HbA1c level.17 In two greyscale IVUS studies, multiple measures of IVUS atherosclerosis burden were worse in diabetics, and PB was related to patient outcomes.18 In a study using greyscale and integrated backscatter IVUS, abnormal glucose regulation was associated with increased lipid-rich plaques.19 This was also seen in two studies using VH-IVUS, the second of which showed that diabetes duration and insulin treatment were associated with a greater prevalence of TCFA.20–22 In a substudy of PROSPECT, insulin treatment was identified as a pivotal factor of NC lesion-related MACE, in addition to the presence of VH-TCFA, MLA ≤4 mm2, and PB ≥70%.23 Similar findings have been seen in several OCT studies.24–26 In particular, the COMBINE (OCT-FFR) trial studied 550 diabetic patients with angiographically intermediate lesions and a fractional flow reserve ≥0.8; 25.6% of lesions were classified as an OCT-TCFA, and an OCT-TCFA was associated with an increased incidence of cardiovascular death, target-vessel MI, clinically driven revascularization, or rehospitalization for ACS at 18-month follow-up.27 This study confirms these observations using the unique-validated ability of NIRS-IVUS to identify lipid-rich plaques and assess both the lipid content and the PB, extending its predictive value to segments at lower PB than those in PROSPECT.
In this study, the high risk associated with these NIRS-IVUS features, present in all patients but with greater absolute rates in ITDM patients, persisted despite treatment with lipid-lowering agents in 71% of the ITDM patients at the time of the NIRS-IVUS study. While not used to treat any of the patients in the current analysis, treatment with novel high-intensity lipid-lowering agents, such as evolocumab and alirocumab, induced significant reduction of cardiovascular events in diabetic patients.28,29 Prospective serial imaging studies of PCSK9 inhibitors using OCT or NIRS-IVUS should be able to identify changes in plaque characteristics induced by these drugs and their correlation with MACE.30,31 New anti-diabetic agents, such as sodium–glucose cotransporter (SGLT)-2 inhibitors and glucagone-like peptide (GLP)-1 receptor agonists, are also promising. NIRS-IVUS may be able to identify the best targets for these novel and more expensive pharmacological approaches.
Limitations
LRP was an observational study, and no pharmacological or interventional treatments were prompted by the NIRS or IVUS findings. A more proactive pharmacological treatment strategy, including SGLT-2 inhibitors, GLP-1 receptor agonists, and PCSK9 inhibitors may improve outcomes in this specific population of DM patients.28,29,32
Patients with non-ITDM, the less severe type of diabetes, did not show major prognostic differences with non-diabetic patients. We diagnosed diabetes at the time of randomization, but this may have led to labelling as diabetics patients with stress-induced hyperglycaemia or with mild diabetes responding to diet and weight loss and returning to a euglycaemic state or only requiring diet control. In the LRP study, we did not collect serial glucose measurements at follow-up, including HbA1c, precluding the possibility of correlating plaque characteristics at baseline and outcome with severity of diabetes and effectiveness of diabetes control.
Conclusion
NIRS-IVUS can identify plaque characteristics predictive of future NC-MACE in diabetic patients. Cholesterol-rich plaques and those with a high PB are significantly more common, especially in ITDM patients, explaining the higher frequency of increased cardiovascular mortality and morbidity.
Supplementary data
Supplementary data are available at European Heart Journal - Cardiovascular Imaging online.
Funding
The LRP trial was sponsored by InfraRedx NIPRO, Bedford, MA, USA.
Conflict of interest: R.W., C.D.M., H.M.G.-G., and R.T. were Principal Investigator, European Principal Investigator, Responsible Officer Core Laboratory NIRS-IVUS and angiographic analysis, Worldwide Study Coordinator of the Lipid-Rich Trial, sponsored by Infraredx-Nipro, Bedford, MA, USA. C.D.M. is the recipient of research grants (through the Department of Clinical and Experimental medicine of the University of Florence) from AMGEN, Behring, Chiesi, Daiichi-Sanyo, Edwards, Medtronic, and Shockwave. Z.A. reports grants from NIH/NHLBI, Abbott Vascular, and Cardiovascular Systems Inc.; personal fees from Amgen, Astra Zeneca, and Boston Scientific; and equity from Shockwave Medical. H.M.G.-G. reports the institutional grant support from Biotronik, Boston Scientific, Medtronic, Abbott, Neovasc, Shockwave, Phillips, and CorFlow. G.S.M. reports honoraria from Boston Scientific and Philips. R.W. reports serving on the advisory boards of Abbott Vascular, Amgen, Boston Scientific, Cardioset, Cardiovascular Systems Inc., Medtronic, Philips, and Pi-Cardia Ltd.; being a consultant for Abbott Vascular, Amgen, Biotronik, Boston Scientific, Cardioset, Cardiovascular Systems Inc., Medtronic, Philips, Pi-Cardia Ltd., and Transmural Systems; receiving grant support from AstraZeneca, Biotronik, Boston Scientific, and Chiesi; serving on the speakers bureaus of AstraZeneca and Chiesi; and being an investor in MedAlliance and Transmural Systems. All other authors report no conflicts of interest.
