


Abstract
In this study, we will describe a comprehensive haemodynamic analysis and its relationship to the dilation of the aorta in transposition of the great artery (TGA) patients post-arterial switch operation (ASO) and controls using 4D-flow magnetic resonance imaging (MRI) data.
Using 4D-flow MRI data of 14 TGA young patients and 8 age-matched normal controls obtained with 1.5 T GE-MR scanner, we evaluate 3D maps of 15 different haemodynamics parameters in six regions; three of them in the aortic root and three of them in the ascending aorta (anterior-left, -right, and posterior for both cases) to find its relationship with the aortic arch curvature and root dilation. Differences between controls and patients were evaluated using Mann–Whitney U test, and the relationship with the curvature was accessed by unpaired t-test. For statistical significance, we consider a P-value of 0.05. The aortic arch curvature was significantly different between patients 46.238 ± 5.581 m−1 and controls 41.066 ± 5.323 m−1. Haemodynamic parameters as wall shear stress circumferential (WSS-C), and eccentricity (ECC), were significantly different between TGA patients and controls in both the root and ascending aorta regions. The distribution of forces along the ascending aorta is highly inhomogeneous in TGA patients. We found that the backward velocity (B-VEL), WSS-C, velocity angle (VEL-A), regurgitation fraction (RF), and ECC are highly correlated with the aortic arch curvature and root dilatation.
We have identified six potential biomarkers (B-VEL, WSS-C, VEL-A, RF, and ECC), which may be helpful for follow-up evaluation and early prediction of aortic root dilatation in this patient population.
Introduction
Transposition of the great arteries (TGA) is a common congenital heart disease, with a reported prevalence of 2.3–4.7/10 000 live births1,2 and accounting for about 20% of all cyanotic congenital heart disease.1
The overall good results obtained with arterial switch operation (ASO) translate into an increasing number of these patients coming to adult age. However, neo-aortic root dilatation is a known late complication of the disease, both after palliative atrial surgery3 or ASO,4 hinting that aortopathy is indeed a feature of the disease. The burden of this complication is likely to increase in the near future, since more than three-fourths of patients have progressive neo-aortic root dilation leading to neo-aortic regurgitation5 and an increased overload of the left ventricle.
Several pre-operative risk factors have been identified that promote aortic dilatation,4,6,7 such as the presence of a ventricular septal defect or aortic coarctation, size discrepancy of the great arteries, bicuspid pulmonary valve, previous pulmonary artery banding, and repair at an older age.
Follow-up evaluation is mainly based on diameter measurements and aortic regurgitation assessed by echocardiography, magnetic resonance imaging (MRI), and computed tomography. Unfortunately, anatomical information derived from conventional imaging is far from accurate in predicting aortic dilatation, at least at our current level of understanding. Evaluation of flow haemodynamics may be the key to understand progression in aortic root dilatation. Complex haemodynamics has been shown as a promoting factor of aortopathy. As an example, elevated wall shear stress (WSS) and flow eccentricity have been correlated with ascending aortic dilatation in bicuspid aortic valve patients.8
We recently showed that the aortic angle is an independent risk factor for neo-aortic root dilatation9 in patients with TGA after ASO. This metric can be a surrogate of the complex aortic haemodynamics of flow in the aortic root and ascending aorta. Computational modelling of aortic flow in typical post-ASO aortic geometries has demonstrated increased WSS compared with normal controls.10,11 These studies suggest the intricate relationship between aortic arch geometry, complex flow haemodynamics, and aortic root dilatation in patients with TGA after repair.
In this study, we will describe a comprehensive haemodynamic analysis and its relationship to the curvature and the dilation of the aorta in post-ASO patients and controls using 4D flow MRI data.
We aim to study correlation between complex 3D haemodynamic parameters in aortic root and ascending aorta to aortic curvature and aortic root dilation to provide the possible mechanisms of aortic dilation associated with acute aortic angle as previously reported.9 We will also investigate among the large spectrum of haemodynamic variables, the strongest candidates able to predict dilation over time in future longitudinal studies.
Methods
Study population
We retrospectively analysed all consecutive patients enrolled to cardiovascular magnetic resonance (CMR) including 4D flow MRI after ASO at a single tertiary centre from January 2016 to March 2019. Patients without adequate aortic arch imaging or poor anatomic definition of the neo-aortic root were excluded. Patients with a bicuspid neo-aortic valve were also excluded. Sixteen patients were submitted to elective CMR following ASO during the study period. Two patients met exclusion criteria. Additionally, we also analysed 4D flow MRI of eight age-matched controls who were submitted to CMR for various reasons but ultimately did not reveal any significant abnormalities.
CMR acquisition
CMR was performed using a 1.5 T scanner (HdxT or MR450 GE Medical Systems, Milwaukee, USA). Images were acquired with a 32-channel phased-array cardiac coil and a vector electrocardiogram for R-wave triggering.
The complete imaging protocol included 3D respiratory-navigated balanced steady-state free precession sequence, first-pass perfusion (FPP) before and after dipyridamole injection, unenhanced cine steady-state free precession (cine SSFP) in short axis. Cine-MR echo-gradient images were used to locate the anatomic axes of the heart.
The 3D respiratory-navigated balanced steady-state free precession sequence (3D FIESTA) was used to visualize cardiac and great vessels anatomy (T2 prepared, fat special, flip angle 65°, four RR intervals).
The 4D flow MRI data were acquired using a gadolinium-based contrast agent (Gadovist 1 mmol/mL, Bayer, Mijdrecht, The Netherlands). The images were acquired during free-breathing, using retrospective ECG gating to produce a 3D volume covering the entire heart and great vessels.12 The parameters were as follows: TR/TE, 2.7/2.2 ms; flip angle, 10°; acquisition voxel, 2.1 mm × 2.1 mm × 2.4 mm; reconstructed voxel size, 1.4 mm × 1.4 mm × 1.2 mm; with 30 cardiac phases. The velocity encoding value was individually adapted to yield images without aliasing artefacts (200–400 cm/s).
Image analysis
Neo-aortic root was analysed in multiplanar reformatted images from 3D sequences. A mean value of cusp-to-commissure and cusp-to-cusp diameters was obtained. Body surface area (BSA) was derived from weight and height according to the method described by Haycock et al.13,Z scores for cusp-to-commissure diameter were calculated using the method published by Kaiser et al.14 Neo-aortic regurgitation was evaluated by 4D flow CMR.
The 4D flow MRI data sets were processed using an in-house MATLAB application (MathWorks, Natick, MA, USA),15 which includes the semiautomatic segmentation, the generation of the tetrahedral finite element mesh (element volume 1 mm3), the velocity field interpolation, and the haemodynamics parameters quantification. The time average complex difference images were segmented using a semiautomatic process, based on thresholding, labelling, and manual separation of the vessels. The tetrahedral finite elements were created using the iso2mesh MATLAB toolbox.16 After the mesh generation, we computed the velocity vector at each node of the mesh using cubic interpolation on the 4D flow MRI data sets. Finally, the 3D haemodynamic parameters and the curvature were calculated using a combination of finite element interpolation method and the Laplacian approach.17–20
All results were visualized using the scientific visualization software Paraview (Kitware Inc., Clifton Park, NY, USA). A summary of the proposed quantification process is described in Figure 1A.

(A) Steps of the proposed quantification process. From the 4D flow MRI acquisition, a semiautomatic segmentation of the aorta was generated and transformed into a tetrahedral mesh. Then, the velocity values were interpolated from the 4D flow data to each node of the mesh using cubic interpolation, and finally, the 3D maps of 18 haemodynamic parameters were calculated using finite elements. Six different regions of the ascending aorta and aortic root aorta were created to compare the data between control and TGA patients (B). In (C), we show the region where the curvature was calculated in one TGA patient and one control.
The ascending aorta of the group of controls and TGA patients was semi-automatically divided into six regions. Three regions for the root and three regions the ascending aorta between the end of the root and the pulmonary bifurcation were created in anterior left (Ant-L), anterior right (Ant-R), and posterior (Pos) orientations (see Figure 1B). To divide the root from the ascending aorta, we manually placed a 2D plane perpendicular to the wall in the last part of the root. To divide the ascending aorta from the aortic arch, we used the same protocol but at the level of pulmonary bifurcation. Then, this location was projected to the proximal descending aorta to separate the aortic arch. These sections were generated using anatomical references as the centreline of the pulmonary artery in TGA patients, and the bifurcation point between the pulmonary artery and the aorta for controls.
In each region, we calculated the mean value of 15 haemodynamic parameters described in Table 1. The regurgitation fraction and oscillatory shear index (OSI) were calculated along the entire cardiac cycle. The curvature21 was analysed only in the aortic arch beginning from the level of pulmonary bifurcation (Figure 1C). In Supplementary data online, Description S1, we show a complete description of the quantification of each haemodynamic parameters analysed in this study.
Haemodynamic parameters analysed in this study, each of them calculated at peak systolic cardiac phases
| Parameters | Related to |
|---|---|
| 1. Velocity (m/s) | Flow |
| 2. Forward velocity (m/s) | Flow |
| 3. Backward velocity (m/s) | Flow |
| 4. WSS (N/m2) | Stress |
| 5. WSS-axial (N/m2) | Stress |
| 6. WSS-circumferential (N/m2) | Stress |
| 7. Oscillatory shear index (−)b | Stress |
| 8. Vorticity (1/s) | Turbulence |
| 9. Helicity density (m/s2) | Turbulence |
| 10. Viscous dissipation (1e3/s2) | Turbulence |
| 11. Energy loss ) | Turbulence |
| 12. Kinetic energy ) | Flow |
| 13. Velocity angle (o) | Turbulence |
| 14. Regurgitation fraction (%)b | Flow |
| 15. Eccentricity (%) | Skewness |
Also, we show the relation between them grouped with a keyword.
Flow = parameters that are related directly with the blood flow measurements. Stress = parameters related with the stress induced at the wall. Turbulence = parameters that are related with the rotational behaviour of the flow. Skewness = parameter related with the directional-displacement of the blood flow.
Calculated using all cardiac phases.
Total time involved in the post-processing workflow for each case is around 10 min with a standard computer (Intel Core i7, 16 Gb RAM); 5 min for segmentation (thresholding, labelling, and manual cleaning), 1 min for generation of the tetrahedral finite element mesh, and 4 min for the velocity field interpolation and the haemodynamic parameters quantification.
Statistical analysis
Two blinded observers read the images independently. The statistical study was performed on Stata™ v14.1. Categorical variables were expressed as percentages. The continuous variables having a normal distribution were expressed as mean values, accompanied by their standard deviation. All continuous variables having a non-normal distribution were expressed as median values and 25th and 75th quartiles. Analysis of continuous variables was performed by use of an unpaired t-test when normally distributed. A P-value of <0.05 was accepted as significant. Categorical variables were analysed by a two-tailed Fisher’s exact test. A Mann–Whitney U test was used to assess the differences in each section between controls and TGA patients; additionally, to find which parameters are more relevant to differentiate controls and TGA in each section, we used the minimum redundancy maximum relevance (MRMR) algorithm. Correlation between curvature or root dilatation and each haemodynamic parameter in TGA patients and controls were evaluated using Spearman correlation. To assess the differences between the haemodynamics parameters between the root sections and ascending aorta sections for the group of TGA patients, we performed the Wilcoxon test.
Results
Seventy-eight percent of patients had a dilated neo-aortic root (neo-aortic root Z score > 2, Z score values ranged from −0.3 to 6, and mean Z score 2.9 ± 1.6) following a normal distribution as proved by a non-significant Shapiro–Wilk test of normality. One patient had clinically relevant neo-aortic valve regurgitation (regurgitation fraction of 37%). Demographic and clinical variables of TGA patients and controls are shown in Table 2.
Demographic characteristics of patients and controls
| TGA patients | Controls | P | |
|---|---|---|---|
| N | 14 | 8 | |
| Gender (male) | 64% | 63% | 0.933 |
| Anatomy | |||
| TGA IVS | 64% | NA | |
| TGA VSD | 29% | NA | |
| TGA VSD CoAo | 7% | NA | |
| Age at CMR (years) | 14.5 ± 2.3 | 12.2 ± 4.3 | 0.116 |
| Weight at CMR (kg) | 57 ± 15 | 42 ± 16 | 0.046 |
| Height at CMR (cm) | 163 ± 14 | 146 ± 19 | 0.026 |
| BSA at CMR (m2) | 1.60 ± 0.3 | 1.30 ± 0.33 | 0.033 |
| LVEF% | 60 ± 4 | 59 ± 4 | 0.59 |
| Aortic Z scores | |||
| Annulus | 2.36 ± 1.6 | 0.33 ± 0.69 | 0.003 |
| Aortic root | 2.90 ± 1.6 | −0.34 ± 0.98 | <0.001 |
| ST junction | 2.56 ± 1.8 | −0.39 ± 1.03 | <0.001 |
| Ascending aorta | 0.43 ± 1.42 | −1.33 ± 0.72 | 0.004 |
BSA, body surface area; CMR, cardiac magnetic resonance; CoAo, coarctation of the aorta; IVS, intactventricular septum; LVEF, left ventricular ejection fraction; PAB, pulmonary artery banding; TGA, transposition of the great arteries; VSD, ventricle septal defect.
Three-dimensional maps of the haemodynamic parameters analysed in this study are shown in Figure 2 for one representative TGA patient and one representative control.
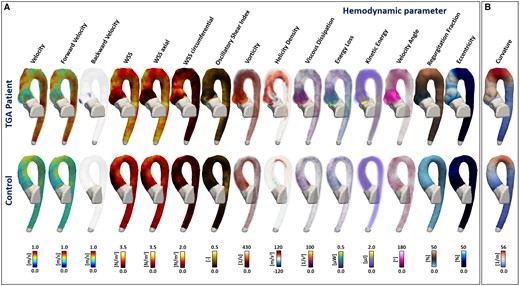
Three-dimensional maps of the haemodynamic parameters analysed in this study. (A) The columns represent each analysed parameter with the same order as Table 1. In the first row, we show a representative TGA patient and in the second row a representative control. The 3D maps of figure (B) represent the curvature calculated for each case. Differences between the showed TGA patient and control in the root and ascending aorta are visible for several parameters: backward velocity, WSS, WSS axial, WSS circumferential, vorticity, helicity density, velocity angle, regurgitation fraction, and eccentricity. Also, the aortic arch curvature was different between the TGA patient and control.
Tables 3 and 4 show the mean values and standard deviation of each haemodynamic parameter, in each analysed section, for TGA patients and controls.
Mean values and SD of each haemodynamic parameters analysed in this study for the root regions of TGA-patients and controls
| Parameters | Group | Ant-L | Ant-R | Pos |
|---|---|---|---|---|
| Mean (SD) | Mean (SD) | Mean (SD) | ||
| 1. Velocity (m/s) | TGA | 0.655 (0.205) | 0.717 (0.193) | 0.738 (0.139) |
| Control | 0.689 (0.159) | 0.735 (0.083) | 0.819 (0.157) | |
| 2. Forward velocity (m/s) | TGA | 0.561 (0.268) | 0.647 (0.205) | 0.630 (0.241) |
| Control | 0.671 (0.157) | 0.716 (0.081) | 0.805 (0.155) | |
| 3. Backward velocity (m/s) | TGA | 0.013 (0.021) | 0.004 (0.005)* | 0.023 (0.037)* |
| Control | 0.001 (0.001) | 0.000 (0.001)* | 0.000 (0.000)* | |
| 4. WSS (N/m2) | TGA | 1.219 (0.454) | 1.356 (0.529) | 1.543 (0.330) |
| Control | 1.151 (0.553) | 1.172 (0.231) | 1.737 (0.480) | |
| 5. WSS-axial (N/m2) | TGA | 0.921 (0.521) | 1.133 (0.608) | 1.215 (0.403)* |
| Control | 1.099 (0.545) | 1.111 (0.213) | 1.723 (0.482)* | |
| 6. WSS-circumferential (N/m2) | TGA | 0.559 (0.338)* | 0.497 (0.268) | 0.648 (0.449)* |
| Control | 0.222 (0.099)* | 0.265 (0.122) | 0.149 (0.058)* | |
| 7. Oscillatory shear index (−) | TGA | 0.072 (0.035) | 0.054 (0.031) | 0.089 (0.042) |
| Control | 0.051 (0.018) | 0.056 (0.019) | 0.103 (0.063) | |
| 8. Vorticity (1/s) | TGA | 91.304 (19.708) | 81.248 (26.053) | 100.574 (35.929) |
| Control | 91.039 (21.945) | 98.248 (24.293) | 70.050 (19.327) | |
| 9. Helicity density (m/s2) | TGA | 7.420 (16.137) | −3.633 (20.948) | −7.238 (22.570) |
| Control | 6.445 (7.642) | 0.805 (11.906) | −9.271 (11.920) | |
| 10. Viscous dissipation (1e3/s2) | TGA | 13.582 (4.906) | 14.063 (6.557) | 14.328 (7.849) |
| Control | 14.840 (7.390) | 15.354 (7.304) | 11.478 (6.305) | |
| 11. Energy loss (µW) | TGA | 0.095 (0.034) | 0.098 (0.046) | 0.100 (0.055) |
| Control | 0.106 (0.054) | 0.109 (0.053) | 0.082 (0.045) | |
| 12. Kinetic energy (µJ) | TGA | 0.466 (0.259) | 0.545 (0.261) | 0.547 (0.228) |
| Control | 0.531 (0.221) | 0.576 (0.139) | 0.647 (0.263) | |
| 13. Velocity angle (o) | TGA | 31.309 (21.404) | 22.489 (10.816)* | 28.672 (22.443)* |
| Control | 13.664 (5.902) | 12.155 (4.936)* | 8.907 (2.798)* | |
| 14. Regurgitation fraction (%) | TGA | 6.000 (6.548) | 5.818 (6.183) | 5.927 (6.267) |
| Control | 1.386 (1.129) | 1.390 (1.289) | 0.013 (0.013) | |
| 15. Eccentricity (%) | TGA | 22.666 (14.103)* | 22.702 (13.963)* | 22.381 (13.839) |
| Control | 7.168 (3.487)* | 7.210 (3.499)* | 0.072 (0.034)* |
Statistically significant P-value < 0.05, Mann–Whitney U test. All bold values have a statistical significance of P-value<0.05, Mann-Whitney U Test.
Mean values and SD of each haemodynamic parameters analysed in this study for the ascending aorta regions of TGA patients and controls
| Parameters | Group | Ant-L | Ant-R | Pos |
|---|---|---|---|---|
| Mean (SD) | Mean (SD) | Mean (SD) | ||
| 1. Velocity (m/s) | TGA | 0.832 (0.170) | 0.931 (0.224) | 0.780 (0.164) |
| Control | 0.701 (0.185) | 0.759 (0.083) | 0.829 (0.159) | |
| 2. Forward velocity (m/s) | TGA | 0.776 (0.169) | 0.891 (0.211) | 0.725 (0.192) |
| Control | 0.683 (0.176) | 0.729 (0.077) | 0.812 (0.149) | |
| 3. Backward velocity (m/s) | TGA | 0.000 (0.000) | 0.000 (0.000) | 0.000 (0.000) |
| Control | 0.000 (0.000) | 0.000 (0.000) | 0.000 (0.000) | |
| 4. WSS (N/m2) | TGA | 1.973 (0.421) | 2.515 (0.552)* | 2.030 (0.343) |
| Control | 1.444 (0.623) | 1.521 (0.238)* | 2.073 (0.372) | |
| 5. WSS-axial (N/m2) | TGA | 1.743 (0.464) | 2.398 (0.581)* | 1.811 (0.543) |
| Control | 1.394 (0.603) | 1.339 (0.219)* | 2.032 (0.381) | |
| 6. WSS-circumferential (N/m2) | TGA | 0.648 (0.415)* | 0.557 (0.349) | 0.575 (0.431)* |
| Control | 0.227 (0.137)* | 0.554 (0.305) | 0.258 (0.083)* | |
| 7. Oscillatory shear index (−) | TGA | 0.069 (0.049) | 0.048 (0.028) | 0.069 (0.036) |
| Control | 0.045 (0.016) | 0.041 (0.017) | 0.047 (0.030) | |
| 8. Vorticity (1/s) | TGA | 83.383 (35.817) | 58.363 (22.443)* | 83.310 (38.297) |
| Control | 75.316 (27.805) | 96.757 (34.552)* | 52.397 (23.294) | |
| 9. Helicity density (m/s2) | TGA | 12.618 (37.858) | −6.447 (18.572)* | −18.972 (36.262) |
| Control | 12.878 (17.529) | 21.261 (22.050)* | −6.734 (15.076) | |
| 10. Viscous dissipation (1e3/s2) | TGA | 11.650 (8.557) | 9.902 (7.352) | 8.735 (5.495) |
| Control | 11.656 (5.110) | 13.975 (7.493) | 8.824 (5.619) | |
| 11. Energy loss (µW) | TGA | 0.081 (0.060) | 0.069 (0.052) | 0.061 (0.039) |
| Control | 0.083 (0.037) | 0.100 (0.054) | 0.063 (0.041) | |
| 12. Kinetic energy (µJ) | TGA | 0.625 (0.256) | 0.756 (0.349) | 0.539 (0.206) |
| Control | 0.504 (0.241) | 0.571 (0.122) | 0.620 (0.275) | |
| 13. Velocity angle (o) | TGA | 15.719 (9.323) | 12.802 (6.983) | 16.548 (11.927) |
| Control | 11.170 (3.202) | 13.558 (5.539) | 9.132 (1.772) | |
| 14. Regurgitation fraction (%) | TGA | 4.028 (7.603)* | 4.032 (7.615)* | 4.046 (7.551)* |
| Control | 0.298 (0.199)* | 0.299 (0.200)* | 0.301 (0.200)* | |
| 15. Eccentricity (%) | TGA | 23.571 (13.299) | 23.589 (13.279) | 23.664 (13.307) |
| Control | 12.210 (2.788) | 12.110 (2.500) | 12.301 (2.510) |
Statistically significant P-value < 0.05, Mann–Whitney U test. All bold values have a statistical significance of P-value<0.05, Mann-Whitney U Test.
The Mann–Whitney U test showed that the aortic arch curvature was significantly different between TGA patients 46.238 ± 5.581 m−1 and controls 41.066 ± 5.323 m−1. Considering the sections of the aortic root, several haemodynamic parameters were significantly different between TGA patients and controls, namely the backward velocity, WSS axial, WSS circumferential, velocity angle, and eccentricity (Table 3). Regarding the sections of the ascending aorta, significant differences between patients and controls were also present in the measured WSS, WSS axial, WSS circumferential, and vorticity. In addition to this, helicity density and regurgitation fraction also differed significantly different between TGA patients and controls (Table 4). These results are in concordance with those shown in Figure 2.
The minimum redundancy maximum relevance (MRMR) algorithm was applied in each region (Root Ant-L, Root Ant-R, Root Pos, AAo Ant-L, AAo Ant-R, and AAo Pos), in order to assess the relevant parameters that better describe the differences between controls and TGA patients (see Supplementary data online, Figure S1). We found that the velocity angle, backward velocity, WSS circumferential, and regurgitation fraction are the parameters with better predictor score in all cases. Distribution of scores of relevant haemodynamics parameters in the ascending aorta is very homogeneous in comparison with root regions.
Additionally, we explored the relationship between haemodynamic parameters and aortic arch curvature in all subjects. We found that the correlation between haemodynamic parameters and aortic arch curvature was non-homogenously distributed along with the cross-regional segments of the ascending aorta and aortic root (Table 5). The skewness correlation was higher in the anterior-right and posterior segments of the aortic root, but it shifted towards the anterior-left and posterior segments in the ascending aorta in a clockwise rotation.
Correlations (R-values) between each haemodynamic parameter and the aortic arch curvature
| Root | Ascending aorta | |||||
|---|---|---|---|---|---|---|
| Parameters | Ant-L | Ant-R | Pos. | Ant-L | Ant-R | Pos. |
| 1. Velocity (m/s) | −0.063 | 0.005 | −0.217 | −0.031 | 0.331 | −0.214 |
| 2. Forward velocity (m/s) | −0.136 | −0.198 | −0.302 | −0.226 | 0.293 | −0.374* |
| 3. Backward velocity (m/s) | 0.152 | 0.487* | 0.540* | 0.508* | 0.000 | 0.588* |
| 4. WSS (N/m2) | −0.055 | 0.249 | 0.064 | −0.056 | 0.403* | 0.049 |
| 5. WSS-axial (N/m2) | −0.257 | −0.108 | −0.296 | −0.272 | 0.390* | −0.153 |
| 6. WSS-circumferential (N/m2) | 0.408* | 0.669* | 0.607* | 0.366* | 0.352 | 0.514* |
| 7. Oscillatory shear index (−) | 0.348 | −0.002 | 0.427* | 0.427* | 0.622* | 0.770* |
| 8. Vorticity (1/s) | 0.641* | 0.470* | 0.666* | 0.588* | 0.345 | 0.542* |
| 9. Helicity density (m/s2) | −0.103 | −0.249 | −0.534* | −0.109 | −0.230 | −0.423* |
| 10. Viscous dissipation (1e3/s2) | 0.589* | 0.505* | 0.560* | 0.481* | 0.418* | 0.435* |
| 11. Energy loss () | 0.555* | 0.500* | 0.532* | 0.481* | 0.403* | 0.380* |
| 12. Kinetic energy ) | −0.014 | 0.043 | −0.138 | 0.030 | 0.267 | −0.188 |
| 13. Velocity angle (o) | 0.487* | 0.587* | 0.494* | 0.683* | 0.364* | 0.703* |
| 14. Regurgitation fraction (%) | 0.534* | 0.551* | 0.552* | 0.608* | 0.608* | 0.612* |
| 15. Eccentricity (%) | 0.554* | 0.552* | 0.546* | 0.418* | 0.443* | 0.476* |
Statistically significant P-value < 0.05. All bold values have a statistical significance of P-value<0.05, Mann-Whitney U Test.
The backward velocity, WSS circumferential, vorticity, viscous dissipation, energy loss, velocity angle, regurgitation fraction, and eccentricity significantly correlated with aortic arch curvature in at least two regions of the root and ascending aorta. Although all these parameters had at least two moderate correlations (in the root and ascending aorta) with aortic arch curvature, the velocity angle showed the strongest correlation.
A further analysis was also performed to evaluate the correlation between the haemodynamic parameters and the dilated aortic root in all subjects (Table 6). In this table, we found a significant correlation between some of the proposed haemodynamic parameters and the dilated aortic root. Out of all, seven haemodynamic parameters (forward velocity, backward velocity, WSS axial, WSS circumferential, velocity angle, regurgitation fraction, and eccentricity) showed at least two sections of the ascending aorta or aortic root with significant correlation. From all these parameters, velocity angle and eccentricity in the root showed the strongest correlation with aortic root dilation.
Correlations (R values) between each haemodynamic parameter and the aortic root dilatation
| Root | Ascending aorta | |||||
|---|---|---|---|---|---|---|
| Parameters | Ant-L | Ant-R | Pos. | Ant-L | Ant-R | Pos. |
| 1. Velocity (m/s) | −0.344 | −0.328 | −0.234 | −0.038 | 0.187 | −0.190 |
| 2. Forward velocity (m/s) | −0.477* | −0.427* | −0.289 | −0.107 | 0.167 | −0.264 |
| 3. Backward velocity (m/s) | 0.280 | 0.705* | 0.386* | 0.196 | 0.000 | 0.431* |
| 4. WSS (N/m2) | −0.264 | −0.129 | −0.008 | 0.099 | 0.494* | 0.027 |
| 5. WSS-axial (N/m2) | −0.459* | −0.375* | −0.272 | −0.094 | 0.539* | −0.169 |
| 6. WSS-circumferential (N/m2) | 0.478* | 0.427* | 0.590** | 0.503* | −0.134 | 0.317 |
| 7. Oscillatory shear index (−) | 0.601* | 0.006 | −0.261 | −0.007 | 0.355 | 0.326 |
| 8. Vorticity (1/s) | −0.042 | −0.165 | 0.191 | 0.066 | −0.420* | 0.171 |
| 9. Helicity density (m/s2) | −0.042 | −0.232 | 0.030 | 0.056 | −0.469* | −0.008 |
| 10. Viscous dissipation (1e3/s2) | −0.225 | −0.049 | −0.054 | −0.194 | −0.375* | −0.233 |
| 11. Energy loss | −0.213 | −0.065 | −0.041 | −0.194 | −0.382* | −0.259 |
| 12. Kinetic energy | −0.371* | −0.333 | −0.222 | −0.092 | 0.020 | −0.202 |
| 13. Velocity angle (o) | 0.612* | 0.729* | 0.447* | 0.300 | 0.056 | 0.356 |
| 14. Regurgitation fraction (%) | 0.483* | 0.529* | 0.508* | 0.522* | 0.522* | 0.534* |
| 15. Eccentricity (%) | 0.640* | 0.630* | 0.626* | 0.564* | 0.554* | 0.510* |
Statistically significant P-value < 0.05. All bold values have a statistical significance of P-value<0.05, Mann-Whitney U Test.
Figure 3 shows differences between the root and the ascending aorta regions in the group of TGA patients. Using Wilcoxon test, we found interestingly that parameters, such as velocity, forward velocity, backward velocity, WSS, WSS axial, vorticity, viscous dissipation, energy loss, kinetic energy, velocity angle present significant difference between the root and the ascending aorta in TGA patients group.
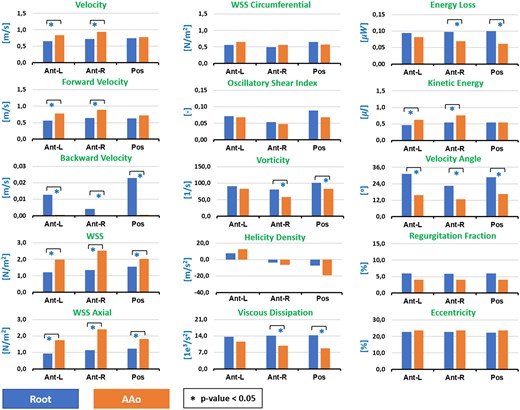
Results of Wilcoxon test. We show the significant differences between root and ascending aorta regions in TGA patients, for the mean value of each haemodynamic parameter analysed in our study.
Discussion
We reported here the most detailed in vivo assessment of complex 3D haemodynamic parameters in ascending aorta in patients after ASO. Our study, based on 4D flow MRI data acquisition, offers a comprehensive vision of all aspects of blood haemodynamic in the aorta. Progressive aortic dilatation is one of the major complications in late follow-up after ASO.
Previous studies showed correlation between aortic arch angulation and aortic dilatation in patients after arterial switch correction of transposition of the great arteries.9,22,23 The missing intermediate step in this correlation is the underlying pathophysiological mechanism to explain the cause–consequence effect between aortic arch curvature and aortic root dilatation.
For that reason, we hypothesized that changes in aortic geometry (as curvature) after the arterial switch operation may alter flow haemodynamics which lastly have an impact on aortic wall remodelling and dilatation. This can be inferred in part by our previous work,9 where we speculated that the principal driving factor for aortic dilatation after ASO is the aortic arch angle and not only an intrinsic pathological component of neo aortic wall, as for example that associated with the bicuspid semilunar valve.
In this study, we confirmed that ASO is associated with change in aortic curvature that becomes more acute in patients after LeCompte manoeuvre in comparison to controls (46.238 ± 5.581 m−1 for TGA and 41.066 ± 5.323 m−1 controls). This geometrical change could drive, therefore, significant differences in several mechanical parameters between patients and controls, such as backward velocity, WSS axial, WSS circumferential, velocity angle, eccentricity at the root level, and WSS, WSS axial, WSS circumferential, vorticity, helicity density and regurgitation fraction at the AAo level (see Tables 3 and 4).
Looking to these parameters in all subjects, we found that the mean values of parameters related to the turbulence and the skewness of the flow (backward velocity, WSS circumferential, velocity angle, regurgitation fraction, and eccentricity) are highly related with the root diameter and curvature (Tables 5 and 6).
We also found that not only the magnitude of WSS in ascending aorta increase in TGA patients as in the study by Palen et al.24 but also that the circumferential WSS is the most crucial component that gives us more considerable statistical differences in both root and ascending aorta (see Tables 3 and 4), and also, significant correlations with aortic arch curvature and root dilation (see Tables 5 and 6). These findings are consistent with previous studies in BAV and Marfan patients,8,25 which demonstrated that WSS circumferential is the biomarker that is most related to dilation.
We know that wall shear stress play an essential role in activating or deactivating various functions of endothelial cells to produce biochemical substances, such as nitric oxide (NO), which promote the initiation and development of vascular pathologies, such as aortic aneurysms.26,27 As expected, we did not find a notorious relation between the mean magnitude of WSS and the dilatation of the root or the curvature of the aortic arch, in concordance with the previously reported work of Fukui et al.,10 where they found that averaged wall shear stress is not related with the dilatation and is mostly the same between controls and patients (see Table 3, WSS parameter).
One of the novelties of this study is to provide a comprehensive understanding of regional flow haemodynamics along the ascending aorta analysing parameters in 3D volumes and not in 2D sections as previous studies did.24,25 Compared with controls, the flow is significantly asymmetric in patients after arterial switch operation (see Tables 3 and 4). As a result, the impact of blood flow forces on the arterial wall is not homogeneously distributed and some regions along the aorta have different ranges of velocities near the vessel wall.
We found interestingly that parameters as, backward velocity, vorticity, viscous dissipation, energy loss, velocity angle, normally related to the turbulence, are significantly higher in the aortic root compared to the ascending aorta in TGA patients group (Figure 3). Additionally, the velocity, forward velocity, WSS, WSS axial, and kinetic energy, shown a different relationship, are significantly higher in the ascending aorta than in the aortic root.
Even more, the distribution of forces is quite different in the three segments that we defined in the aorta (Figure 3). This may explain the differences in regional vessel wall remodelling along the aorta, and why some regions are more prone to dilatation than others accordingly.5
Summarizing briefly the hypothesis based on our results, we may observe that the shape of the aorta and consequentially its curvature is a consequence of surgical procedure of arterial switch, especially the Lecompte manoeuvre, when the pulmonary arteries are transferred towards the anterior part of the thorax while the ascending aorta is moved backward. With this procedure, the ascending and descending portions of the aorta become closer, decreasing the angle of the aortic arch. Consequently, this surgical procedure modifies the directional behaviour of the flow, which may generate a flow disturbance in the root and proximal location of the ascending aorta. This disturbance alters parameters as regional circumferential WSS, eccentricity, backward velocity, velocity angle, and regurgitation fraction, so constituting a potential substrate for dilatation.
Limitations
This is not a longitudinal study and therefore the correlation between aortic arch curvature and haemodynamic variables and aortic dilatation only represents a screen-shot at a fixed time point. Future longitudinal studies will conclude which haemodynamic parameter may be able to early predict aortic root dilatation.
We divided aortic segments into six different regions, according to proximal root and ascending aorta anatomy and according to sinus of Valsalva anatomy. Alternative division methods may provide further insight into flow dynamics.
The movement of the aorta along the cardiac cycle was not considered in this study, only one segmentation was performed to analyse the oscillatory shear index and regurgitation fraction, due to processing limitations of 4D flow MRI data.
We did not apply multiple comparison or correction tests because the objective of this study was to treat each parameter in an independent analysis to evaluate the relevance of each of them. Moreover, the difference between the number of patients vs. the number of controls limited us to carry out multiple comparisons tests in an adequate way, which is why we only used nonparametric tests.
Conclusion
Our data suggest that altered flow dynamics may be a consequence of geometrical aortic changes and it is correlated with aortic root dilatation.
In this article, we demonstrate that haemodynamic parameters related to the turbulence and to skewness of the flow (backward velocity, WSS circumferential, velocity angle, regurgitation fraction, and eccentricity) are highly correlated with the root diameter and curvature. Moreover, the distribution of forces is quite different in the three segments, demonstrating why some regions are more prone to dilatation than others accordingly.
Blood flow dynamics in the aortic domain is such a complex entity that it cannot be reduced to individual variables. The distribution of forces along the ascending aorta is highly inhomogeneous in patients, which it requires further segmental and individual analysis.
The idea of finding a novel haemodynamic parameter to monitor and early predict aortic root dilatation is quite appealing. Future longitudinal studies may focus on the follow-up evaluation of these parameters. As haemodynamic dictates remodelling, early changes in these parameters may guide clinical management before wall remodelling is too late.
Supplementary data
Supplementary data are available at European Heart Journal - Cardiovascular Imaging online.
These authors contributed equally to this work.
Acknowledgements
J.S. thanks to CONICYT—FONDECYT Postdoctorado 2017 #3170737 and ANID FONDECYT de Iniciación en Investigación #11200481.
Funding
This work has been funded by projects PIA-ACT192064 and the Millennium Nucleus on Cardiovascular Magnetic Resonance of the Millennium Science Initiative, both of the National Agency for Research and Development, ANID. Also, CONICYT FONDEF/I Concurso IDeA en dos etapas ID15|10284, and FONDECYT #1181057.
Conflict of interest: The authors declared no conflict of interest.
