


Abstract
Left atrial enlargement predicts incident atrial fibrillation (AF). However, the prognostic value of peak atrial longitudinal strain (PALS) for predicting incident AF in participants from the general population is currently unknown. Our aim was to investigate if PALS can be used to predict AF and ischaemic stroke in the general population.
A total of 400 participants from the general population underwent a health examination, including two-dimensional speckle tracking echocardiography of the left atrium. The primary endpoint was incident AF at follow-up. All participants with known AF and prior stroke at baseline were excluded (n = 54). The secondary endpoint consisted of the composite of AF and ischaemic stroke. During a median follow-up of 16 years, 36 participants (9%) were diagnosed with incident AF and 30 (7%) experienced an ischaemic stroke, resulting in 66 (16%) experiencing the composite outcome. PALS was a univariable predictor of AF [per 5% decrease: hazard ratio (HR) 1.42; 95% confidence interval (CI) (1.19–1.69), P < 0.001]. However, the prognostic value of PALS was modified by age (P = 0.002 for interaction). After multivariable adjustment PALS predicted AF in participants aged <65 years [per 5% decrease: HR 1.46; 95% CI (1.06–2.02), P = 0.021]. In contrast, PALS did not predict AF in participants aged ≥65 years after multivariable adjustment [per 5% decrease: HR 1.05; 95% CI (0.81–1.35), P = 0.72]. PALS also predicted the secondary endpoint in participants aged <65 years and the association remained significant after multivariable adjustment.
In a low-risk general population, PALS provides novel prognostic information on the long-term risk of AF and ischaemic stroke in participants aged <65 years.
Introduction
Atrial fibrillation (AF) is the most common cardiac arrhythmia affecting approximately 3% of the general population and is becoming a major health problem due to its increasing prevalence.1 AF is associated with increased risk of stroke, heart failure, and death.2 Consequently, AF is associated with significant healthcare costs driven by AF-related complications and treatment costs.3
It is of great clinical importance to identify persons at high risk of developing AF, to ensure preventive strategies and improve the overall prognosis. Among echocardiographic parameters, increased left atrial (LA) volume index (LAVI) is an established independent predictor of incident AF.4 Recently, two-dimensional speckle tracking echocardiography has been applied to the left atrium to assess LA function with high feasibility and reproducibility.5 Peak atrial longitudinal strain (PALS) during the reservoir phase contains both diagnostic and prognostic information in different populations.6 PALS has been demonstrated to be superior to the conventional LA parameters in predicting cardiovascular events.7
The pathophysiology of AF is complex, but structural remodelling with increasing fibrosis is important in forming the substrate for AF.8 It has been demonstrated that in patients with AF, LA wall fibrosis assessed by delayed-enhancement magnetic resonance imaging is inversely related to LA strain.9
We hypothesized that decreased PALS reveals early atrial dysfunction and therefore may be associated with AF. The primary objective of this study was to investigate if PALS can predict incident AF and the composite of AF and ischaemic stroke in a low-risk general population. Furthermore, we sought to investigate whether PALS provides incremental prognostic information to LAVI.
Methods
Study population
The present study included participants examined in the fourth Copenhagen City Heart Study, which is a longitudinal study that assesses cardiovascular disease and risk factors (clinical trial no.: NCT02993172). This study cohort has previously been described in detail.10 The participants underwent a detailed echocardiographic examination from January 2001 to December 2003. Whether a participant underwent echocardiographic examination was independent of health status and other risk factors. Before the examination, all participants gave written informed consent. A total of 2221 participants underwent a health examination including an echocardiographic examination. We excluded participants with a history of AF (paroxysmal, persistent, and permanent) or AF at study enrolment documented by 12-lead electrocardiogram (n = 48). Furthermore, participants with known prior stroke at baseline were excluded (n = 36). A total of 1737 participants were excluded due to inadequate image quality for LA speckle tracking. This left a total of 400 participants for inclusion in the present study. Baseline characteristics by exclusion status are shown in Supplementary data online, Table S1.
The study was performed in accordance with the second Declaration of Helsinki and the study protocol was approved by the Regional Ethics Committee.
Health examination
A detailed description of the health examination is available in Supplementary data online, Expanded Methods.
Echocardiography
Vivid 5 ultrasound systems (GE Healthcare, Horten, Norway) with a 2.5 MHz transducer were used by three experienced sonographers to perform the echocardiographic examinations. All participants were examined with conventional two-dimensional echocardiography and Tissue Doppler imaging (TDI). All echocardiograms were stored on optical disks and on external hard drives (FireWire, LaCie, France). The echocardiograms were imported to the local archive in EchoPac and analysed offline with commercially available software (EchoPac version 2008, GE Medical, Horten, Norway).
A detailed description of the conventional two-dimensional echocardiography and TDI is available in Supplementary data online, Expanded Methods.
Speckle tracking echocardiography
Two-dimensional speckle tracking analysis was performed offline on the digitally stored cine-loops recordings using the Q-analysis module. Subsequently, the two-dimensional strain module was selected, and one of the algorithms used for the three apical views (4CH, 2CH, and APLAX) was chosen. These three algorithms were programmed for the left ventricle but were used for both LA and left ventricular (LV) speckle tracking analyses.
LV two-dimensional speckle tracking echocardiography was performed by using an automated function that defined a region of interest (ROI). This has previously been described in detail.11 Global longitudinal strain (GLS) was calculated as an average peak strain from the three apical views. LA two-dimensional speckle tracking echocardiography was performed in four-chamber, two-chamber, and three-chamber views. Mean frame rate was 57 frames per second. The onset of the QRS-complex was used as a reference point (Figure 1). The LA endocardial border was traced manually by a point and click technique. The ROI was adjusted to cover the entire myocardium and divided into six segments by the software. In case of inaccurate speckle tracking of one of these segments, the ROI was readjusted. If the readjustments were unsuccessful, the segment was excluded. The PALS in each apical view was defined as the peak LA strain value during the cardiac cycle. PALS was measured in the three apical views and averaged to a global value.
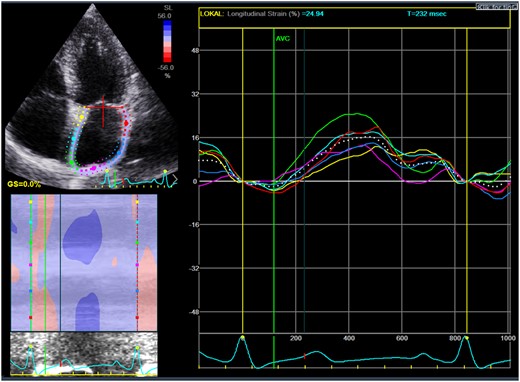
Measurement of left atrial strain by two-dimensional speckle tracking. The coloured lines denote regional strain and the white dotted line denotes the averaged value of left atrial strain.
Follow-up and endpoints
The participants were followed from the examination in 2001 through 2003 until April 2018 or time of event. The primary endpoint was AF at follow-up. The secondary endpoint consisted of the composite of AF and ischaemic stroke. The endpoints were obtained from the Danish National Board of Health’s National Patient Registry using ICD-10 codes. Follow-up was 100%.
Statistics
A detailed description of statistical analysis is available in Supplementary data online, Expanded Methods. In brief, univariable and multivariable Cox proportional hazard regression models were used to assess the prognostic value of PALS. The extent of the multivariable analysis was limited by the number of events. Restricted cubic spline models were constructed using Poisson regression models to estimate the incidence rate of the outcomes. Harrell’s C-statistics were obtained from univariable Cox proportional hazards regression models to test the prognostic performance.
Results
Baseline characteristics by tertiles of PALS
The population demographics stratified by tertiles of PALS are shown in Table 1. The participants mean age was 56 ± 16 years, 41% (n = 163) were male, 36% (n = 143) had hypertension, mean systolic and diastolic blood pressure were 134 ± 24 mmHg and 78 ± 13 mmHg, respectively, and mean heart rate was 65 ± 11 beats per minute. The mean value of PALS was 37%.
Baseline clinical characteristics according to tertiles of PALS
| Tertiles of PALS | All | 1st tertile | 2nd tertile | 3rd tertile | P for trend |
|---|---|---|---|---|---|
| N | n = 400 | n = 134 | n = 133 | n = 133 | |
| PALS range, % | <31.2% | 31.2–40.0% | >40.0% | ||
| Demographics | |||||
| Sex, male | 163 (41%) | 55 (41%) | 53 (40%) | 55 (41%) | 0.96 |
| Age, years | 56 ± 16 | 64 ± 15 | 56 ± 15 | 47 ± 15 | <0.001 |
| Clinical characteristics | |||||
| Hypertension, n (%) | 143 (36%) | 63 (48%) | 50 (38%) | 30 (23%) | <0.001 |
| Diabetes, n (%) | 33 (8%) | 11 (8%) | 13 (10%) | 9 (7%) | 0.67 |
| Systolic blood pressure (mmHg) | 134 ± 24 | 141 ± 26 | 133 ± 24 | 126 ± 19 | <0.001 |
| Diastolic blood pressure (mmHg) | 78 ± 13 | 80 ± 15 | 79 ± 12 | 75 ± 12 | 0.001 |
| IHD, n (%) | 20 (5%) | 14 (10%) | 4 (3%) | 2 (1.5%) | 0.001 |
| Heart rate (bpm) | 65 ± 11 | 65 ± 11 | 67 ± 10 | 64 ± 11 | 0.56 |
| BMI (kg/m2) | 25 ± 3 | 25 ± 4 | 25 ± 3 | 24 ± 3 | <0.001 |
| Smoking | |||||
| Previous | 121 (33%) | 34 (28%) | 47 (38%) | 40 (33%) | 0.42 |
| Current | 121 (33%) | 43 (35%) | 35 (29%) | 43 (34%) | 0.97 |
| Never | 125 (34%) | 45 (37%) | 41 (33%) | 39 (32%) | 0.42 |
| Laboratory work | |||||
| Cholesterol (mmol) | 5.5 ± 1.2 | 5.7 ± 1.3 | 5.6 ± 1.1 | 5.2 ± 1.1 | <0.001 |
| eGFR (mL/min/1.73 m2) | 75 ± 15 | 71 ± 15 | 77 ± 14 | 78 ± 15 | <0.001 |
| Plasma proBNP (pmol/L) | 17 (7–30) | 20 (12–40) | 16 (6–27) | 15 (6–26) | <0.001 |
| Echocardiography | |||||
| LV hypertrophy, n (%) | 61 (17%) | 30 (28%) | 18 (15%) | 13 (11%) | 0.001 |
| LV dilatation, n (%) | 19 (5%) | 4 (4%) | 5 (4%) | 10 (8%) | 0.11 |
| LVEF (%) | 60 ± 1 | 60 ± 1 | 60 ± 2 | 60 ± 1 | 0.61 |
| GLS (%) | −19 ± 3 | −18 ± 3 | −19 ± 3 | −20 ± 3 | <0.001 |
| LVMI (g/m2) | 82 (71–98) | 87 (73–105) | 80 (69–94) | 79 (71–93) | <0.001 |
| LAVI (mL/m2) | 21 ± 7 | 23 ± 8 | 20 ± 6 | 20 ± 5 | <0.001 |
| LAD (cm) | 3.4 ± 0.4 | 3.5 ± 0.5 | 3.4 ± 0.4 | 3.3 ± 0.4 | 0.001 |
| E/e′ | 9 (8–12) | 12 (9–15) | 9 (8–11) | 8 (7–10) | <0.001 |
| E/A | 1.1 (0.9–1.5) | 1.0 (0.8–1.2) | 1.0 (0.9–1.4) | 1.3 (1.1–1.7) | <0.001 |
| DT (ms) | 164 ± 42 | 165 ± 47 | 165 ± 34 | 163 ± 44 | 0.74 |
A, peak transmitral late diastolic inflow velocity; BMI, body mass index, DT, deceleration time of early diastolic inflow; E, peak transmitral early diastolic inflow velocity; e′, average peak early diastolic longitudinal mitral annular velocity determined by colour TDI; eGFR, estimated glomerular filtration rate; IHD, ischaemic heart disease; LAD, left atrial dimension; LAVI, left atrial volume index; LVEF, left ventricular ejection fraction; LVMI, left ventricular mass index; proBNP, pro B-type natriuretic peptide.
At baseline, decreasing tertiles of PALS was significantly associated with older age, higher systolic and diastolic blood pressure, larger body mass index (BMI) and higher prevalence of hypertension. Lower PALS was also significantly associated with higher plasma levels of cholesterol, higher levels of pro B-type natriuretic peptide (proBNP), and lower estimated glomerular filtration rate values. Regarding echocardiography, lower PALS was significantly associated with lower values of GLS, greater prevalence of LV hypertrophy, larger LV mass index (LVMI), larger LAVI, and higher values of E/e′ (Table 1).
Baseline characteristics according to the outcome of AF
Participants who developed AF were older, had higher systolic and diastolic blood pressure, higher prevalence of hypertension, and higher levels of proBNP. Furthermore, they had larger LVMI, larger LAVI and higher E/e′ than those who remained free of AF (Supplementary data online, Table S2).
Prognostic value of PALS
During a median follow-up of 16 years (interquartile range, 13.6–16.2 years), 36 participants (9%) were diagnosed with incident AF and 30 (7%) experienced an ischaemic stroke, resulting in 66 (16%) experiencing the composite outcome. The risk of AF increased incrementally with decreasing tertile of PALS, being approximately 10-fold higher in the 1st tertile as compared to the 3rd tertile [hazard ratio (HR) 9.82; 95% confidence interval (CI) (2.95–32.63), P < 0.001; Figure 2A]. The risk of the composite outcome also increased incrementally with decreasing tertile of PALS, being approximately five-fold higher 1st tertile as compared to the 3rd tertile [HR 4.55; 95% CI (2.25–9.17), P < 0.001; Figure 2B].
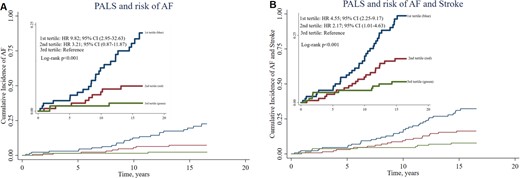
Cumulative survival curves by the Kaplan–Meier method for the population stratified according to tertiles of PALS. (A) Association between PALS and risk of AF. (B) Association between PALS and risk of the composite outcome.
PALS was a univariable predictor of AF with 42% increased risk per 5% decrease in PALS [per 5% decrease: HR 1.42; 95% CI (1.19–1.69), P < 0.001; Figure 3A]. However, the prognostic value of PALS was modified by age (P = 0.002 for interaction; Figure 3B). After adjusting for sex, BMI, hypertension, diabetes, systolic blood pressure, and heart rate, PALS predicted AF in participants aged <65 years [per 5% decrease: HR 1.46; 95% CI (1.06–2.02), P = 0.021; Table 2, Model 3]. In contrast, PALS did not predict AF in participants aged >65 years, when adjusting for the same clinical variables [per 5% decrease: HR 1.05; 95% CI (0.81–1.35), P = 0.72; Table 2, Model 3]. With additional adjustment of Model 3 including either LAVI, LV ejection fraction (LVEF), LVMI, E/e′, or proBNP, PALS remained an independent predictor of AF only in participants aged <65 years (Table 2).

Association between PALS and long-term risk of AF. (A) Displaying the unadjusted incidence rate of AF (events per 100 person-years) on the left y-axis. The PALS is shown on the x-axis. The percentage of the population corresponding to the histogram is displayed on the right y-axis. The full black and dotted black lines indicate the risk association with 95% confidence intervals. (B) According to age.
The prognostic value of PALS in predicting AF
| Participants < 65 years (events = 11) | Participants ≥ 65 years (events = 25) | |||
|---|---|---|---|---|
| PALS, per 5% decrease | HR (95% CI) | P-value | HR (95% CI) | P-value |
| Unadjusted | 1.60 (1.15–2.21) | 0.005 | 1.02 (0.81–1.29) | 0.88 |
| Model 1 | 1.54 (1.10–2.16) | 0.012 | 1.06 (0.84–1.35) | 0.62 |
| Model 2 | 1.46 (1.05–2.03) | 0.024 | 1.04 (0.81–1.32) | 0.77 |
| Model 3 | 1.46 (1.06–2.02) | 0.021 | 1.05 (0.81–1.35) | 0.72 |
| Model 4 | 1.55 (1.10–2.18) | 0.012 | 0.86 (0.66–1.13) | 0.29 |
| Model 5 | 1.54 (1.09–2.17) | 0.014 | 1.08 (0.83–1.40) | 0.58 |
| Model 6 | 1.49 (1.03–2.16) | 0.036 | 1.06 (0.81–1.38) | 0.69 |
| Model 7 | 1.41 (1.02–1.95) | 0.038 | 0.94 (0.72–1.22) | 0.63 |
| Model 8 | 1.41 (1.03–1.93) | 0.033 | 1.04 (0.81–1.33) | 0.75 |
Model 1: adjusted for sex and BMI. Model 2: adjusted for sex, BMI, hypertension, and diabetes. Model 3: adjusted for sex, BMI, hypertension, diabetes, systolic blood pressure, and heart rate. Model 4 is identical to Model 3 with additional adjustment for LAVI. Model 5 is identical to model 3 with additional adjustment for LVEF. Model 6 is identical to Model 3 with additional adjustment for LVMI. Model 7 is identical to Model 3 with additional adjustment for E/e′. Model 8 is identical to Model 3 with additional adjustment for proBNP.
AF, atrial fibrillation; BMI, body mass index; CI, confidence interval; E, peak transmitral early diastolic inflow velocity; e′, average peak early diastolic longitudinal mitral annular velocity determined by colour TDI; HR, hazard ratio; LAVI, left atrial volume index; LVEF, left ventricular ejection fraction; PALS, peak atrial longitudinal strain; proBNP, pro B-type natriuretic peptide.
PALS was also a univariable predictor of the composite outcome of AF and ischaemic stroke [per 5% decrease: HR 1.30; 95% CI (1.15–1.47), P < 0.001, Figure 4A]. The prognostic value of PALS was modified by age (P = 0.003 for interaction, Figure 4B). After multivariable adjustment PALS predicted AF and ischaemic stroke in participants aged <65 years (Table 3). Baseline characteristics for the participants stratified according to age are displayed in Supplementary data online, Table S3.
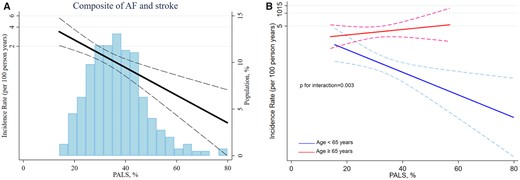
(A) Association between PALS and long-term risk of the composite outcome. (B) According to age.
The prognostic value of PALS in predicting the composite outcome of AF and ischaemic stroke
| Participants < 65 years (events = 21) | Participants ≥ 65 years(events = 45) | |||
|---|---|---|---|---|
| PALS, per 5% decrease | HR (95% CI) | P-value | HR (95% CI) | P-value |
| Unadjusted | 1.60 (1.15–2.21) | 0.005 | 1.02 (0.81–1.29) | 0.88 |
| Model 1 | 1.33 (1.05–1.67) | 0.016 | 0.96 (0.80–1.14) | 0.61 |
| Model 2 | 1.27 (1.01–1.58) | 0.038 | 0.94 (0.79–1.13) | 0.51 |
| Model 3 | 1.28 (1.02–1.61) | 0.036 | 0.94 (0.79–1.13) | 0.50 |
| Model 4 | 1.30 (1.03–1.64) | 0.028 | 0.85 (0.70–1.04) | 0.11 |
| Model 5 | 1.30 (1.02–1.64) | 0.031 | 0.94 (0.79–1.13) | 0.54 |
| Model 6 | 1.29 (1.01–1.64) | 0.043 | 1.03 (0.84–1.26) | 0.80 |
| Model 7 | 1.30 (1.02–1.65) | 0.032 | 0.91 (0.75–1.10) | 0.35 |
| Model 8 | 1.32 (1.04–1.68) | 0.022 | 0.93 (0.78–1.11) | 0.40 |
Model 1: adjusted for sex and BMI. Model 2: adjusted for sex, BMI, hypertension, and diabetes. Model 3: adjusted for sex, BMI, hypertension, diabetes, systolic blood pressure, and heart rate. Model 4 is identical to Model 3 with additional adjustment for LAVI. Model 5 is identical to Model 3 with additional adjustment for LVEF. Model 6 is identical to Model 3 with additional adjustment for LVMI. Model 7 is identical to Model 3 with additional adjustment for E/e′. Model 8 is identical to Model 3 with additional adjustment for proBNP.
AF, atrial fibrillation; BMI, body mass index; CI, confidence interval; E, peak transmitral early diastolic inflow velocity; e′, average peak early diastolic longitudinal mitral annular velocity determined by colour TDI; HR, hazard ratio; LAVI, left atrial volume index; LVEF, left ventricular ejection fraction; PALS, peak atrial longitudinal strain; proBNP, pro B-type natriuretic peptide.
The prognostic value of GLS and PALS
In a Cox model including PALS and GLS, only PALS was a significant predictor of AF [HR 1.41; 95% CI (1.14–1.73), P = 0.001]. In contrast, in this model, GLS was not a significant predictor of AF [HR 0.96; 95% CI (0.86–1.08), P = 0.55]. For the composite outcome of AF and ischaemic stroke, only PALS was a significant predictor of AF [HR 1.31; 95% CI (1.13–1.51), P < 0.001] in a model including PALS and GLS. In contrast, GLS was not a significant predictor of AF [HR 1.01; 95% CI (0.92–1.09), P = 0.91]. Therefore, the GLS was not included in our multivariable models. Furthermore, PALS had the highest C-statistics value of 0.65, while GLS had a C-statistics value of 0.57.
Incremental prognostic value of PALS in addition to LAVI
We assessed the incremental value of adding PALS to LAVI. PALS provided incremental prognostic information over LAVI with regard to predicting AF (Harrell’s C-statistics 0.69 vs. 0.75, P = 0.044) and the composite of AF and ischaemic stroke (Harrell’s C-statistics 0.59 vs. 0.66, P = 0.025) in participants from the general population.
Discussion
In the present prospective study of participants from the general population, who underwent two-dimensional speckle tracking echocardiography with PALS assessment, we found that PALS was a significant and independent predictor of AF and ischaemic stroke in participants aged <65 years. Additionally, PALS provided incremental prognostic information over the LAVI in predicting AF and ischaemic stroke.
A variety of clinical scores have been developed to predict risk of AF12 and among echocardiographic parameters, increased LAVI is an established independent predictor of incident AF.4 Identifying new predictors of AF is important because the prevalence of AF is increasing, and preventive strategies may therefore have a public health impact.
In participants from the general population, we have previously investigated if functional measures of the left atrium could predict AF. We found that the minimal LA volume (LAVmin) and left atrium emptying fraction were independent predictors of AF. However, this particularly applies to participants without hypertension and enlarged left atrium.13 Hence other echocardiographic parameters are needed to assess AF risk in participants from the general population with other comorbidities.
In a multiethnic population free of cardiovascular diseases MESA (Multi-Ethnic Study of Atherosclerosis), the association between LA volume and function and incident AF was investigated. A total of 197 participants developed AF during a follow-up period of 8 years. Both LAVIMax and decreased LA function assessed as decreased passive and total emptying fractions, and PALS were associated with incident AF.14 However, the study used cardiac magnetic resonance imaging and not echocardiography, making the results harder to apply in the clinical setting of screening participants from the general population.
It has previously been demonstrated that GLS was an independent predictor of incident AF in participants from the general population. The participants (n = 675) were studied prospectively, and 32 (4.7%) developed AF over a mean follow-up period of 4.8 years.15 However, the PALS was not assessed in this study. In patients with Type 2 diabetes (n = 180) it has been shown that GLS was an independent predictor of new-onset AF. During a median follow-up of 2 years, 14 (7.8%) patients developed incident AF and GLS remained an independent predictor of AF after multivariable adjustment.16 However, unfortunately PALS was not assessed in this study.
In the present study, we found no significant difference regarding GLS between the participants who developed AF and those who remained free of AF. Furthermore, we found that PALS was a significant predictor of AF and the composite outcome of AF and stroke, while GLS was not a significant predictor. Furthermore, PALS remained an independent predictor after adjusting for GLS. Another study compared the LA and LV functional measures between patients with lone paroxysmal AF and healthy controls. The PALS was significantly decreased in patients with AF. In contrast, there were no significant difference of LVEF nor GLS between the two groups.17 These findings indicate that PALS, rather than GLS is associated with AF and our results are consistent with these findings.
Recently, it has been demonstrated that reduced LA reservoir strain, reduced GLS and increased LAVI were independently associated with AF in asymptomatic participants ≥65 years of age with more than one AF risk factor (n = 445). During a median follow-up of 15 months, 45 (10%) participants developed incident AF.18 However, this population was more selected when comparing it to our study which included participants from the general population of all ages.
Similar to our findings it has been shown that in patients with first diagnosis of AF (n = 1361), the LA reservoir strain was more impaired in patients who developed stroke compared with patients who did not develop stroke. During a median follow-up of 7.8 years, 100 (7%) patients developed ischaemic stroke. LA reservoir strain was independently associated with the risk of stroke. In contrast, GLS, LVEF, LV dimensions, and LA volumes did not predict the risk of stroke.19 In patients with cryptogenic stroke (n = 371) without a history of AF it has been demonstrated that LA reservoir strain was significantly lower among patients with cryptogenic stroke than control subjects.20
In the present study, the participants aged ≥65 had significantly lower values of PALS than those aged <65 years. It has previously been demonstrated that a decrease in LA reservoir function is one of the earliest changes that occur with normal ageing.21 During normal ageing myocardial fibrosis increases,22 which results in reduced LV compliance and increased LV stiffness.23 These changes leads to impaired LV relaxation24 and reduced passive atrial conduit function.25 During the ageing process the left atrium becomes stiffer with reduced compliance as reflected by decreased LA reservoir function.26,27 Consequently, an augmented active emptying of the left atrium occurs to compensate for the decreased volume transfer from left atrium to left ventricle during early systole.28 During normal ageing, the atrial fibrosis increases further and with altered LA compliance further compensatory augmentation of the active left atrium emptying is prevented. LA enlargement occurs, when the LA stroke volume has to increase beyond that of the Frank–Starling relationship.28
Asymptomatic or silent AF is common and it has been shown that these patients have increased all-cause mortality and increased risk of stroke.29 Hence, even in early stages, AF can have serious adverse events. However, anticoagulation significantly reduces the risk of stroke and mortality in AF patients.1 Thus, early detection of AF is important for timely stroke prevention and improvement in the overall prognosis. Identifying new early predictors of AF is of great clinical value in an effort to identify those at highest risk of developing AF. Hence, the present study has potential clinical implications. The finding that PALS was a significant and independent predictor of AF and ischaemic stroke in participants aged <65 years suggests that LA speckle tracking echocardiography may help identifying individuals at high risk of developing AF among those normally assessed to be at low-risk. Accordingly, our results may suggest to include an assessment of PALS, when performing an echocardiographic examination of individuals from the general population younger than 65 years of age. These individuals may benefit from preventive strategies and closer follow-up for early detection of AF. Furthermore, the individuals at high risk of developing AF could be monitored by the use of continuous electrocardiographic monitoring with implantable loop recorders.
Additionally, we demonstrate that PALS provided incremental prognostic information over the LAVI in predicting AF and ischaemic stroke. The LA function deteriorates before enlargement of the left atrium and functional changes in left atrium are present before AF development.30 Therefore, early detection of these changes in participants at higher AF risk has great clinical impact since LA remodelling can be reversible, especially at early stages. Studies have shown that medications such as angiotensin-converting enzyme inhibitors,31 angiotensin II receptor antagonists,32 and statins33 are associated with improvement of LA function and reduction of incident AF in high-risk populations.34 Hence, these medications could potentially alleviate the risk of AF in patients with decreased PALS.
The most recent guidelines recommend the use of the CHA2DS2VASc score for assessment of stroke risk in AF patients.1 The EACVI AFib Echo Europe Registry is designed to investigate how cardiac imaging can be used to guide prevention of ischaemic stroke.35 Whether echocardiographic parameters including PALS can be used to estimate the risk of stroke in AF patients, will remain unknown until the results from the EACVI AFib Echo Europe Registry are known. Accordingly, we do not recommend to initiate anticoagulation therapy only based on decreased PALS.
PALS seems to be a prognostic marker with regard to predicting AF and ischaemic stroke in participants aged <65 years from a low-risk general population. The prognostic value of PALS for predicting AF was incremental to LAVI. Hence, PALS seems to improve our current echocardiographic parameter to assess AF risk.
Strengths and limitations
A major strength of the present prospective study is a large population with complete long-term follow-up. All endpoints were obtained from Danish registries using ICD-10 codes. Therefore, we cannot state how frequently or rigorously the participants were monitored for AF. However, the Danish National Patient Registry is a valuable tool for epidemiological research.36 The diagnosis of AF was defined as ICD-10 code I48, and this code does not distinguish between AF and atrial flutter, nor between clinical subtypes (paroxysmal, persistent, and permanent). The diagnosis of AF in the ‘Copenhagen City Heart Study’ has previously been validated with high sensitivity and specificity.37 Additionally, the incidence rates of AF found in ‘The Copenhagen City Heart Study’ are very similar to data from the National Institute of Public Health, which demonstrates that this cohort is representative of the general population regarding AF.38
LA speckle tracking was not performed in 1737 participants due to either low frame rate and/or inadequate images and/or if the left atrium was not fully visualized. However, the images were obtained between 2001 and 2003 with outdated ultrasounds systems (Vivid 5, GE Healthcare). The proportion of excluded participants would have been substantially lower if the study was conducted today with more recent ultrasounds systems. Nevertheless, since the echocardiograms were performed many years ago, the present study includes a very long follow-up time, making it possible to identify predictors of AF even in patients with a priori low-risk (individuals from the general population younger than 65 years of age). Hence, the limitation of image quality for LA strain might be outwaited by the very long follow-up time. We assessed the PALS, which corresponds to the LA reservoir function. Unfortunately, the active/booster function and conduit function were not assessed in the current study. However, the LA reservoir function correlates well with the extent of LA fibrosis independent of other echocardiographic parameters.9
We analysed LA strain using EchoPac software. However, the differences between vendor software for assessment of LA strain remain a challenge to the widespread use and applicability of LA strain.39 Furthermore, consensus on normal reference values are currently not clearly defined.
Our multivariable models may be subject to potential overfitting due to the low number of events. However, this approach can be acceptable when the focus is on controlling for confounders rather than building prediction models.40 Furthermore, the reclassification analysis was not used to test incremental improvement in the current study. Our results contribute with important evidence for generating hypotheses, but future and larger clinical studies are required to confirm our findings.
Conclusion
In the general population, PALS provides novel prognostic information on the long-term risk of AF and ischaemic stroke, in participants aged <65 years. In addition, PALS provides incremental prognostic information over the LAVI in predicting AF and ischaemic stroke in the general population.
Supplementary data
Supplementary data are available at European Heart Journal - Cardiovascular Imaging online.
Funding
A.S.A. was funded by a research grant from the Gangsted Foundation. The sponsor had no role in the study design, data collection, data analysis, data interpretation, or writing of the article.
Conflict of interest: none declared.
Data availability
We are not allowed to make the data publicly available in accordance with the data protection rules in Denmark.
