


Abstract
The influence haemodynamics have on vessel wall pathobiology in aortic disease is incomplete. This aim of this study was to develop a repeatable method for assessing the relationship between aortic wall shear stress (WSS) and disease activity by fusing 4D flow cardiovascular magnetic resonance (CMR) with hybrid positron emission tomography (PET).
As part of an ongoing clinical trial, patients with bicuspid aortic valve (BAV) were prospectively imaged with both 18F-sodium fluoride (18F-NaF) PET, a marker of calcification activity, and 4D flow CMR. We developed novel software allowing accurate 3D co-registration and high-resolution comparison of aortic peak systolic WSS and 18F-NaF PET uptake (maximum tissue-to-background ratio). Intra-observer repeatability of both measurements was determined using Bland–Altman plots and intra-class correlation coefficients (ICCs). The relationship between localized WSS and 18F-NaF uptake was analysed using linear mixed-effect models. Twenty-three patients with BAV (median age 50 [44–55] years, 22% female) were included. Intra-observer repeatability for WSS (ICC = 0.92) and 18F-NaF (ICC = 0.91) measurements obtained within 1.4 ± 0.6 cm2 regions of interest was excellent. On multivariable analysis, 18F-NaF PET uptake was independently and negatively associated with WSS as well as diastolic blood pressure (both P < 0.05), adjusted for age.
Fused assessment of WSS and 18F-NaF PET uptake is feasible and repeatable, demonstrating a clear association between these two factors. This high spatial resolution approach has major potential to advance our understanding of the relationship between vascular haemodynamics and disease activity.
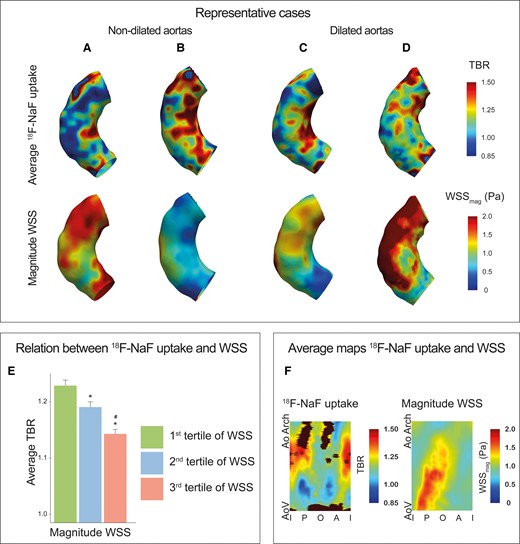
Inverse relationship between 18F-NaF activity and magnitude WSS in the ascending aorta of patients with bicuspid aortic valve disease. (A–D) Representative cases demonstrating increased 18F-NaF activity and lower magnitude WSS on the inner curve of the ascending aorta in patients with BAV with and without aortic aneurysms. (E) Bar graph demonstrating decreasing aortic 18F-NaF activity across magnitude WSS tertiles; *P < 0.05 vs. first tertile; #P < 0.05 vs. second tertile. (F) An average 18F-NaF uptake and WSS map calculated from all the BAV patients, again showing an inverse relationship between 18F-NaF uptake (left) and magnitude WSS (right) measurements made within 1.4 ± 0.6 cm2 regions of interest. A, anterior; AoArch, aortic arch; AoV, aortic valve; BAV, bicuspid aortic valve; I, inner; O, outer; P, posterior; WSS, wall shear stress.
Introduction
Disturbed wall shear stress (WSS) profiles play an important role in the initiation and progression of arterial disease: in particular, atherosclerosis1 and aneurysm formation.2 Understanding the mechanisms underpinning the relationship between vascular haemodynamics and disease activity will be invaluable for preventing disease initiation as well as identifying novel therapeutic targets.
Due to different valve fusion patterns and associated variable WSS patterns in the proximal aorta,3 bicuspid aortic valve (BAV) disease is an ideal condition for investigating this relationship. With 4D flow cardiovascular magnetic resonance (CMR), areas with increased aorta WSS are identified, and these regions are associated with aortic degeneration on histology.4 While these histological studies have improved our understanding of aortic wall remodelling, they have limitations. First, biopsies only provide an assessment of pathology at a single point in time, usually the very end stages of the disease when patients come to surgery. Histological methods do not provide information on early disease, which may be more amenable to therapy, and cannot detect changes in pathology over time. A second limitation is the potential for sampling error. Biopsies only assess a small region of the aorta and differences in WSS and aortic pathology are notoriously focal. Finally, biopsies are not suitable for routine clinical assessment given their invasive nature and serial sampling is not possible.
Combining 4D flow CMR with positron emission tomography (PET) imaging could represent a step forward in addressing these limitations, providing detailed non-invasive comparison of WSS measurements with molecular assessment of disease activity with potential for serial imaging over time. The PET 18F-sodium fluoride (18F-NaF) identifies areas of vascular calcification activity.5 It serves as a marker of disease activity across multiple vascular disease states, consistently demonstrating an association with future disease progression and adverse events.6–8 We here describe a novel method that allows accurate co-registration of 4D flow CMR and 18F-NaF PET datasets to compare WSS and 18F-NaF uptake within small regions across the aorta. Our aim was to demonstrate the feasibility and repeatability of this approach and to investigate the relationship between WSS and disease activity in patients with BAV disease.
Methods
Patients
Patients >40 years old with BAV were recruited from April 2018 until December 2020. Exclusion criteria included inability to undergo CMR, estimated glomerular filtration rate <30 mL/min/1.73 m2, connective tissue disorder, and previous contrast allergy. All patients underwent a comprehensive baseline clinical assessment. The study was approved by the local institutional review board (REC reference: 18/SS/0136 and written informed consent was acquired for all patients).
Aortic pressure and pulse wave velocity measurements
Aortic pulse pressure and pulse wave velocity was determined using applanation tonometry (Sphygmacor Xcel, ATCOR, USA). Aortic systolic and diastolic pressures were estimated using brachial blood pressure and pulse wave analysis through validated software.9 Aortic pulse pressure was the difference between systolic and diastolic aortic pressures. Carotid-femoral pulse wave velocity was calculated by dividing the distance between the carotid and femoral pulses by the time difference for the pulse to reach each artery, determined using concomitant electrocardiogram.
PET-CT acquisition and reconstruction
The method of PET-CT image acquisition has been described before.10 In short, scans were performed 60 min after intravenous injection of 250 MBq 18F-NaF on a hybrid PET-CT scanner (128-multidetector Biograph mCT, Siemens Medical Systems, Erlangen, Germany) at a single centre. ECG-gated breath-hold CT scanning (non-contrast-enhanced) of the entire heart and thoracic aorta was performed. Attenuation correction CT was performed immediately before PET data acquisition (100–120 kV, current 40–50 mA) and reconstructed at 5-mm slice thickness. PET data were acquired with concomitant ECG recording in list mode during a 10-min bed position and were reconstructed with the Siemens Ultra-HD reconstruction algorithm with a resolution of 3.2 × 3.2 × 5.0 mm. Unlike coronary arteries, the aorta is not greatly affected by the effects of cardiac motion. Motion correction approaches were therefore not applied to the 18F-NaF quantification in the aorta.11
CMR acquisition
Image acquisition was performed on a 3.0T clinical MRI scanner (Biograph mMR, Siemens Healthcare, Erlangen, Germany) with software version syngo MR E11 using a 16-channel Siemens anterior body flex and spine TIM coil. The CMR protocol consisted of 4D flow (prototype) CMR covering the ascending aorta, 2D phase contrast images at the level of the sinotubular junction, steady-state free precession (SSFP) cine imaging at the sinus of valsalva and in the axial plane at the level of the right pulmonary artery, left ventricular short-axis SSFP cine imaging for ventricular volume assessment as well as 2-, 3- and 4-chamber SSFP long axis cine images. 4D flow CMR was performed with an acquired resolution of 2.4 × 3.5 × 2.5 mm, a reconstructed resolution of 2.4 × 2.4 × 2.5 mm, 13–35 cardiac phases per cardiac cycle, echo time 2.2 ms, repetition time 39.8 ms and flip angle 8–15°. 4D flow data was acquired using prospective cardiac gating and during free breathing by using respiratory navigator gating, velocity encoding was set at 150 cm/s and increased if necessary.
Image analysis
From 4D flow CMR, peak systolic WSSs were determined between the aortic valve and innominate artery using CAAS MR Solutions 5.1 (Pie Medical Imaging, Maastricht, The Netherlands). This was accomplished by segmenting the aortic lumen based on the magnitude and velocity image at the peak systolic phase, defined as the phase with the maximum flow. Additional WSS measurements were performed using the 4D flow CMR phase directly before and after this peak systolic phase and the WSS measurements from these three cardiac phases were then averaged and mapped on the average lumen segmentation. Subsequently, the magnitude of the WSS vector, magnitude WSS, was decomposed into an axial and circumferential component. Besides the magnitude, axial, and circumferential WSS, the angle was calculated between the magnitude and axial WSS, the WSS angle.
The peak systolic aortic lumen segmentation was exported from CAAS as a polygon file format encoded with 3D peak systolic WSS and imported into FusionQuant v1.20.05.14 (Cedars-Sinai Medical Center, Los Angeles, USA). Novel software was implemented in FusionQuant to allow the fusion of the WSS encoded 3D polygon and PET data (Figure 1). Three-dimensional colocalization between PET and CT image was performed in multiplanar reconstruction as previously described (see Supplementary data online, Figure S1).10 The WSS polygon was manually aligned and co-registered with the PET acquisition in three orthogonal planes (see Supplementary data online, Figure S2). To account for misalignment, the maximum standardized uptake values (SUVs) located on a 6 mm perpendicular tangent (3 mm inwards and 3 mm outwards) from each node, was determined using linear interpolation, allowed PET data to be added to the WSS-encoded 3D polygon. The SUV was the decay-corrected tissue concentration of 18F-NaF divided by the injected dose/body weight.
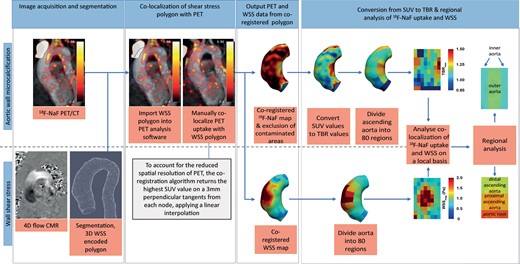
Workflow methodology.
In some cases, there is spill over from high signal originating from the aortic valve or bone, which might potentially contaminate 18F-NaF measurements in the aorta. To exclude regions with bone or valve contamination, a SUV threshold was determined representing the maximum thoracic aortic SUV, excluding contaminated areas. Datapoints with SUV values above this threshold were removed from the data and thus considered contaminated. As SUV measurements are influenced by variability in 18F-NaF uptake in the blood, SUV values were divided by background SUV, measured using 2.0 cm3 volumes of interest drawn in both the right and left atria. This provided the maximum tissue-to-background ratio (TBR) as a corrected measure of aortic wall tracer uptake.
Average WSS (magnitude, axial, circumferential and angle) and both the mean and 95th percentile 18F-NaF TBR were evaluated in the ascending aorta using an 80 region model. Magnitude WSS and WSS angle were used as our primary haemodynamic assessment. In brief, the aorta was divided in to 10 equal regions across its length and further divided in to 8 circumferential regions (each occupying 45 degrees of the circumference) (Figure 1). The resultant eighty regions were chosen because they provide the highest spatial resolution possible given the spatial resolution of PET (approximately 5mm). However, in principle, any sized region of interest (ROI) can be used for comparison of WSS and PET data with this approach. All analyses were repeated using forty regions of interest in the aorta: 90 degrees circumferentially and one-tenth of length longitudinally resulting in regions of approximately 2 cm2. Regional values were grouped depending on their location in the inner or outer curvature as well as their level within the aorta ascending (aortic root, proximal ascending aorta and distal ascending aorta, Figure 1).
Aortic regurgitation severity was graded as mild (regurgitation fraction 5–20%), moderate (20–33%) or severe (>33%) based on 2D flow phase contrast images. Aortic stenosis was graded as none (peak aortic jet velocity ≤2.0m/s), mild (2.0–2.99 m/s), moderate (3.0–3.99 m/s), or severe (≥4.0 m/s) based on 2D flow phase contrast images. Left ventricular function was determined based on short axis SSFP images. Aortic diameters were measured at end-diastole on SSFP imaging. Aortic root diameter was measured at the sinus of valsalva at end-diastole using the cusp-commissural method and ascending aorta diameters measured at the level of the right pulmonary artery. The maximum diameter was taken as the largest aortic diameter measured in either the root or ascending aorta. Presence of thoracic aortic aneurysm was defined as a maximal diameter ≥40 mm.
Statistical analysis
For continuous variables, we calculated the mean and standard deviation or the median and interquartile range (IQR) in cases of skewed distribution. Categorical data were summarized with frequencies and percentages. Baseline characteristics were compared with a Mann–Whitney test.
To assess the repeatability of this co-localization method, intra-observer repeatability of WSS and PET data was assessed for each region of aortic luminal segmentation. To prevent recall bias, the WSS assessment was repeated more than 6 months after the initial assessment in 15 randomly selected aortas and the PET measurement repeated in 10 randomly selected cases more than 4 weeks after the initial assessment. The repeatability data were reported using Bland–Altman analysis and intra-class correlation coefficients (ICC). The ICC was computed using a two-way ANOVA model to determine observer variability based on a single measure and absolute agreement.
Linear mixed models with a random intercept for each patient were used to investigate (i) local differences between aortic root, proximal and distal ascending aorta in WSS and 18F-NaF uptake (average TBR and 95th percentile TBR), (ii) local differences between patients with and without an aneurysm, and (iii) the local relationship of clinical and WSS parameters (magnitude WSS, axial WSS, circumferential WSS and WSS angle) with average 18F-NaF uptake. To account for spatial autocorrelation, a spatial Gaussian correlation structure was used in the models, based on the x-, y- and z-coordinates of regions. Standardized x-, y- and z-coordinates of regions were used for comparison between patients (aneurysm vs. no aneurysm). For the analysis of local differences, the spatial correlation structure led to instability of the models and, therefore, no spatial correlation structure was implemented in these linear mixed models. The associations of demographic variables, cardiovascular risk factors, valvular pathology and aortic diameters (all independent) with average TBR (dependent) were tested with uni- and multivariable linear mixed models. Potential parameters were entered in the multivariable linear mixed model if P < 0.25 in univariable analysis.
Statistical analyses were conducted using R Statistical Software version 4.1.0 (R Foundation for Statistical Computing, Vienna, Austria). Two-tailed P-values of <0.05 were considered statistically significant.
Results
Patient population
Twenty-three patients with a BAV were included (Table 1). Median age was 50 [IQR 44–55] years, and five (22%) were female. The commonest aortic valve subtype was a left–right fusion pattern in 16 (70%) patients. Median aortic root diameter was 39 [IQR 34–42] mm, ascending aortic diameter was 38 [IQR 36–42] mm, and maximum aorta diameter was 40 [IQR 38–43] mm, with half of the patients (n = 12, 52%) demonstrating an aortic aneurysm. Using the 80 region model, the average ROI size was 1.4 ± 0.6 cm2. Using the 40 segment model, it was 2.8 ± 1.0 cm2.
Baseline characteristics
| All patients (N = 23) | Patients with a non-dilated aorta (N = 11) | Patients with a dilated aorta (N = 12) | |
|---|---|---|---|
| Age | 50 (44–55) | 51 (44–54) | 50 (45–55) |
| Female sex | 5 (22%) | 2 (18%) | 3 (25%)c |
| Height (m) | 1.78 (1.69–1.80) | 1.74 (1.66–1.79) | 1.80 (1.76–1.84)c |
| Weight (kg) | 87 (76–96) | 82 (76–96) | 89 (81–94)c |
| Body surface area (m2) | 2.03 (1.95–2.12) | 2.00 (1.84–2.08) | 2.07 (2.02–2.14)c |
| Systolic blood pressure (mmHg) | 128 (123–148) | 136 (117–148) | 127 (123–141)c |
| Diastolic blood pressure (mmHg) | 80 (73–83) | 80 (75–87) | 77 (71–83)c |
| Heart rate (beats/min) | 60 (54–65) | 59 (53–67) | 61 (56–64)c |
| Risk factors | |||
| Hypertension | 8 (35%) | 3 (27%) | 5 (42%)c |
| Diabetes | 0 (0%) | 0 (0%) | 0 (0%) |
| Hyperlipidaemia | 0 (0%) | 0 (0%) | 0 (0%) |
| Smoker (ex or current) | 6 (26%) | 4 (36%) | 2 (17%)c |
| Coarctation | 3 (13%) | 2 (18%) | 1 (8%)c |
| Medication | |||
| Angiotensin receptor blocker | 4 (17%) | 1 (9%) | 3 (25%)c |
| Angiotensin converting enzyme inhibitor | 6 (26%) | 2 (18%) | 4 (33%)c |
| Beta-blocker | 0 (0%) | 0 (0%) | 0 (0%) |
| Statin | 0 (0%) | 0 (0%) | 0 (0%) |
| LVEF (%) | 66 (64–71) | 65 (64–71) | 66 (63–71) |
| Aortic valve morphology | |||
| BAV sievers type 0 | 3 (13%) | 2 (18%) | 1 (8%) |
| BAV sievers type 1 LR | 16 (70%) | 7 (64%) | 9 (75%) |
| BAV sievers type 1 RN | 4 (17%) | 2 (18%) | 2 (17%) |
| Aortic stenosis | |||
| None | 13 (57%) | 6 (55%) | 7 (58%) |
| Mild | 6 (26%) | 5 (45%) | 1 (8%) |
| Moderate | 4 (17%) | 0 (0%) | 4 (33%) |
| Severe | 0 (0%) | 0 (0%) | 0 (0%) |
| Aortic regurgitation | |||
| None | 11 (48%) | 6 (55%) | 5 (42%) |
| Mild | 7 (30%) | 4 (36%) | 3 (25%) |
| Moderate | 4 (17%) | 0 (0%) | 4 (33%) |
| Severe | 1 (4%) | 1 (4%) | 0 (0%) |
| Aortic diameters | |||
| Aortic root diameter (mm) | 39 (34–42) | 36 (34–39) | 41 (36–42)c |
| Aortic root diameter (mm/m2)a | 19 (18–20) | 18 (16–20) | 20 (19–20)c |
| Ascending aortic diameter (mm) | 38 (36–42) | 36 (33–38) | 42 (40–44)c |
| Ascending aortic diameter (mm/m2)a | 19 (18–22) | 18 (17–19) | 21 (19–23)c |
| Maximum aortic diameter (mm) | 40 (38–43) | 38 (36–39) | 43 (42–46)c |
| Maximum aortic diameter (mm/m2)a | 20 (18–22) | 18 (18–22) | 21 (20–24)c |
| Ascending aortic calcium score (AU) | 0 (0–0) | 0 (0–0) | 0 (0–0) |
| Aortic stiffness | |||
| Pulse wave velocity (m/s) | 7.45 (6.39–10.41)b | 8.49 (7.09–12.17)b | 6.39 (6.31–8.44)c |
| Distensibility (mmHg−1) | 0.27 (0.17–0.38) | 0.27 (0.21–0.62) | 0.22 (0.16–0.35)c |
Values are presented as numbers (percentages) or median (IQR).
Diameters are corrected for body surface area.
Missing in one patient.
P-value < 0.05 of Mann–Whitney test comparing non-dilated with dilated aortas.
AU, Agatston Units; LR, left-right; RN, right-non.
Repeatability studies
Intra-observer repeatability was excellent for the WSS analyses within the 1.4 ± 0.6 cm2 regions (Figure 2A). The ICC value for WSS magnitude measurements was 0.92 [95% CI 0.91–0.93], 0.92 [95% CI 0.90–0.92] for axial WSS, 0.86 [95% CI 0.84–0.87] for circumferential WSS, and 0.87 [95% CI 0.86–0.89] for WSS angle (Figure 2B–D).
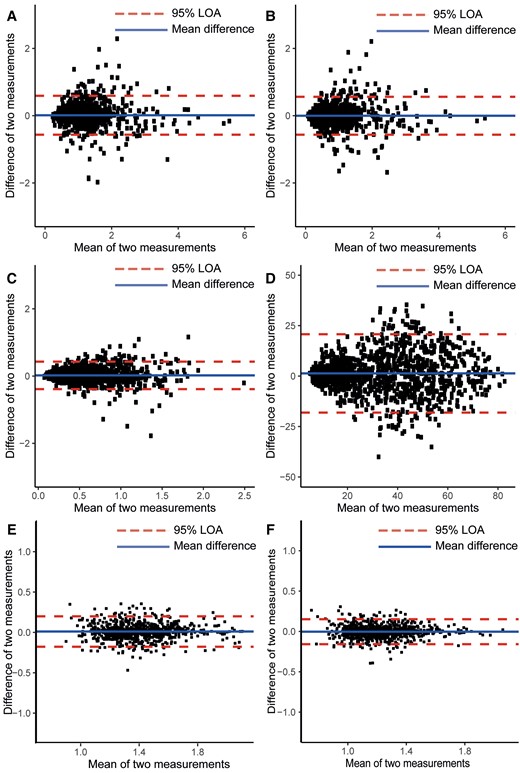
Bland–Altman plots of intra-observer repeatability of WSS and PET metrics measured within 1.4 ± 0.6 cm2 ROIs. (A) Magnitude WSS, (B) axial WSS, (C) circumferential WSS, and (D) WSS angle, (E) average 18F-NaF uptake, and (F) 95th centile 18F-NaF uptake. Blue line shows the intra-observer difference, and red dotted lines show the 95% limits of agreement for measurements. LOA = limit-of-agreement.
Intra-observer agreement of the 18F-NaF uptake measurements within each 1.4 ± 0.6 cm2 region was also excellent with an ICC of 0.91 [95% CI 0.90–0.92] for the average TBR (Figure 2E) and an ICC of 0.91 [95% CI 0.89–0.92] for the 95th percentile TBR (Figure 2F).
Wall shear stress
In the ascending aorta, magnitude WSS was 0.97 [IQR 0.69–1.34]Pa, the axial WSS was 0.69 [IQR 0.47–1.02]Pa and circumferential WSS was 0.48 [IQR 0.36–0.72]Pa (see Supplementary data online, Table S1). The WSS angle was 35 [IQR 25–47]°. Magnitude and axial WSS were lower in the inner half compared to the outer half (see Supplementary data online, Table S1; Figure 3), (both P < 0.001). In general, aortic flow was helical, with a higher WSS angle observed at the inner aorta 38 [IQR 29–49]°, compared with the outer aorta 31 [IQR 22–44]° and in the proximal ascending aorta compared with the aortic root and distal ascending aorta (all P < 0.001). Magnitude WSS values were significantly lower in the distal ascending aorta compared with the proximal ascending aorta and the aortic root (see Supplementary data online, Table S1; Figure 3B). Between the proximal ascending aorta and distal ascending aorta, the flow became less helical as both circumferential and WSS angle decreased, while axial WSS was similar in both regions (circumferential WSS proximal 0.59 [IQR 0.43–0.85]Pa, distal 0.39 [IQR 0.27–0.59]Pa, WSS angle proximal 41 [IQR 31–54]°, distal 29 [IQR 20–39]°, Supplementary data online, Table S1).
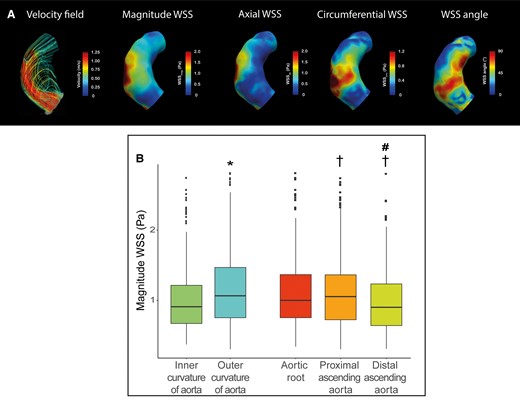
(A) Representative case of peak systolic velocity field, magnitude WSS, axial WSS, circumferential WSS in a patient with BAV with left–right fusion. Streamlines show helical flow in the inner curvature, higher magnitude WSS and circumferential WSS in the proximal aorta compared with the distal aorta. (B) Boxplot of the regional magnitude WSS analysis comparing *P < 0.05inner curvature vs. outer curvature and †P < 0.05 compared with aortic root, #P < 0.05 compared with proximal ascending aorta.
Comparing patients with (n = 12) and without aortic aneurysm (n = 11), magnitude, axial, and circumferential WSSs were similar (see Supplementary data online, Table S1). Only the WSS angle was higher in patients with an aneurysm compared with patients without (aneurysms 38 [IQR 28–50]°, normal size aortas 32 [IQR 23–43]°, P = 0.011). The difference in WSS angle was most prominent in the inner aorta (WSS angle normal size aortas 34 [IQR 25–45]°, aneurysms 41 [IQR 32–52]°, P = 0.003) and in the aortic root (WSS angle normal size aortas 30 [IQR 23–39]°, aneurysms 38 [IQR 31–43]°, P = 0.003).
Aortic 18F-NaF uptake
18F-NaF uptake in the aorta was focal in nature and in this relatively young cohort consistently observed in the absence of macroscopic calcium on CT (ascending aortic calcium score was 0 Agatston units in all patients). Average TBR uptake was 1.19 ± 0.19 and the 95th centile TBR was 1.36 ± 0.22. Figure 4A shows the average TBR maps demonstrating TBR values within the 1.4 cm2 regions averaged across all the patients. Most contamination occurred adjacent to the aortic valve and in the distal outer part of the ascending aorta, these regions were excluded from our analysis. TBR was significantly higher in the inner half of the aorta compared to the outer half, regardless of dilatation status (Figure 4B, Graphical abstract; Supplementary data online, Table S2). Uptake was also higher in more distal regions of the aorta.
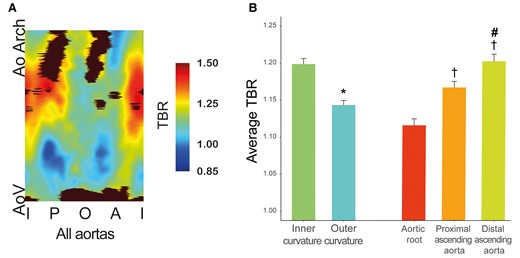
(A) A map of the average 18F-NaF uptake made within 1.4 ± 0.6 cm2 ROIs in ascending aorta across all patients. Bottom is the aortic valve area, top is the aorta at the innominate artery branch, middle represent outer curvature, and left and right border are the inner curvature. Black areas represent regions with contamination from adjacent structures (e.g. aortic valve, bone), which were excluded from analysis. Regions with highest 18F-NaF uptake values are mainly located in the inner curvature of the proximal and distal ascending aorta. (B) Bar graph of the regional 18F-NaF uptake within the aorta *P < 0.05 comparing inner curvature vs. outer curvature, †P < 0.05 compared with aortic root, #P < 0.05 compared to proximal ascending aorta. A, anterior; AoV, aortic valve; AoArch, aortic arch; I, inner; O, outer; P, posterior.
No differences in aortic 18F-NaF uptake were found between patients with an aneurysmal and normal-sized aorta (see Supplementary data online, Table S2) nor were differences observed depending on the patients’ bicuspid valve subtype, degree of valvular stenosis or regurgitation.
Relationship between WSS and 18F-NaF uptake
Magnitude WSS was negatively associated with the average as well as 95th centile 18F-NaF uptake (Graphical abstract). Average TBR was higher in regions of interest with low WSS 1.22 ± 0.20 compared to regions with mid WSS 1.20 ± 0.18 and high WSS 1.15 ± 0.17 (low vs. mid P = 0.015, low vs. high P < 0.001 and mid vs. high P = 0.009). The 95th TBR was also higher in regions of interest with low WSS 1.39 ± 0.23, compared to mid WSS 1.36 ± 0.20 and high WSS regions 1.32 ± 0.21 (low vs. mid P = 0.004, low vs. high P < 0.001 and mid vs. high P = 0.018). The same inverse association between 18F-NaF uptake and magnitude WSS was confirmed when examining the proximal and distal ascending aortas separately (see Supplementary data online, Figure S3B). Also in a sensitivity analysis, in which the ascending aorta was divided into 40 larger regions (area 2.8 ± 1.0 cm2) instead of 80 regions (low WSS 1.21 ± 0.18, mid WSS 1.19 ± 0.17, and high WSS regions 1.15 ± 0.14) (low vs. mid P < 0.001, low vs. high P < 0.001 and mid vs. high P = 0.163).
With respect to the other WSS measurements, a tendency towards a negative association between axial WSS axial and 18F-NaF uptake was also observed, although this was not statistically significant (see Supplementary data online, Figure S3D). Although there was no association with circumferential WSS, there was a tendency towards a positive association between 18F-NaF uptake and WSS angle (low WSS vs. mid WSS P = 0.343, mid vs. high P = 0.002, low WSS vs. high P = 0.092; Supplementary data online, Figure S3D).
Associations with 18F-NaF uptake
Univariable linear regression analysis demonstrated that the magnitude WSS was the only variable associated with the average aortic 18F-NaF uptake (see Supplementary data online, Table S3). Multivariable analysis demonstrated that diastolic blood pressure and magnitude WSS were both independently, negatively associated with average 18F-NaF uptake, when adjusted for age (see Supplementary data online, Table S3).
Discussion
We present a novel high spatial resolution method for combining regional haemodynamic information and molecular disease activity using non-invasive imaging, which is feasible and can be assessed with high repeatability. Specifically, in patients with a BAV we assessed the relationship between aortic WSS derived from 4D flow CMR, and calcification activity determined using 18F-NaF PET/CT. We demonstrated that calcification activity occurred predominantly in the inner curvature of the aorta, and that this reflected an inverse relationship between magnitude WSS and calcification activity.
In this study, we developed a method to connect molecular disease activity assessments with the haemodynamic forces acting on the thoracic aortic wall. Image analysis with a novel bespoke software allows accurate co-registration of these variables and subsequent analysis within high resolution regions of interest, the size of which can be adapted. The intra-observer agreement and repeatability for the regional calculation of both 18F-NaF uptake and WSS are excellent using this approach. These results underline that our registration method and regional analyses are repeatable, laying the foundations for future research assessing the relationship between vessel wall haemodynamics and disease activity with 18F-NaF PET, but which would also apply to a wide range of different molecular radiotracers targeting different disease processes, for example, 18F-FDG (fluoride-18-deoxyglucose) (inflammation) or 18F-AlF-FAPI (aluminium fluoride-18 fibroblast activation protein inhibitors) (fibroblast activation).
The presented method allows for aortic 18F-NaF uptake to be assessed with high spatial resolution, whereas previous quantification methods tended to report overall activity across the aorta.11 This improved topographical detail allows us to assess the pattern and distribution of WSS and 18F-NaF measurements accurately across the ascending aorta, with major advantages to current ‘gold standard’ histological method. Calcification activity is part of a pathological response to vascular tissue damage, most commonly a response to inflammation, and can occur as part of both intimal atherosclerosis or the medial calcinosis observed in aneurysm disease, both of which are focal in nature. The ability to identify these focal areas of increased microcalcification are important, given their association with vascular smooth muscle cell dysfunction, elastin damage, vulnerable plaque disease and reduced biomechanical strength, the latter particularly important in assessing aneurysm risk.11,13,14 There was no difference in overall uptake between those aortas with and without aneurysm, which perhaps is due to the small number of patients studied. A previous histological study has shown that BAV patients have increased histological microcalcification in the aorta wall compared to patients with tricuspid aortic valves, and further that microcalcification increased with age and aneurysm size.15 We did, however, observe a distinct pattern of 18F-NaF uptake in the thoracic aortae of BAV patients, with increased calcification activity observed in the inner curvature and distal ascending aorta, regions that corresponded closely with lower WSS measurements. Indeed, we found a step-wise inverse relationship between magnitude WSS and calcification activity with the highest 18F-NaF uptake in regions exposed to low WSS. Whether this process represents intimal or medial disease remains to be determined. Atherosclerotic plaque development and growth is associated with low and oscillatory WSS.16 Consistent with our findings, the inner curvature is known to be exposed to low WSS and a non-uniform vector direction, indicating complicated flow patterns and disturbed flow and this is also where we observed increased 18F-NaF uptake and where aortic atherosclerosis is known to predominate.17–19
Study limitations
No healthy controls were included in our study, limiting further interpretation of whether the pattern of WSS and 18F-NaF uptake are BAV specific. Whilst comparable to other complex molecular imaging studies, the study population was relatively small and our results need to be confirmed in larger patient populations. Moreover, future longitudinal work will be required to assess the relationship between WSS, change in calcification activity over time as well as any links to aortic dilatation, atherosclerosis progression, or clinical events.
Conclusion
We present a novel method that for the first time allows combination of 4D flow haemodynamic WSS quantification with molecular assessments of disease activity to provide robust high-resolution regional comparisons. In a cohort of patients with a BAV, we found a distinct pattern of 18F-NaF uptake suggesting asymmetrical disease activity that is associated with the pattern of WSS as determined by 4D flow CMR. This novel method could enable future imaging research studies to investigate vital questions about the relationship between vascular haemodynamics and disease activity in a patient-specific manner.
Supplementary data
Supplementary data are available at European Heart Journal - Cardiovascular Imaging online.
Acknowledgements
The authors wish to thank Dr. Ning Jin (Siemens Medical Solutions, USA) for providing the 4D flow prototype sequence.
Funding
This study was supported by the Thorax Foundation, British Heart Foundation and Siemens. M.R.D. is supported by the British Heart Foundation (FS/SCRF/21/32010) and is the recipient of the Sir Jules Thorn Award for Biomedical Research 2015 (15/JTA). D.E.N. is supported by the British Heart Foundation (FS/19/15/34155, CH/09/002, RG/16/10/32375, RE/18/5/34216) and is the recipient of a Wellcome Trust Senior Investigator Award (WT103782AIA). For the purpose of open access, the author has applied a Creative Commons Attribution (CC BY) licence to any Author Accepted Manuscript version arising from this submission.
Data availability
The data that support the findings of this study are available from the corresponding author upon reasonable request.
References
Author notes
S.C.S.M. and A.J.F. contributed equally.
M.R.D. and J.J.W. contributed equally.
Conflict of interest: The authors have no relationships relevant to the content of this paper to disclose. D.E.N. was supported by Toshiba, M.R.D. has received speaker fees from Pfizer and Novartis. He has received consultancy fees from Novartis, Jupiter Bioventures and Silence therapeutics. S.S. has received consultancy fee and research funding from GlaxoSmithKline. Siemens gave institutional support.
