


Abstract
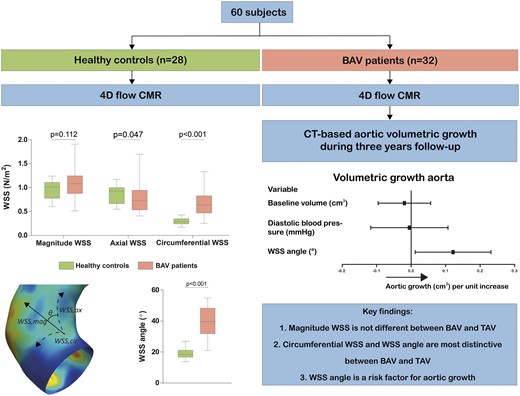
Aortic wall shear stress (WSS) distributions in bicuspid aortic valve (BAV) patients have been associated with aortic dilatation, but prospective, longitudinal data are missing. This study assessed differences in aortic WSS distributions between BAV patients and healthy controls and determined the association of WSS with aortic growth in patients.
Sixty subjects underwent four-dimensional (4D) flow cardiovascular magnetic resonance of the thoracic aorta (32 BAV patients and 28 healthy controls). Peak velocity, pulse wave velocity, aortic distensibility, peak systolic WSS (magnitude, axial, and circumferential), and WSS angle were assessed. WSS angle is defined as the angle between the WSSmagnitude and WSSaxial component. In BAV patients, three-year computed tomography angiography-based aortic volumetric growth was determined in the proximal and entire ascending aorta. WSSaxial was significantly lower in BAV patients compared with controls (0.93 vs. 0.72 Pa, P = 0.047) and WSScircumferential and WSS angle were significantly higher (0.29 vs. 0.64 Pa and 18° vs. 40°, both P < 0.001). Significant volumetric growth of the proximal ascending aorta occurred in BAV patients (from 49.1 to 52.5 cm3, P = 0.003). In multivariable analysis corrected for baseline aortic volume and diastolic blood pressure, WSS angle was the only parameter independently associated with proximal aortic growth (P = 0.031). In the entire ascending aorta, besides the WSS angle, the WSSmagnitude was also independently associated with growth.
Increased WSScircumferential and especially WSS angle are typical in BAV patients. WSS angle was found to predict aortic growth. These findings highlight the potential role of WSS measurements in BAV patients to stratify patients at risk for aortic dilation.
Introduction
Bicuspid aortic valve (BAV) is the most common congenital heart defect, of which 20–84% develop aortic dilation.1,2 Valve-induced abnormal flow patterns are thought to be an important contributor to this aortopathy in BAV.2 Due to the bicuspid valvular morphology, abnormal transvalvular flow patterns occur, these result in eccentric flow jets and changes in aortic wall shear stress (WSS) patterns and levels.3 An asymmetrical flow profile with flow displacement, increased rotational flow, and regional increased WSS have been associated with aortic dilation morphotypes.3–5 However, longitudinal data that link altered haemodynamics to aortic growth is very limited.6
Aortic diameter growth is a slow process, and diameters alone are not optimal to identify patients at risk for aortic dissection as aortic dissection may occur commonly below the current aortic diameter threshold for aortic surgery.7 The combination of aortic diameters and aortic ascending length corrected for body height seems to be a better predictor of aortic dissection and rupture than diameter alone.8 Furthermore, one-dimensional diameters alone do not seem to adequately represent the process of aortic growth and volumes are more sensitive to aortic growth.9,10 Therefore, we hypothesize that WSS can help to predict aortic volume growth in BAV patients.
The aim of this study was (i) to comprehensively investigate differences in WSS levels and components in BAV patients compared with healthy controls using 4D flow cardiovascular magnetic resonance (CMR) and foremost (ii) to assess whether these WSS parameters are associated with ascending aortic volumetric growth in BAV patients using longitudinal data.
Methods
Study population
We prospectively enrolled BAV patients and age-matched controls on a group level. BAV patients were included when (i) aortic velocity >2.5 m/s, (ii) aortic regurgitation ≥moderate, (iii) ascending aortic diameter ≥40 mm, and/or (iv) aortic size index >2.1 cm/m2. Patients underwent transthoracic echocardiography, CMR, and computed tomography angiography (CTA) on the same day during baseline visit and CTA after 3 years of follow-up. Exclusion criteria were: age <18 years, pregnancy, Turner syndrome, contra-indication to contrast media, presence of a non-native valve or ascending aorta or when either baseline 4D flow CMR, baseline or follow-up CTA was unavailable. To establish normal physiological WSS values, age-matched healthy controls with no history of cardiovascular disease and a tricuspid aortic valve underwent CMR. In the healthy controls, no transthoracic echocardiography or CTA was performed. An overview of all image modalities used is shown in Supplementary data online, Table S1.
The study was approved by the local ethics committee (MEC-2014-225 NL and MEC-2014-096 NL) and written informed consent was obtained from all participants. The data that support the findings of this study are available from the corresponding author upon reasonable request.
Cardiovascular magnetic resonance
Image acquisition was performed on a 1.5 T clinical MRI scanner (Discovery MR450 or SIGNA Artist, both GE Healthcare, Milwaukee, WI, USA) using a 32-channel phased-array cardiac surface or anterior phased-array coil. The imaging protocol in patients consisted of two-dimensional (2D) black blood turbo spin echo images of the aorta, 2D phase contrast images at aortic valve level, 2D phase contrast and steady-state free precession (SSFP) images at the level of pulmonary trunk and 4D flow CMR of the entire aorta. In healthy controls, also standard long and short axis SSFP cine images were acquired. A free-breathing, retrospectively ECG-gated 4D flow was acquired prescribed in the axial plane covering the whole thorax after administration of gadolinium contrast agent. Typical 4D flow parameters were: acquired spatial resolution of 1.8 × 2.1 × 2.8 mm and temporal resolution of 44–51 ms and 20 reconstructed phases, repetition time was 1.5–2.3 ms, echo time was 3.8–4.2 ms, flip angle was 15°, VENC was set at 250 cm/s for patients and 180 cm/s for healthy controls, and increased if necessary up to 550 cm/s. Further details on CMR sequences can be found in Supplementary data online, Table S2.
Using CAAS MR Solutions 5.1 (Pie Medical Imaging, Maastricht, The Netherlands), peak systolic WSSs were evaluated: (i) in the proximal aorta between the aortic valve up to 5 cm over the centreline and (ii) in the entire ascending aorta between the aortic valve and just distally of the innominate artery branch (Figure 1A). Regional WSSs were averaged to determine the weighted average and the 95th percentile (maximum) of the regional WSS in the proximal and entire ascending aorta was determined. WSSmagnitude was resolved in WSSaxial and WSScircumferential components. WSS angle was defined as the angle between the WSSmagnitude and WSSaxial component. Furthermore, forward flow, regurgitation fraction, peak aortic valve velocity (in healthy controls), peak aortic velocity, aortic distensibility (Figure 1B), pulse wave velocity (Figure 1C), ejection fraction, and aortic diameters (in healthy controls) were measured. Further details are found in Supplementary data online.
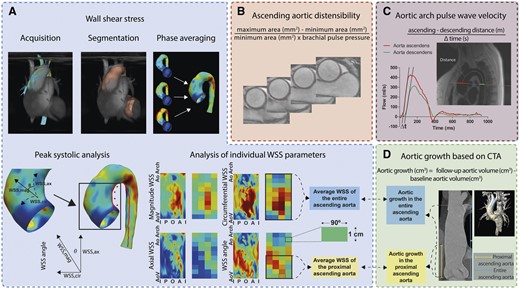
Data analysis overview of the WSS, pulse wave velocity, aortic distensibility, and aortic growth. (A) Peak systolic 4D flow CMR based aortic WSS of the ascending aorta was analysed separately as WSSmagnitude and its components WSSaxial and WSScircumferential. WSS angle is the angle between the WSSmagnitude and WSSaxial. The 2D WSS maps are cut open (over the red line, inner curvature) 3D WSS maps. The WSS measured directly after the aortic valve is indicated with aortic valve (AoV), while the WSS distal in the ascending aorta is indicated as aortic arch (Ao Arch). On the left and right border are WSSs measured at the inner curvature (I), whereas in the centre of the map are WSSs measured at the outer curvature (O). WSSs were averaged per region. Regions are indicated as one box. (B) Aortic distensibility measurement also at the level of the pulmonary artery. (C) 2D flow-based pulse wave velocity measurement at the level of the pulmonary artery. (D) CTA-based aortic growth from the aortic valve up to first 5 cm (proximal ascending aorta) and the distal edge of the innominate artery (entire ascending aorta). A, anterior; CMR, cardiovascular magnetic resonance; CTA, computed tomography angiography; I, inner curvature; O, outer curvature; P, posterior; WSS, wall shear stress.
Computed tomography
At baseline, CTA was performed on the same day as CMR and repeated after 3 years in BAV patients. Acquisition was performed using a dual-source CT (Somatom Force or Somatom Definition Flash, Siemens Healthcare, Forchheim, Germany). Retrospective ECG-gated spiral acquisition was applied and kV was modulated to patient size and a vascular exam type. For the volume measurements, the systolic phase was selected and a reconstruction was made with a slice thickness of 1.0 and 0.6 mm overlap. Scan parameters of the CT imaging for diameter measurements can be found elsewhere11 and the CT scan protocol is in Supplementary data online.
Aortic volumes were determined using 3mensio software 10.1 (Pie Medical Imaging, Maastricht, The Netherlands) in the phase defined as best-systolic by the scanner reconstruction software. Systolic aortic volumes were measured from the aortic valve up to 5 cm over the aortic centreline for proximal ascending aorta measurements, and between the aortic valve and the distal edge of the innominate artery branch for the entire ascending aorta measurements (Figure 1D). The level of the aortic valve annulus was defined as level of the hinge points (defined as the lowest insertion point of the valve leaflet on the aortic wall). In 15 patients, the entire ascending aorta was not completely scanned at either baseline or follow-up and, therefore, only the proximal aortic volume growth could be assessed in these patients. Using the double-oblique technique and in systole, diameters were measured of the aortic root from cusp-to-cusp, of the sino-tubular junction, and of the widest portion of the ascending aorta. Aortic diameters were indexed to height and to body surface area.
Statistics
Continuous values were expressed as mean with standard deviation or as median with interquartile range (IQR) or range in cases of a skewed distribution and categorical data as frequencies and percentages. Differences in baseline characteristics and aortic measurements between patients and healthy controls were tested for significance using an unpaired T-test if normally distributed or a Mann–Whitney test if not normally distributed. Aortic growth between baseline and follow-up was tested with Wilcoxon one-sample test.
Univariable and multivariable linear regression were used to investigate determinants of aortic diameter and volumetric growth. Potential parameters were entered in multivariable linear regression models if P < 0.25 in univariable analysis. Furthermore, determinants that were deemed clinically relevant based on existing literature were considered for multivariable linear regression. Multicollinearity was assessed between determinants and determinants were excluded if the variation inflation factor >5. Furthermore, multicollinearity was suspected of WSSmagnitude and WSS angle with WSSaxial and WSScircumferential and between averaged and maximum WSS values, as such, these sets of covariables were entered separately in multivariable analysis (multivariable analysis 1 with WSSmagnitude and WSS angle and multivariable analysis 2 with WSSaxial and WSScircumferential). Based on the likelihood-ratio test, the optimal multivariable model was chosen. Pearson correlations were calculated between aortic volume growth and potential haemodynamic predictors.
Intra-observer agreement of aortic volume was assessed based on 20 randomly selected CTA with Bland–Altman analysis. Intra-observer agreement of the WSS was assessed based on 15 randomly selected 4D flow CMRs (10 patients and 5 healthy controls). Intra-class correlation coefficient (ICC) and coefficient of variation (COV) were calculated. COV was defined as the standard deviation of the differences of two measurements divided by the mean of their means. The ICC was computed using a two-way analysis of variance model to determine observer reliability based on a single measure and the absolute agreement.
Statistical analyses were conducted using R Statistical Software version 3.6.1 (R Foundation for Statistical Computing, Vienna, Austria). Two-tailed P-values of <0.05 were considered statistically significant.
Results
Study population
Thirty-two BAV patients and 28 age-matched healthy controls were included (Table 1). Of the BAV patients, 16 (50%) had a left–right fusion pattern (BAV-LR), median age was 34 (25–40) years, 23 (72%) were male. Healthy controls were aged 33 (28–48) years and 15 (54%) were female. Baseline aortic diameters were higher in BAV patients compared with healthy controls.
Baseline characteristics
| Healthy controls (n = 28) | Bicuspid aortic valve patients (n = 32) | P-value | |
|---|---|---|---|
| Age (years) | 33 (28–48) | 34 (25–40) | 0.656 |
| Male | 15 (54%) | 23 (72%) | 0.148 |
| Weight (kg) | 72 (66–84) | 79 (71–85) | 0.112 |
| Body surface area (m2) | 1.9 (1.8–2.1) | 2.0 (1.9–2.1) | 0.110 |
| Height (cm) | 179 (174–184) | 183 (177–191) | 0.112 |
| Heart rate (bpm) | 59 (54–66) | 67 (60–78) | 0.008 |
| Systolic blood pressure (mmHg) | 110 (104–118) | 120 (113–131) | 0.005 |
| Diastolic blood pressure (mmHg) | 70 (65–76) | 80 (73–86) | <0.001 |
| Coarctation | 6 (18%) | ||
| Aortic valve morphology | |||
| BAV type 0 | 8 (25%) | ||
| BAV type 1 RL | 16 (50%) | ||
| BAV type 1 RN | 4 (13%) | ||
| BAV type 1 NL | 0 (0%) | ||
| BAV type 2 | 4 (13%) | ||
| Left ventricular ejection fraction (%) | 58 (53–62) | 54 (49–58) | 0.013 |
| Forward flow (mL/beat) | 95 (87–112) | 113 (99–129) | 0.009 |
| Aortic valve regurgitation | |||
| None | 28 (100%) | 15 (47%) | |
| Mild | 14 (44%) | ||
| Moderate | 3 (9%) | ||
| Severe | 0 (0%) | ||
| Peak aortic valve velocity (m/s) | 0.6 (0.5–0.6) | 2.6 (1.9–3.4) | <0.001 |
| Aortic valve stenosis | |||
| None | 28 (100%) | 15 (47%) | |
| Mild | 4 (13%) | ||
| Moderate | 10 (31%) | ||
| Severe | 3 (9%) | ||
| Aortic root diameter (mm) | 32.0 (30.8–34.3) | 39.5 (36.8–42.5) | <0.001 |
| Aortic root diameter (mm/m)a | 17.7 (17.2–19.4) | 22.0 (19.7–23.4) | <0.001 |
| Aortic root diameter (mm/m2)b | 16.6 (15.9–18.1) | 20.4 (17.7–21.6) | <0.001 |
| Sinotubular junction diameter (mm) | 27.0 (25.0–30.0) | 34.5 (31.0–38.3) | <0.001 |
| Sinotubular junction diameter (mm/m)a | 15.3 (14.5–16.3) | 19.3 (16.8–20.9) | <0.001 |
| Sinotubular junction diameter (mm/m2)b | 14.4 (13.6–15.1) | 16.8 (15.5–18.9) | <0.001 |
| Ascending aorta diameter (mm) | 28.0 (27.0–30.0) | 43.5 (37.0–46.0) | <0.001 |
| Ascending aorta diameter (mm/m)a | 15.7 (14.9–16.7) | 23.6 (20.1–25.4) | <0.001 |
| Ascending aorta diameter (mm/m2)b | 14.8 (13.9–15.7) | 20.7 (18.7–23.4) | <0.001 |
Values are presented as numbers (percentages) or median (interquartile range). Aortic diameter measurements in healthy controls are cardiovascular magnetic resonance based, aortic diameter measurements in patients are computed tomography angiography based.
Diameters are corrected for height.
Diameters are corrected for body surface area.
Aortic biomechanical measurements
Figure 2 shows representative cases of aortic velocity profiles and WSS patterns in a BAV-LR patient and healthy control.
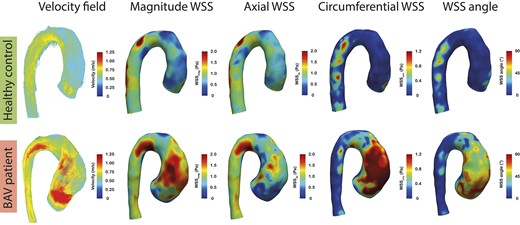
Representative example of peak systolic velocity fields, WSSmagnitude, WSSaxial, WSScircumferential, and WSS angle maps in a patient with BAV with left–right fusion and a healthy control. Streamlines in the BAV-LR patient show an eccentric flow jet in the ascending aorta, which is absent in the healthy control. Very high velocities in the circumferential direction can be observed in the BAV-LR patient, which is reflected by the strikingly higher WSScircumferential levels and large WSS angles compared with the healthy control in the region corresponding to the region impacted by the eccentric flow jet in the ascending aorta. Average WSScircumferential and WSS angle were 0.8 Pa and 55° for the BAV-LR patient and 0.3 Pa and 20° for the healthy control, respectively. BAV, bicuspid aortic valve; BAV-LR, bicuspid aortic valve with left-right fusion pattern; WSS, wall shear stress.
In the proximal ascending aorta, the average WSSmagnitude was not statistically significantly different between BAV patients and healthy controls (Figure 3A, Supplementary data online, Table S3). However, the average WSSaxial was significantly higher in healthy controls (P = 0.047), while the average WSScircumferential and WSS angle were significantly higher in BAV patients (P < 0.001). Maximum WSS values were significantly higher in BAV patients, except for WSSaxial. Similar findings were found in the entire ascending aorta, except for WSSaxial which was not statistically significantly different between BAV patients and healthy controls (Figure 3B, Supplementary data online, Table S3). Intra-observer agreement of WSS measurements was strong-to-excellent (Supplementary data online, Table S4).
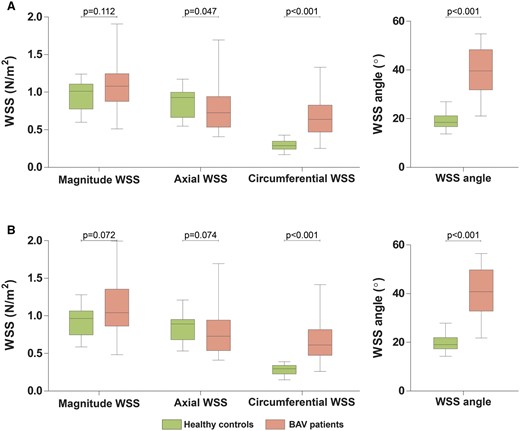
WSS comparing healthy controls with BAV patients. Boxplot graphs comparing average WSS measurements between healthy controls and BAV patients (A) in the proximal ascending aorta and (B) in the entire ascending aorta. BAV, bicuspid aortic valve; WSS, wall shear stress.
Aortic growth
Aortic diameters and volumes at baseline and three-year follow-up of the BAV patients are shown in Table 2. In the BAV patients, overall maximum aortic diameter growth was significant (36.5 vs. 38.0 mm, P < 0.001), regardless of the aortic location. At the individual aortic levels, diameters remained stable [aortic root (39.5 vs. 40.0 mm, P = 0.090), sinotubular junction (34.5 vs. 34.5 mm, P = 0.362), and ascending aortic (43.5–44.0 mm, P = 0.067)]. Aortic volume of the proximal and entire ascending aorta grew significantly over 3 years [proximal from 49.1 (IQR 43.3–61.4) to 52.5 cm3 (IQR 44.4–64.7), P = 0.003 and entire ascending aorta from 118.3 (IQR 82.0–157.6) to 122.7 cm3 (IQR 89.4–163.9), P = 0.020]. Intra-observer agreement of volume measurements was excellent (Supplementary data online, Figure S1).
Aortic diameters and volumes in BAV patients
| Baseline | Three-year follow-up | P-valuea | |
|---|---|---|---|
| Aortic root (mm) | 39.5 (36.8–42.5) | 40.0 (36.8–42.8) | 0.090 |
| Sinotubular junction (mm) | 34.5 (31.0–38.3) | 34.5 (31.0–38.3) | 0.362 |
| Ascending aorta (mm) | 43.5 (37.0–46.0) | 44.0 (37.0–46.3) | 0.067 |
| Aortic diameter at level with maximum growth (mm) | 36.5 (33.0–40.0) | 38.0 (33.0–41.0) | <0.001 |
| Proximal ascending aorta volume (cm3) (n = 32) | 49.1 (43.3–61.4) | 52.5 (44.4–64.7) | 0.003 |
| Entire ascending aorta volume (cm3) (n = 17) | 118.3 (82.0–157.6) | 122.7 (89.4–163.9) | 0.020 |
Values are presented as median with interquartile range; all measurements are based on computed tomography angiography measurements.
Wilcoxon one-sample test between baseline and follow-up.
WSS and aortic growth
As increased WSScircumferential and WSS angles are distinctive features of BAV patients, relationships of aortic volume growth with WSScircumferential and WSS angle are shown in Figure 4. In the proximal ascending aorta, WSS angle and volumetric growth were significantly related (r = 0.41, P = 0.020), while WSScircumferential was not significantly related with volume growth (r = 0.21, P = 0.242). In entire ascending aorta, there were trends towards more volume growth with increasing WSScircumferential and WSS angle values, however, these were not significant (WSScircumferentialr = 0.45, P = 0.069, WSS angle r = 0.45, P = 0.071, Supplementary data online, Table S5). WSS angle was the only variable independently associated with volume growth of the proximal ascending aorta (β = 0.121, P = 0.031), after adjustment for baseline aortic volume and diastolic blood pressure (Table 3). The WSS angle, WSSmagnitude, and male sex were risk factors of aortic volume growth of the entire ascending aorta (WSS angle β = 0.633, P = 0.011, WSSmagnitudeβ = 15.65, P = 0.011, and male sex β = 15.85, P = 0.003), adjusted for baseline volume and diastolic blood pressure (Supplementary data online, Table S5, multivariable analysis 1). WSScircumferential was also independently associated with volume growth in the entire ascending aorta (WSScircumferentialβ = 15.65, P = 0.011, and male sex β = 14.83, P = 0.008), adjusted for baseline volume and diastolic blood pressure (Supplementary data online, Table S5, multivariable analysis 2). No baseline variables were significantly associated with maximum aortic diameter growth (data not shown).
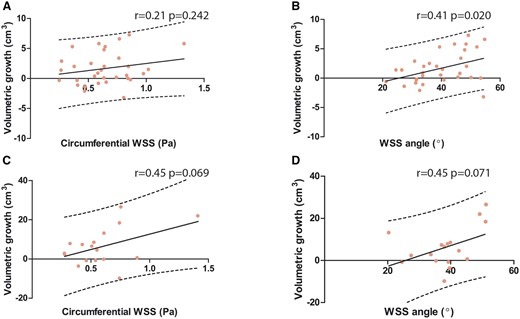
Correlations between aortic growth and the WSScircumferential and WSS angle. Scatterplot showing the relationship between (A) WSScircumferential vs. volume growth in the proximal ascending aorta; (B) WSS angle vs. volume growth in the proximal ascending aorta (C) WSScircumferential vs. volume growth in the entire ascending aorta; and (D) WSS angle vs. volume growth in the entire ascending aorta. BAV, bicuspid aortic valve; WSS, wall shear stress.
Univariable and multivariable linear regression for aortic volume growth of the proximal ascending aorta
| Univariable analysis | Multivariable analysis 1a | Multivariable analysis 2b | ||||
|---|---|---|---|---|---|---|
| β | P-value | β | P-value | β | P-value | |
| Age (years) | −0.041 | 0.342 | ||||
| Sex (male) | −0.282 | 0.794 | ||||
| Height (cm) | 0.023 | 0.643 | ||||
| Systolic blood pressure (mmHg) | −0.036 | 0.268 | ||||
| Diastolic blood pressure (mmHg) | −0.047 | 0.376 | −0.005 | 0.925 | −0.021 | 0.706 |
| Heart rate (bpm) | 0.000 | 0.994 | ||||
| Forward flow (mL/beat) | −0.004 | 0.828 | ||||
| Aortic regurgitation fraction (%) | 0.036 | 0.547 | ||||
| Peak aortic valve velocity (m/s) | 0.470 | 0.379 | ||||
| Peak aortic velocity (m/s) | 0.180 | 0.852 | ||||
| BAV-LR vs. other | 0.369 | 0.703 | ||||
| Aortic pulse wave velocity (m/s) | −0.823 | 0.034 | – | – | −0.785 | 0.058 |
| Aorta distensibility (mmHg−1) | 0.033 | 0.776 | ||||
| Magnitude WSS (N/m2) | −0.267 | 0.838 | ||||
| Maximum magnitude WSS (N/m2) | −0.234 | 0.672 | ||||
| Axial WSS (N/m2) | −1.672 | 0.283 | ||||
| Maximum axial WSS (N/m2) | −0.624 | 0.327 | ||||
| Circumferential WSS (N/m2) | 2.366 | 0.242 | – | – | ||
| Maximum circumferential WSS (N/m2) | 0.583 | 0.472 | ||||
| WSS angle (°) | 0.116 | 0.020 | 0.121 | 0.031 | ||
| Maximum WSS angle (°) | 0.092 | 0.078 | ||||
| Baseline aortic root diameter (mm) | −0.055 | 0.561 | ||||
| Baseline aortic sinotubular junction diameter (mm) | 0.015 | 0.858 | ||||
| Baseline ascending aortic diameter (mm) | 0.082 | 0.263 | ||||
| Baseline aortic volume (cm3) | 0.001 | 0.987 | −0.020 | 0.603 | 0.008 | 0.830 |
BAV-LR, bicuspid aortic valve with left-right fusion; WSS, wall shear stress.
Multivariable analysis 1 is model with magnitude WSS and WSS angle parameters.
Multivariable analysis 2 is model with axial and circumferential WSS parameters. Dashes indicate that variables were entered but removed because they did not demonstrate association. Volume measurements, the dependent variable, are based on computed tomography angiography measurements.
Discussion
We identified patients at risk for aortic growth using WSS based on 4D flow CMR in this young BAV cohort, after a comprehensive analysis of the differences in WSS patterns between BAV patients and healthy controls. This study demonstrates that the WSS angle is associated with aortic growth also after adjustment for baseline aortic volume and diastolic blood pressure. This WSS angle and the circumferential WSS, were higher in BAV patients compared with healthy controls, while the general magnitude of the WSS was not different. Nevertheless, the magnitude of WSS, next to the WSS angle, might potentially also be helpful to identify patients at risk for aortic growth.
In contrast to previous studies, absolute average WSSmagnitude levels were not higher in BAV patients and alone cannot distinguish between patients with a BAV and age-matched healthy controls.3,12–14 Given that WSS decreases when a vessel dilates, larger aortic dimensions in BAV patients might explain the observed similar levels of WSSmagnitude.3 As WSS levels are dependent on factors such as age and aortic size, we suggest it is not appropriate to compare WSS levels between patients with a different age or aortic size.15,16 The WSS angle, as a novel metric of the relative contribution of the WSScircumferential to the WSSmagnitude, was an intuitive marker and was better than WSSmagnitude in differentiating BAVs from tricuspid aortic valves. The WSS angle seems to accurately express the degree of helicity of blood shearing over the aortic wall.12
In our population, aortic diameter growth was minimal, while the increase of aortic volume was more prominent. In correspondence with previous findings, volumetry may be more sensitive to growth and is possibly less affected by measurement errors than diameters.10 Aortic diameter measurement is limited compared with a volume measurement as it is a one-dimensional measurement, measured at one level in the aorta and aortic length growth is not captured. Furthermore, the location of the aortic dilation varies between BAV patients depending on the valve subtype and this might additionally explain why a diameter measurement at a single level is not able to capture aortic growth accurately.17
Similar to previous studies, the average WSSmagnitude was not able to adequately predict which patients develop aortic dilation over time in the proximal ascending aorta.5,6 As the WSSmagnitude is similar in healthy controls and consequently, WSSmagnitude alone potentially lacks clinical significance as a risk factor for aortic growth in BAV patients.5 From vascular biology studies, it is known that in response to increased WSS levels, the endothelial cells will increase their nitric oxide production resulting in vessel dilation, which results in decreasing WSS levels and eventually leads to structural changes of the vessel wall.18 This theory has clinically been confirmed in tricuspid aortic valves.16 As aortic volumes modulate constantly, WSS levels might only be a snapshot in time. This makes them hard to interpret and also reinforces the debate whether normal WSS values exist based on data sets from healthy controls and if these should be directly compared with patients’ values.19 However, based on our sub-analysis in the entire ascending aorta, average WSSmagnitude might be an additional driver next to the WSS angle. WSScircumferential also appeared to be of predictive value in the entire ascending aorta model, but not in the proximal ascending aorta. The peak aortic valve velocity and peak aortic velocity are parameters less influenced by vessel wall remodelling, but were not associated with aortic growth. Peak velocities are local measures, while the average WSSs as reported in this study are the average WSSs to which the entire aortic wall is exposed to. Aortic growth was not locally measured in this study and this might explain why average measures, such as the average WSS angle, are favoured over local measures such as peak velocity and maximum WSS. This is along with the finding in another study that patients with larger aortic regions exposed to elevated WSS have higher rates of aortic dilation.6 Despite these findings, WSS can still be a local stimulus of the aortic wall growth through mechanotransduction, but this was beyond the scope of this research.
The direction of the WSS seems to play an important role in the process of aortic growth, as our study shows that the average WSS angle can successfully identify patients which are at risk of developing aortic dilation. The WSS angle is a readily available metric from the patient’s 4D flow CMR, obtained by resolving components of the WSSmagnitude vector, and does not need to be normalized for age and aortic size to have predictive value for aortic growth based on our results.19 Another recent study also showed that WSScircumferential is predictive for aortic growth without normalization of the WSS values for age and aortic size.20
As the WSScircumferential is a component of WSSmagnitude and the WSS angle represents its relative contribution, the level of WSScircumferential overlaps with these two individual parameters. The WSS angle appeared to be a stronger risk factor compared with WSScircumferential.
In conclusion, potentially, the degree of deviation from the axial direction of blood shearing over the vessel wall, the power with which this occurs and the extent of the aortic wall exposed to these unfavourable WSS parameters drive aortic enlargement in the ascending aorta in patients with a BAV. Future studies should confirm this finding.
Study limitations
Our patient group consisted of a relatively small group of BAV patients, which hampers further subgroup analysis in different BAV subtypes. Six patients had the history of an aortic coarctation. None of the coarctations were haemodynamically significant. Although WSS parameters in the ascending aorta were not different between patients with and without a history of a coarctation in our population, given the small number of patients with a coarctation, we cannot ascertain whether there is truly no difference. Also, because of the small sample size, potential parameters associated with aortic growth could have been missed due to a type II error. 4D flow CMRs were acquired on 1.5 T CMR scanners and with two sequences. Based on current literature, no differences in WSS measurements are expected between 1.5 T and 3.0 T scanners.21,22 Limited data are available concerning the influence of different sequences, therefore, potential bias because of the usage of two sequences cannot be excluded. Furthermore, CTA data on aortic diameters, volumes, and volumetric growth in our healthy controls were missing. This hampered an analysis on which risk factors for aortic growth are specific in the BAV population compared with the tricuspid aortic valve population. Finally, unfortunately volume growth of the entire aorta ascending in a part of our population was missing. Therefore and given the small sample size, the proximal aorta volume growth with a fixed 5 cm length was assessed in the entire patient population and this measurement might underestimate volume growth caused by aortic lengthening. Also, in patients with a RN fusion pattern, aneurysms are more likely to form in the distal ascending aorta.2 Since volume changes in the distal ascending aorta are not captured when studying the proximal 5 cm of the ascending aorta, analysis of aortic growth risk factors might be impeded specifically in patients with a RN fusion pattern. Our conclusions were based on a small number of high-risk BAV patients, larger studies are needed to confirm these results, also in low-risk BAV patients, and to translate these findings to clinical practice.
Conclusions
Increased WSScircumferential and especially WSS angle are typical in patients with BAV. WSS angle was independently associated with aortic growth in BAV patients. Possibly, the WSSmagnitude also plays a role in aortic growth. These findings highlight the potential role of WSS measurements in BAV patients to stratify patients at risk for aortic dilation.
Supplementary data
Supplementary data are available at European Heart Journal - Cardiovascular Imaging online.
Acknowledgements
The authors thank Gaston Vogel, Marc Maussen, and Jouke Ubbink from Pie Medical Imaging, Maastricht, the Netherlands, for providing the CAAS MR Solutions 5.1 and 3mensio software 10.1.
Funding
This study was supported by the Dutch Heart Foundation (contract grant number: 2013T093) and Thorax Foundation.
Data availability
Additional data are available from the corresponding author on reasonable request.
References
Author notes
Jolanda J. Wentzel, Alexander Hirsch contributed equally to this work.
Conflict of interest: The authors have no relationships relevant to the content of this paper to disclose. A.H. received a research grant from GE Healthcare and is a member of the medical advisory board of Medis Medical Imaging Systems. Siemens and Heartflow gave institutional support. No personal compensation was given.
