


Abstract
To investigate contraction patterns of the systemic right ventricle (SRV) in patients with transposition of great arteries (TGA) post-atrial switch operation and with congenitally corrected transposition of great arteries (ccTGA).
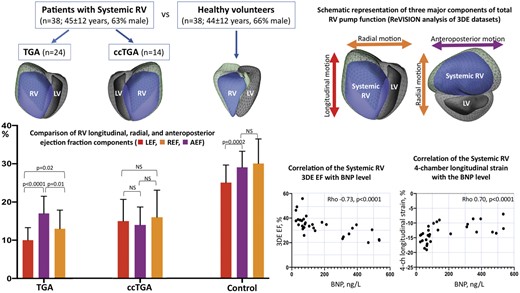
Right ventricular (RV) volumes and ejection fraction (EF) were measured by three-dimensional echocardiography in 38 patients with the SRV (24 TGA and 14 ccTGA; mean age 45 ± 12 years, 63% male), and in 38 healthy volunteers. The RV contraction was decomposed along the longitudinal, radial, and anteroposterior directions providing longitudinal, radial, and anteroposterior EF (LEF, REF, and AEF, respectively) and their contributions to total right ventricular ejection fraction (LEFi, REFi, and AEFi, respectvely). SRV was significantly larger with lower systolic function compared with healthy controls. SRV EF and four-chamber longitudinal strain strongly correlated with B-type natriuretic peptide (BNP) level (Rho −0.73, P < 0.0001 and 0.70, P < 0.0001, respectively). In patients with TGA, anteroposterior component was significantly higher than longitudinal and radial components (AEF 17 ± 4.5% vs. REF 13 ± 4.9% vs. LEF 10 ± 3.3%, P < 0.0001; AEFi 0.48 ± 0.09 vs. REFi 0.38 ± 0.1 vs. LEFi 0.29 ± 0.08, P < 0.0001). In patients with ccTGA, there was no significant difference between three SRV components. AEFi was significantly higher in TGA subgroup compared with ccTGA (0.48 ± 0.09 vs. 0.36 ± 0.08, P = 0.0002).
Contraction patterns of the SRV are different in TGA and ccTGA. Anteroposterior component is dominant in TGA providing compensation for impaired longitudinal and radial components, while in ccTGA all components contribute equally to the total EF. SRV EF and longitudinal strain demonstrate strong correlation with BNP level and should be a part of routine echocardiographic assessment of the SRV.
Introduction
In patients with congenitally corrected transposition of great arteries (ccTGA) or transposition of great arteries (TGA) after Mustard or Senning repair the morphologically right ventricular (RV) supports the systemic circulation and has to adapt to the chronically increased pressure load. The systemic right ventricle (SRV) failure is an important long-term concern, leading to severe late complications and premature death.1
Since SRV dysfunction is a key factor associated with limited exercise capacity,2–5 heart failure, and increased mortality,6,7 the accurate evaluation of the SRV performance is crucial.7 Various imaging modalities have been used to evaluate the SRV, including angiography, radionuclide imaging, and cardiovascular magnetic resonance (CMR). Nevertheless, in clinical practice, echocardiography is still used predominantly for the assessment of RV function, as it is non-invasive, widely available, relatively inexpensive, and its diagnostic performance is not affected by presence of intracardiac leads and devices.8 Accurate evaluation of the SRV is challenging due to its specific morphology and poorly understood contraction pattern. Echocardiographic parameters used for the assessment of subpulmonary right ventricle were extrapolated to the SRV, but their accuracy is suboptimal when compared with CMR.8–10 Novel echocardiography modalities, such as three-dimensional echocardiography (3DE), provide more granular understanding of the RV mechanics and may play a role in exploring the different components of the SRV systolic function in patients with TGA and ccTGA.11
The aim of the present study was to investigate the contraction patterns and functional adaptation of the SRV in patients with TGA post-atrial switch repair and with ccTGA.
Methods
Adult patients with TGA post-atrial switch repair (Mustard or Senning operation) or with ccTGA who underwent clinically indicated transthoracic echocardiography (TTE) at Royal Brompton Hospital (London, UK) were enrolled in an observational cross-sectional study. Inclusion criteria were: (i) age ≥18 years, (ii) SRV; and (iii) regular heart rhythm. Exclusion criteria were: (i) single ventricle physiology, (ii) Eisenmenger syndrome, and (iii) suboptimal image quality compromising 3DE full-volume data acquisition and/or analysis. Demographic, clinical, and laboratory data [age, body surface area, body mass index, previous medical history, New York Heart Association (NYHA) functional class, and B-type natriuretic peptide (BNP) plasma concentration] were retrieved from electronic patient records. Equal number of age- and gender-matched healthy volunteers were selected from the database of the Semmelweis University (Budapest, Hungary) and served as a control group.
Echocardiographic data acquisition and analysis
Patients underwent complete TTE, performed according to the recommendations from the International Society of Adult Congenital Heart Disease,12 including both conventional and 3DE data acquisition using the Vivid E95 system (GE Vingmed Ultrasound, Horten, Norway) equipped with M5S and 4V-D probes. Digitally stored data sets in raw-data format were analysed offline using commercially available software package (EchoPAC BT12, GE Vingmed Ultrasound).
The SRV systolic function was assessed quantitively by 3DE-derived ejection fraction (EF), 2DE fractional area change (FAC), tricuspid annular plane systolic excursion (TAPSE), tissue Doppler velocity of the basal free wall (S′), and qualitatively by visual assessment from multiple views. For 3DE volumetric analysis, six-beat full-volume data sets of the SRV (volume rate 28 ± 7 vol/s) were obtained during breath-holding from the apical four-chamber view (or right apical four-chamber view in dextrocardia). Pyramidal data sets were optimized for width and depth. During acquisition, the 12-slice display was used to ensure a complete inclusion of the SRV in the data set. Digitally stored data sets were analysed offline by an experienced investigator using commercially available software package [4D RV-Function 2.0 (TomTec Imaging Systems GmbH, Unterschleissheim, Germany)]. SRV volumes were indexed to body surface area. The matched control group underwent the same 3DE image acquisition and analysis protocol using the same equipment and software packages.
Quantification of 3D RV mechanics
To quantify the three major functional components contributing to total RV performance, we used the ReVISION software (Argus Cognitive, Inc, Lebanon, NH, USA). First, the 3D mesh model exported from the 4D RV-Function software package was re-oriented by a standard, automated method to identify the longitudinal (from tricuspid annulus to the apex), radial (perpendicular to the interventricular septum), and anteroposterior (parallel to the interventricular septum) axes (Figure 1). Then, motion decomposition was performed along these directions in a vertex-based manner in order to quantify component right ventricular ejection fraction (RVEF) values generated by each motion component [i.e. longitudinal EF (LEF), radial EF (REF), and anteroposterior EF (AEF)], as previously described.13Supplementary data online, Videos S1–S6 illustrate decomposition of SRV EF into three main components in a patient with TGA post-Mustard repair. Of note, the total RV stroke volume is generated by the aggregated contribution of the motion components, however, due to the non-linear RV deformation pattern, summing the decomposed EFs does not add up to the value of total RVEF (LEF + AEF + REF ≠ RVEF). Rescaling can be applied, i.e. LEF’ = LEF/(LEF + AEF + REF) × RVEF, and then LEF’ + AEF’ + REF’ = total RVEF will hold. In our current study, we used the native values instead of the rescaled ones to allow comparisons with our previous publications. The relative contribution of each direction to the total RVEF was defined as the ratio between LEF, REF, and AEF and total RVEF (LEFi = LEF/RVEF, REFi = REF/RVEF, and AEFi = AEF/RVEF). A recent comparison of these metrics using 3DE versus CMR-derived 3D models showed a strong agreement between the two modalities.14
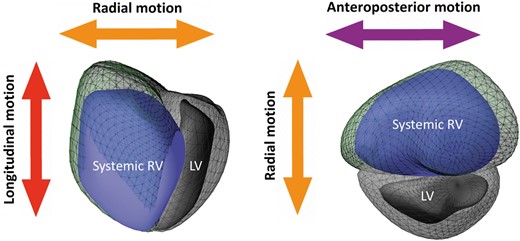
Three-dimensional schematic representation of the three major components contributing to total pump function of the systemic RV: (i) longitudinal shortening along the long-axis (red) contributing to RV longitudinal ejection fraction component, (ii) inward (radial) motion of the RV free wall (orange) contributing to radial ejection fraction component, and (iii) short-axis shortening in the anteroposterior direction in parallel with the septum (purple) contributing to antero-posterior ejection fraction component. Green mesh represents systemic RV end-diastolic volume, the blue surface—the systemic RV end-systolic volume. LV, left ventricle; RV, right ventricle.
Statistical analysis
Statistical analysis was performed with GraphPad Prism (version 7.0a). Continuous variables were expressed as mean ± standard deviation, whereas categorical variables were reported as frequencies and percentages. After verifying the normal distribution of each variable using the Kolmogorov–Smirnov test, the clinical and echocardiographic variables were compared with unpaired Student’s t-test or Mann–Whitney U test for continuous variables, and χ2 test for categorical variables, as appropriate. Spearman’s test was used to assess the correlation between indices of SRV size and systolic function and BNP concentration. Receiver-operator characteristic (ROC) curves were generated to assess the overall performance of different echocardiographic parameters of SRV function. Youden’s index was used to identify the most accurate cut-off values of those parameters associated with increased BNP concentration. A P-value of <0.05 was considered statistically significant.
Intra- and interobserver variability and reliability was assessed in a randomly chosen subset of patients with the SRV (n = 10, 6 TGAs and 4 ccTGAs) and healthy volunteers (n = 10). Two experienced operators (E.S. and A.K.) analysed these datasets in a blinded fashion. Intraclass correlation coefficient and coefficient of variability were calculated.
Results
Patient characteristics
From a total of 52 examined patients with the SRV, 3DE RV full-volume datasets of sufficient quality were acquired in 38 patients (73%). These patients were enrolled in the study cohort (mean age 45 ± 12 years, 63% male; 24 patients had TGA and underwent atrial switch repair, and 14 had ccTGA). SRV patients were compared with 38 healthy volunteers (mean age 44 ± 12 years, 66% male). Demographics, clinical characteristics, and associated lesions of the study group are summarized in Table 1. The majority of our patients were in NYHA class I or II (28, 74%); however, only 5 patients (13%) had preserved systolic function of the SRV on qualitative echocardiographic assessment. Median BNP level was 88 (64–315) ng/L (normal <20 ng/L). There was no significant difference in the presence of associated lesions, degree of systemic tricuspid regurgitation, or function of the SRV and left ventricle (LV) between patients with TGA post-atrial switch repair and ccTGA. Patients with ccTGA more frequently had implanted cardiac devices than those with TGA.
Demographic and clinical characteristics of the study group
| Parameter | All SRV patients (N = 38) | TGA post-atrial switch repair (N = 24) | ccTGA (N = 14) | P-value |
|---|---|---|---|---|
| Age, years | 45 ± 12 | 42 ± 7.8 | 48 ± 16 | 0.128 |
| Gender (male) | 24 (63%) | 15 (63%) | 9 (64%) | 0.951 |
| BSA, m2 | 1.9 ± 0.22 | 1.9 ± 0.18 | 1.9 ± 0.27 | 0.385 |
| BMI, kg/m2 | 25 ± 3.4 | 25 ± 2.9 | 26 ± 4.2 | 0.526 |
| SBP, mmHg | 116 ± 17 | 116 ± 16 | 117 ± 22 | 0.843 |
| DBP, mmHg | 62 ± 12 | 59 ± 8 | 70 ± 17 | 0.024 |
| HR, bpm | 65 ± 11 | 62 ± 12 | 67 ± 11 | 0.203 |
| VSD | 4 (11%) | 3 (13%) | 1 (7%) | 0.570 |
| (Sub-)Pulmonary stenosis | 5 (13%) | 4 (17%) | 1 (7%) | 0.388 |
| Presence of implanted cardiac device | 16 (42%) | 7 (29%) | 9 (64%) | 0.037 |
| TVR | 2 (5%) | 0 | 2 (14%) | 0.063 |
| Tricuspid regurgitation | ||||
| No or trivial | 5 (13%) | 3 (13%) | 2 (14%) | |
| Mild | 8 (21%) | 6 (25%) | 2 (14%) | |
| Moderate | 20 (53%) | 13 (54%) | 7 (50%) | 0.537a |
| Severe | 5 (13%) | 2 (8%) | 3 (21%) | 0.253b |
| Systemic RV systolic function (visually) | ||||
| Normal | 5 (13%) | 2 (8%) | 3 (21%) | 0.253 |
| Reduced | 33 (87%) | 22 (92%) | 11 (79%) | |
| LV systolic function (visually) | ||||
| Normal | 30 (79%) | 18 (75%) | 12 (86%) | 0.428 |
| Reduced | 8 (21%) | 6 (25%) | 2 (14%) | |
| NYHA class | ||||
| 1–2 | 28 (74%) | 17 (71%) | 11 (79%) | 0.593 |
| 3–4 | 10 (26%) | 7 (29%) | 3 (21%) | |
| BNP, ng/L | 88 (64–315) | 88 (70–330) | 86 (45–353) | 0.567 |
Data are presented as mean ± SD or n (%); BNP is presented as median (interquartile range).
P-value indicates difference between TGA and ccTGA subgroups.
BMI, body mass index; BSA, body surface area; DBP, diastolic blood pressure; HR, heart rate; SBP, systolic blood pressure; TVR, tricuspid valve replacement; VSD, ventricular septal defect.
For no/trivial/mild vs. moderate/severe tricuspid regurgitation.
For no/trivial/mild/moderate vs. severe tricuspid regurgitation.
Echocardiographic characteristics of the SRV morphology and function
Echocardiographic parameters of the RV size and function are presented in Table 2. In the study cohort, the right ventricle was significantly larger with poorer systolic function compared with healthy controls using both conventional echocardiographic parameters and 3DE: thus, 3DE-derived indexed end-diastolic volume was 120 ± 43 mL in patients with the SRV vs. 60 ± 12 mL in healthy controls, P < 0.0001; 3DE-derived EF was 36 ± 8% vs. 60 ± 4%, respectively, P < 0.0001. This difference was observed both for parameters reflecting the longitudinal RV shortening (such as TAPSE, S′ or longitudinal strain) and for indexes of global RV performance (such as FAC or EF). When TGA and ccTGA subgroups were compared, TAPSE was the only parameter of RV systolic function which differed significantly between the subgroups (11 ± 2.8 mm vs. 14 ± 5.2 mm, P = 0.037).
Echocardiographic parameters of RV size and systolic function on patients with a systemic RV and healthy volunteers
| Parameter | Control group (N = 38) | All SRV patients (N = 38) | TGA post-atrial switch repair (N = 24) | ccTGA (N = 14) |
|---|---|---|---|---|
| Basal diameter, cm | 3.2 ± 0.4 | 5.5 ± 1.1; P < 0.0001 | 5.6 ± 1.0 | 5.3 ± 1.2; P = 0.432 |
| Mid diameter, cm | 2.2 ± 0.3 | 5.1 ± 9.8; P < 0.0001 | 4.8 ± 7.0 | 5.6 ± 1.2; P = 0.017 |
| Length, cm | 7.9 ± 0.6 | 7.9 ± 1.2; P = 0.803 | 8.1 ± 1.1 | 7.6 ± 1.3; P = 0.149 |
| EDAi, cm2/m2 | 14 ± 3.1 | 20 ± 5.1; P < 0.0001 | 21 ± 4.0 | 19 ± 6.4; P = 0.062 |
| ESAi, cm2/m2 | 9 ± 1.9 | 15 ± 5.0; P < 0.0001 | 15 ± 4.9 | 14 ± 5.3; P = 0.498 |
| FAC, % | 41 ± 4 | 27 ± 9; P < 0.0001 | 26 ± 8.8 | 28 ± 9.6; P = 0.486 |
| TAPSE, mm | 25 ± 4.0 | 12 ± 4.2; P < 0.0001 | 11 ± 2.8 | 14 ± 5.4; P = 0.037 |
| S′, cm/s | 15 ± 2.5 | 6.7 ± 2.3; P < 0.0001 | 6.3 ± 2.1 | 7.5 ± 2.7; P = 0.176 |
| RV 4-chamber LS, % | −22 ± 2.6 | −14 ± 3.2; P < 0.0001 | −13 ± 2.9 | −15 ± 3.4; P = 0.114 |
| RV free wall LS, % | −26 ± 3.8 | −15 ± 3.2; P < 0.0001 | −15 ± 2.8 | −16 ± 3.6; P = 0.165 |
| 3D EDVi, mL/m2 | 60 ± 12 | 121 ± 43; P < 0.0001 | 124 ± 30 | 115 ± 61; P = 0.345 |
| 3D ESVi, mL/m2 | 30 ± 7.2 | 80 ± 38; P < 0.0001 | 83 ± 27 | 75 ± 53; P = 0.161 |
| 3D EF, % | 60 ± 4 | 36 ± 8; P < 0.0001 | 34 ± 7 | 38 ± 9; P = 0.179 |
| Components of RV EF | ||||
| LEF, % | 25 ± 4.6 | 12 ± 5.0; P < 0.0001 | 10 ± 3.3 | 15 ± 5.7; P < 0.0001 |
| REF, % | 30 ± 6.4 | 14 ± 5.9; P < 0.0001 | 13 ± 4.9 | 16 ± 7.1; P = 0.075 |
| AEF, % | 29 ± 4.2 | 16 ± 4.7; P < 0.0001 | 17 ± 4.5 | 14 ± 4.7; P = 0.171 |
| LEFi | 0.42 ± 0.08 | 0.33 ± 0.10; P = 0.0002 | 0.29 ± 0.08 | 0.41 ± 0.11; P = 0.0008 |
| REFi | 0.51 ± 0.09 | 0.39 ± 0.11; P < 0.0001 | 0.38 ± 0.10 | 0.41 ± 0.11; P = 0.370 |
| AEFi | 0.48 ± 0.06 | 0.44 ± 0.10; P = 0.026 | 0.48 ± 0.09 | 0.36 ± 0.08; P = 0.0002 |
Data are presented as mean ± SD.
P (in All SRV) value indicates difference compared with the control group.
P (in ccTGA) value indicates difference compared with the TGA group.
EDAi, indexed end-diastolic area; EDVi, indexed end-diastolic volume; ESAi, indexed end-systolic area; ESVi, indexed end-systolic volume; LS, longitudinal strain.
The following two parameters of the SRV systolic function demonstrated strong correlation with BNP plasma concentration: 3DE-derived EF (Spearman’s Rho −0.73, P < 0.0001) and four-chamber longitudinal strain (Rho 0.70, P < 0.0001) (Figure 2). RV free wall longitudinal strain showed moderate to strong correlation (Rho 0.63, P = 0.0002) and FAC showed moderate correlation (Rho −0.54, P = 0.002). TAPSE did not correlate with the BNP level and S′ demonstrated only weak correlation (Table 3).
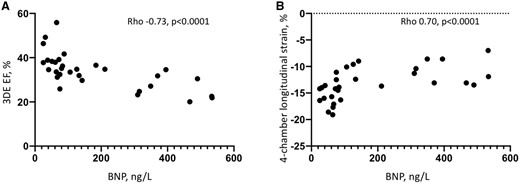
Correlation of 3DE-derived EF of the systemic RV (A) and four-chamber longitudinal strain (B) with the BNP plasma concentration. 3DE, three-dimensional echocardiography; BNP, B-type natriuretic peptide; RV, right ventricle.
Correlation of echocardiographic parameters of a systemic RV size and systolic function with BNP level
| Parameter | Spearman correlation coefficient, rho | P-value |
|---|---|---|
| 3D EF, % | −0.73 | <0.0001 |
| RV 4-chamber LS, % | 0.70 | <0.0001 |
| RV free wall LS, % | 0.63 | 0.0002 |
| 3D ESVi, mL/m2 | 0.60 | 0.0003 |
| FAC, % | −0.54 | 0.002 |
| 3D EDVi, mL/m2 | 0.52 | 0.003 |
| S′, cm/s | −0.37 | 0.038 |
| Basal diameter, cm | 0.33 | 0.070 |
| ESAi, cm2/m2 | 0.28 | NS |
| EDAi, cm2/m2 | 0.28 | NS |
| Mid diameter, cm | 0.12 | NS |
| TAPSE, mm | −0.09 | NS |
| AEF, % | −0.54 | 0.002 |
| LEF, % | −0.44 | 0.013 |
| REF, % | −0.36 | 0.044 |
| AEFi | −0.16 | NS |
| LEFi | 0.02 | NS |
| REFi | −0.06 | NS |
EDAi, indexed end-diastolic area; EDVi, indexed end-diastolic volume; ESAi, indexed end-systolic area; ESVi, indexed end-systolic volume; LS, longitudinal strain.
In ROC analysis, four parameters of SRV systolic function demonstrated the highest area under the curve (AUC) associated with raised BNP concentration (a median value of BNP in the study cohort 88 ng/L was used as a cut-off for raised BNP): RVEF AUC 0.87, P = 0.0005; RV four-chamber longitudinal strain AUC 0.94, P < 0.0001; RV free wall longitudinal strain AUC 0.86, P = 0.0009; and FAC AUC 0.87, P = 0.0003. TAPSE and S′ did not provide statistically significant discrimination. Systemic RVEF <35%, four-chamber longitudinal strain >−13.6%, free wall strain >−15%, and FAC <26.5% were the best cut-off values showing association with BNP concentration >88 ng/L, in our study population (Supplementary data online, Table S1).
When TGA and ccTGA subgroups were analysed separately, the 3DE RVEF similarly showed strong correlation with the BNP level (Rho −0.63, P = 0.002, and −0.79, P = 0.009, respectively) (Supplementary data online, Tables S2 and S3). Only RV four-chamber longitudinal strain in TGA subgroup showed higher correlation with the BNP concentration (Rho 0.71, P = 0.0005).
Relative contribution of different components of the RV systolic function to the global RVEF
All three components of the RV systolic function both in patients with TGA and ccTGA were significantly lower than in control group (P < 0.0001) (Table 2, Figure 3). While in healthy volunteers radial and anteroposterior RV components and their relative contribution to the total RV EF did not differ significantly and were slightly (but significantly) higher than longitudinal component, in patients with TGA the anteroposterior component was dominant and differed significantly from longitudinal and radial components (AEF 17 ± 4.5% vs. REF 13 ± 4.9% vs. LEF 10 ± 3.3%, P < 0.0001; AEFi 0.48 ± 0.09 vs. REFi 0.38 ± 0.1 vs. LEFi 0.29 ± 0.08, P < 0.0001). The longitudinal component provided the lowest contribution to the total RV EF. On the contrary, in patients with ccTGA there was no significant difference between three RV components and their relative contribution (Table 2, Figure 3). Both LEF and LEFi of SRV in patients with TGA were significantly lower than in those with ccTGA (LEF: 10 ± 3.3%, vs. 15 ± 5.7%, P < 0.0001; LEFi: 0.29 ± 0.08 vs. 0.41 ± 0.11, P = 0.0008, respectively). Relative contribution of anteroposterior RV component to the total RV EF was significantly higher in TGA subgroup compared with ccTGA (AEFi: 0.48 ± 0.09 vs. 0.36 ± 0.08, P = 0.0002).
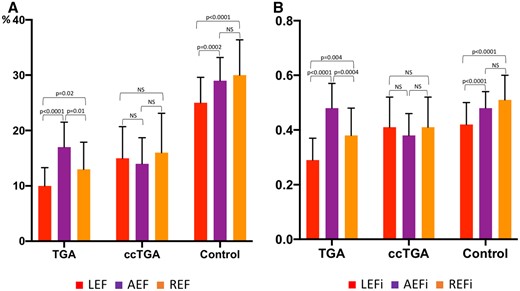
Comparison of the RV longitudinal, radial, and anteroposterior ejection fractions (LEF, REF, AEF, respectively; A) and their relative contributions (LEFi, REFi, AEFi; B) in patients with TGA, ccTGA and in healthy volunteers. Data are presented as mean and standard deviation. AEF, anteroposterior ejection fraction; AEFi, ratio between AEF and total RVEF; ccTGA, congenitally corrected transposition of great arteries; LEF, longitudinal ejection fraction; LEFi, ratio between LEF and total RVEF; NS, non-significant; REF, radial ejection fraction; REFi, ratio between REF and total RVEF; TGA, transposition of great arteries.
In both TGA and ccTGA groups, only AEF showed moderate or strong correlation with BNP plasma concentration (Rho −0.58, P = 0.006 and Rho −0.82, P = 0.005, respectively), while other components and their ratios did not (Supplementary data online, Tables S2 and S3).
Intra- and interobserver variability
Intraclass correlation coefficient and coefficient of variability values suggested good intra- and interobserver variability and reliability for 3DE-derived RV volumes and EF both in healthy volunteers and patients with the SRV (Supplementary data online, Table S4).
Discussion
To the best of our knowledge, this is the first study that used 3DE to investigate the contraction patterns of the SRV in patients with TGA post-atrial switch repair and with ccTGA. The main findings of the study can be summarized as follows:
contraction patterns of the RV change significantly during the adaptation process to support systemic circulation in patients with TGA post-atrial switch repair and in ccTGA;
in patients with TGA, anteroposterior component of the total RVEF is dominant and provides relative compensation for reduced longitudinal and radial components;
in patients with ccTGA, all three components contribute equally to the total RVEF;
3DE-derived EF and 2DE speckle-tracking longitudinal strain demonstrate strong correlation with BNP level in patients with SRV, higher than conventional echocardiographic parameters;
in both TGA and ccTGA subgroups, AEF showed significant correlation with BNP plasma concentration.
In the structurally normal heart where the RV supports pulmonary circulation, three main mechanisms contribute to the pump function: longitudinal shortening with the motion of the tricuspid annulus towards the apex; inward motion of the RV free wall; and contraction of the interventricular septum and its bulging into the right ventricle.15 The longitudinal component has long been considered as the dominant contributor to the RV pump function in normal population.15 Recent studies utilizing more advanced imaging techniques demonstrated that under normal conditions, contribution of radial and anteroposterior shortening of the right ventricle to the total RVEF appears at least similarly important.11 The postprocessing of 3DE-derived RV models using a vertex-based motion decomposition enabled the separate quantification and head-to-head comparison of the different mechanical components along three, anatomically relevant orthogonal axes.13 Using this methodology, both the inward (radial) motion of the free wall (the so-called ‘bellows effect’) and the anteroposterior component, which is not easily assessable by conventional methods, can be evaluated. Contraction of the subepicardial circumferential fibres contribute to the radial and also the anteroposterior shortening of the right ventricle, and because of the large surface of the RV free wall, a relatively limited inward movement in these directions can result in a significant stroke volume. Moreover, the anteroposterior shortening implies the contribution of the interventricular septum and the LV, as the circumferential shortening of the left ventricular mid-layer myofibres stretches the RV free-wall insertion lines towards each other. Accordingly, the left ventricular function was found to be a significant and independent predictor of RV anteroposterior shortening in healthy volunteers.11
In patients with a SRV, the RV contraction is affected by chronic pressure loading, as well as abnormal motion of the septum, which frequently bulges towards the subpulmonary LV due to higher RV pressure and distorts the normal semilunar shape of the right ventricle.16 Reduced myocardial work of the interventricular septum resulting in its dysfunction was shown to be frequent in TGA patients and contributing to the impaired performance of the SRV.17 Longitudinal contraction may also be impaired in the context of previous cardiac surgery in TGA cohort (Mustard or Senning operation).
Morphologically and embryologically, SRV in TGA and ccTGA are very different.18 Patients with ccTGA usually have anomalous anteriorly located atrioventricular node which gives origin to the penetrating bundle of His that reaches the ventricular septum and branches to the left bundle branch on the right side and right bundle branch on the left side. It is prone to conduction abnormalities which may cause abnormal septal activation and ventricular dyssynchrony.19 TGA patients post-atrial switch procedures have normal conduction system but are prone to bradycardia and atrial arrhythmias due to extensive intra-atrial scarring which may adversely affect the SRV function.1 As a result, mechanisms of SRV contraction are likely to be different not only from the normal right ventricle in subpulmonary position, but between TGA and ccTGA subgroups as well.
Several previous studies attempted to explore functional and morphological changes of the SRV, but only a few studies have directly compared functional and geometric features of two different types of SRV (TGA and ccTGA). It has been shown, which despite a common haemodynamic burden of systemic pressure, the right ventricle in patients with TGA after atrial switch has higher wall thickness, decreased global longitudinal strain, reduced TAPSE, and worse basal hypokinesis when compared with ccTGA.20–22 Prior studies have hypothesized that patient comorbidities may contribute to differences in SRV dysfunction; however, in our study, there is no significant difference in concomitant cardiac anomalies between patient subgroups.
In our cohort of patients with the SRV, a mean RVEF was 38%, which is similar to previously published series23,24; we found no significant differences in overall RV function between subgroups with TGA post-atrial switch repair and ccTGA apart from higher TAPSE in ccTGA. However, we noted apparent differences in ventricular mechanics between the subgroups. Previously, a shift to predominant circumferential over longitudinal free wall shortening of the SRV in TGA patients compared with the normal RV was described,24 and authors considered it an adaptive response of the right ventricle to support systemic pressures. In a more recent study, the same pattern in SRV contraction in TGA patients was observed,23 but authors found that in ccTGA patients both global longitudinal and global circumferential strain values of the SRV were low.
Our results suggest that the anteroposterior component of the total RV systolic function is dominant in TGA subgroup and provides important compensation to both the reduced longitudinal function in these patients (which can be potentially explained by previous open heart surgery and presence of stiff baffles adversely affecting the atrial function) and the reduced radial component (which can be secondary to the abnormal septal motion). All three components provide relatively equal contribution to the total RV EF in ccTGA patients. The inherent differences between these two subgroups, such as the underlying anatomy, previous surgery, difference in electrical activation, and different septal function may contribute to differences in ventricular mechanics between both types of SRV, and it is important to distinguish RV contraction patterns in these subgroups. Relatively active contribution of the anteroposterior RV component in patient with TGA post-atrial switch procedure should be taken into account and assessed (by eyeballing and/or 3DE) during the routine follow-up of these patients (Supplementary data online, Video S7).
These findings from 3DE study will raise the further awareness of limitation of conventional echocardiographic parameters in assessing the SRV function. In fact, in patients with TGA post-atrial switch repair, the RV systolic function may be underestimated if assessed by parameters that reflect the longitudinal shortening only (i.e. TAPSE, S′) or even both longitudinal and radial shortening (e.g. FAC),16 as none of them take into account anteroposterior contraction. These parameters are also load-dependent, which may further limit their accuracy in assessment of SRV due to high prevalence of systemic tricuspid regurgitation in adult patients.
Additionally, we found that reduced 3DE EF and RV longitudinal strain are significantly associated with elevated BNP concentration in patient with the SRV, while conventional echocardiographic parameters, which are widely used for the routine follow-up of these patients (such as TAPSE and S′) showed weaker or no association. Our results highlight the importance of advanced echocardiographic techniques (such as 3DE and speckle tracking longitudinal strain) in the thorough assessment of SRV systolic function.
Study limitations
Several limitations in the current study warrant consideration. Firstly, the sample size was relatively small, but we considered it appropriate for the purposes of our study given the low frequency of this condition in the population. Secondly, since the study protocol included the acquisition of 3DE data sets, only patients with sinus rhythm, relatively good acoustic window, and able to tolerate breath-holding for six cardiac cycles have been included. This may have caused a selection bias. The extent to which the results can be extrapolated to other patient groups (e.g. patients with atrial fibrillation) is not known. The study group (patients with the SRV) and control group had been enrolled and analysed in the different centres, however, we performed the variability analysis of the 3DE-derived RV volumes and EF, which demonstrated good reproducibility of these parameters in both groups. Finally, we did not assess 3DE volumetric analysis accuracy with a reference modality (CMR). However, this study was not designed to validate 3DE volumetric analysis. Good correlation of 3DE-derived RV volumes and EF with CMR data have been demonstrated previously in patients with different cardiac pathologies,25 including a small study in patients with the SRV.9
Conclusions
Contraction patterns of the SRV are different in patients with TGA post-atrial switch repair and in ccTGA and reflect the adaptive process to systemic circulation and previous surgical repair. The anteroposterior component is dominant in patients with TGA post-atrial switch providing compensation for impaired longitudinal and radial components, while in patients with ccTGA, all three components contribute equally to the total RV EF. AEF correlates significantly with BNP plasma concentration both in TGA and ccTGA subgroup. 3DE-derived EF and 2DE speckle-tracking longitudinal strain strongly correlation with BNP level in patients with SRV, better than conventional echocardiographic parameters. 3DE should be a part of routine echocardiographic assessment of the SRV, especially in patients with TGA since no conventional echo parameters of RV systolic function take into account anteroposterior contraction.
Supplementary data
Supplementary data are available at European Heart Journal - Cardiovascular Imaging online.
References
Author notes
Conflict of interest: A.K., B.K.L., M.T., and A.F. report personal consulting fees from Argus Cognitive, Inc. Other co-authors have nothing to disclose.
