


Introduction
State-of-the-art computed tomography (CT) imaging allows for robust assessment of coronary artery disease (CAD) including qualitative, semi-quantitative, or quantitative parameters and has emerged as an excellent gatekeeper for invasive angiography.1 CT has received Class I recommendations for the evaluation of patients presenting with chronic coronary syndromes in the latest European and US guidelines. Routine evaluation of the coronary arteries on CT focuses predominantly on stenosis severity and description of plaque calcification using qualitative categories. However, CT also allows quantitative assessment of CAD which may improve risk prediction of major adverse cardiovascular events by evaluating the amount and composition of coronary atherosclerosis.2,3
Semi-quantitative plaque assessment
Initial methods to estimate coronary plaque burden included calcium scoring on non-contrast CT using the Agatston and semi-quantitative CT angiography (CTA) scores. Calcium scoring has emerged as a valuable risk stratification tool that is also applied for defining statin eligibility in asymptomatic patient populations. Calcium score is as a surrogate marker of total plaque burden; however, it is important to underline certain limitations when applying it in clinical practice. Most notably, it only quantifies calcific plaques and therefore ignores non-calcified plaques that are more likely to rupture and cause acute coronary syndromes as well as other abnormalities (e.g. myocardial bridge). It should not be used as a rule-out test in symptomatic patients, and more generally its clinical value is limited in younger individuals with the risk of missing the ‘early phase’ of CAD and vulnerable plaque formation. Another key limitation is that it does not provide any detail on stenosis severity.1
The segment involvement score (SIS) on CTA summarizes the total number of segments with any obstructive or non-obstructive plaque. The segment stenosis score (SSS) provides a better estimate of plaque burden by incorporating weighting factors for stenosis severity. More complex approaches were developed to incorporate additional data on plaque location or composition (composite scores including CT-adapted Leaman score, Coronary CT Angiography EvaluatioN For clinical Outcomes: An InterRnational Multicenter Registry - CONFIRM score, or Duke CAD Index).1 The CT-adapted Leaman score, originally derived from invasive angiography, was established to incorporate coronary dominance, the location and extent of CAD, and also the potential vulnerability as assessed by CTA. The score utilizes weighting factors for stenosis based on the typical amount of blood flow to the left ventricle going through that given coronary segment. The CONFIRM score is a combination of the National Cholesterol Education Program - Adult Treatment Panel - III risk score, the number of proximal segments affected by a lesion with ≥50% stenosis and the number of proximal segments with partially calcified or calcified plaques. The CONFIRM score was shown to improve prediction of all-cause mortality significantly when compared with clinical risk score alone. The Duke CAD Index was also adopted for coronary CTA and describes a risk score between 0 and 100 based on former prognostic data. The score needs input on the severity, location, and extent of CAD.1
Despite the increasing complexity of these scoring systems, they all share the same fundamental limitations. Most notably, none actually quantify the burden of coronary plaque, and they do not consider the importance of composition nor positive remodelling. A growing body of evidence supports the clinical utility of more direct assessments of plaque burden and composition in risk prediction.2,4
Quantitative plaque assessment
Quantitative plaque assessments provide more detailed characterization of CAD compared with visual evaluation.4 Using dedicated software tools, the inner and outer vessel wall are determined, and plaques are characterized according to their CT attenuation. This allows quantification of plaque volumes, composition, and stenosis. Plaque volumes can be presented as a proportion of the overall vessel volume (percentage atheroma volume). Currently available softwares have been validated against virtual histology intravascular ultrasound, optical coherence tomography, or histology.2 An increasing number of clinical trials are incorporating these metrics to monitor the efficacy of lipid-lowering or anti-inflammatory therapies and to predict events. As image analysis software become easier to use and the strength of this expanding literature accumulates, quantification of the coronary atherosclerotic burden is likely to become increasingly used in clinical practice.
Although platforms have different analytical capabilities, the main steps of quantitative plaque assessment can be summarized as follows. Select a vessel from which the centreline is semi-automatically extracted. Then, the centreline should be edited, so that it always travels through the geometric centre of the lumen allowing the software to generate accurate curved and straight multiplanar images to enable accurate segmentation of the vessel wall. In the case of side branches, segments need to be excluded if they are already included in another segmentation to avoid duplicates. In addition, vessel with diameters of less than 1.5–2 mm is too small to analyse with current spatial resolution; therefore, distal segments and small side-branches are excluded. Then, the software automatically determines the inner and outer vessel boundaries. Current segmentation algorithms have trouble in defining the true adventitial border and differentiating non-calcified plaque from perivascular tissue; therefore, manual correction of these contours, where necessary, should always be performed. This is the most time-consuming step and requires extensive clinical experience. For calcified plaques, overestimation of the border of the plaque due to blooming artifacts should be avoided by using proper windowing. Figure 1 demonstrates the main steps of qualitative and semi-quantitative plaque analysis and the details of quantitative plaque assessment.
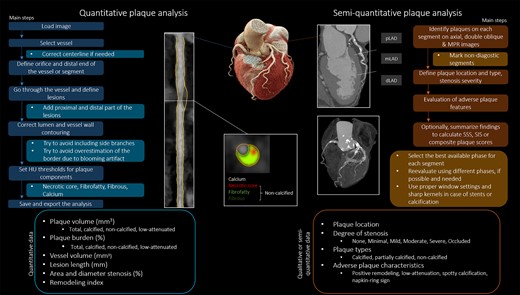
The figure summarizes the main steps of quantitative and semi-quantitative plaque assessment based on CTA. On the left panel, the flow chart depicts the workflow of plaque quantification by a dedicated software tool. The CTA images demonstrate a high-risk plaque of the right coronary artery. Images were acquired on a dual-source photon counting scanner (Naeotom Alpha, Siemens Healthineers). Current clinical practice is based on qualitative and semi-quantitative plaque features with the aim to describe the presence, extent, location, severity, and vulnerability of CAD in a simple, yet comprehensive report (right side).
After the segmentation is finished, different plaque types may be determined using fixed Hounsfield unit (HU) thresholds or adaptive settings where local HU values and/or geometrical components of the lesions determine plaque content. Unfortunately, there are no unified definitions for these thresholds as lumen density, and therefore contrast media protocols may influence measurements. Nevertheless, components are usually split into calcified and non-calcified plaque volumes. Recently, major attention has been focused upon low-attenuation (<30 HU) non-calcified plaque, which serves as a marker of necrotic core,2 and therefore provides quantification of the adverse plaque burden that provides the most powerful prediction of future myocardial infarction, outperforming cardiovascular risk factors, calcium scoring, stenosis severity, or the CT-adapted Leaman score.1–3
Commonly used fixed thresholds for quantification are shown below:
| Fixed HU thresholds for plaque quantification | |
| Calcified plaque volume | >351 HU |
| Non-calcified plaque volume | |
| Low-attenuation plaque/necrotic core | <30 HU |
| Fibro-fatty plaque | 30–130 HU |
| Fibrous plaque | 131–350 HU |
| Fixed HU thresholds for plaque quantification | |
| Calcified plaque volume | >351 HU |
| Non-calcified plaque volume | |
| Low-attenuation plaque/necrotic core | <30 HU |
| Fibro-fatty plaque | 30–130 HU |
| Fibrous plaque | 131–350 HU |
| Fixed HU thresholds for plaque quantification | |
| Calcified plaque volume | >351 HU |
| Non-calcified plaque volume | |
| Low-attenuation plaque/necrotic core | <30 HU |
| Fibro-fatty plaque | 30–130 HU |
| Fibrous plaque | 131–350 HU |
| Fixed HU thresholds for plaque quantification | |
| Calcified plaque volume | >351 HU |
| Non-calcified plaque volume | |
| Low-attenuation plaque/necrotic core | <30 HU |
| Fibro-fatty plaque | 30–130 HU |
| Fibrous plaque | 131–350 HU |
The remodelling index can be calculated as the ratio of the vessel wall area at the site of the maximal plaque diameter and the reference vessel wall area. This allows identification of positively remodelled plaques, based upon a remodelling index of >1.1. Different softwares use different reference points (proximal, distal, or both) that can be manually adjusted. Additionally, stenosis quantification can be derived semi-automatically. Quantitative percent stenosis is calculated by dividing the minimal luminal area or diameter by the reference point. Area stenosis provides a strong correlation with invasive quantitative coronary CTA.5
Notably, excellent image quality is a prerequisite for accurate quantification of CAD. Other limitations include a lack of standardization with respect to acquisition protocols, reconstructions, and iodine contrast concentrations, which may all affect plaque volumes. Furthermore, tube current and voltage can significantly influence measurements based on HU. Concerns have also been raised regarding the inter-vendor, scan-rescan, inter-software, and inter-reader variability of quantitative analysis. When assessing temporal changes in plaque volumes, the same reader should evaluate the baseline and follow-up scans using the same software. The scans should have been performed on the same scanner using the same imaging protocols, including strict heart rate control of <60 bpm. Since all of the above listed conditions alter the measurements, it is essential to record all details of the methodology to ensure reproducibility of findings. Reproducibility is of utmost importance when analyzing serial CTA datasets to better understand the dynamic nature of CAD and the effects of anti-atherosclerotic therapies. Different strategies may be used to avoid overestimation of non-calcified plaque volume due to inclusion of vessel wall without any visible disease. Only quantifying coronary segments with visual evidence of plaque is one such common approach. Here, rather than performing whole vessel analysis, individual plaques are segmented by defining the proximal and distal border of the lesion.
Although coronary plaque quantification is not yet applied in the clinical reports, a new era of automated plaque quantification, advanced plaque phenotyping, and the development of reporting platforms will enable improved risk stratification and patient management in the near future.
Future perspectives
Novel software tools using artificial intelligence to aid plaque detection and quantification will shorten analysis time and could pave the way for an era of fully automated segmentation with almost no reader input.4 Coronary CTA also allows interrogation of the adjacent perivascular fat tissue, a proposed surrogate of inflammation. Software tools are equipped with 3D visualization capabilities and are able to export plaque data for further voxel-based analysis and radiomic profiling. CT images are large three-dimensional data sets in which each voxel of the underlying volume represents distinct physical measurements of a tissue-dependent characteristics. Radiomics-based image characteristics might identify new plaque phenotypes that are not visible with routine evaluation and also have the potential to increase the diagnostic and prognostic accuracy of CTA. The Incident Coronary Syndromes Identified by Computed Tomography (ICONIC), the Progression of Atherosclerotic Plaque Determined by Computed Tomographic Angiography Imaging (PARADIGM), and the Computed TomogRaphic evaluation of atherosclerotic DEtermiNants of myocardial IsChEmia (CREDENCE) trials have utilized standardized assessment of coronary plaque quantification using core laboratory analysis with an aim to demonstrate the clinical value of plaque assessment in monitoring secondary prevention therapy, improving the diagnostic accuracy of CTA, or reshape risk prediction for acute events. Further software development has the potential to combine the results from automated plaque detection and contouring, radiomic analysis, and perivascular fat attenuation in the form of a single CT report.
Conclusion
Quantitative plaque analysis from coronary CTA is now widely used in research studies. It provides a more robust assessment of the coronary atherosclerotic plaque burden than previously used semi-quantitative metrics. These assessments hold major promise in advancing risk stratification, but further outcome studies are required as well as methods to standardize image acquisition protocols and to reduce the time needed to perform analysis.
Data availability
No new data were generated or analysed in support of this research.
References
Author notes
Conflict of interest: B.S.: no conflict of interest. M.K.: Shareholder of Neumann Medical Ltd. G.P.: honorarium as speaker and/or research funding from GE Healthcare, Bracco, Heartflow, Boheringher. M.C.W. is supported by the British Heart Foundation (FS/ICRF/20/26002). M.C.W. has received speaker fees from Canon Medical Systems and Siemens Healthineers. M.R.D. is supported by the British Heart Foundation (FS/SCRF/21/32010) and is the recipient of the Sir Jules Thorn Award for Biomedical Research 2015 (15/JTA). M.R.D. has received speaker fees from Pfizer and Novartis. He has received consultancy fees from Novartis, Jupiter Bioventures, Beren, and Silence therapeutics. P.M.H.: shareholder of Neumann Medical Ltd.
