


Abstract
The aim of this study is to explore the relationships of tricuspid annulus area (TAA) with right atrial maximal volume (RAVmax) and right ventricular end-diastolic volume (RVEDV) in healthy subjects and patients with functional tricuspid regurgitation (FTR) of different aetiologies and severities.
We enrolled 280 patients (median age 66 years, 59% women) with FTR due to left heart disease (LHD), pulmonary hypertension (PH), corrected tetralogy of Fallot (TOF), chronic atrial fibrillation (AF), and 210 healthy volunteers (45 years, 53% women). We measured TAA at mid-systole and end-diastole, tenting volume of tricuspid leaflets, RAVmax, and RVEDV by 3D echocardiography. Irrespective of TA measurement timing, TAA correlated more closely with RAVmax than with RVEDV in both controls and FTR patients. On multivariable analysis, RAVmax was the most important determinant of TAA, accounting for 41% (normals) and 56% (FTR) of TAA variance. In FTR patients, age, RVEDV, and left ventricular ejection fraction were also independently correlated with TAA. RAVmax (AUC = 0.81) and TAA (AUC = 0.78) had a greater ability than RVEDV (AUC = 0.72) to predict severe FTR (P < 0.05). Among FTR patients, those with AF had the largest RAVmax and smallest RVEDV. RAVmax and TA were significantly dilated in all FTR groups, except in TOF. PH and TOF had largest RVEDV, yet tenting volume was increased only in PH and LHD.
RA volume is a major determinant of TAA, and RA enlargement is an important mechanism of TA dilation in FTR irrespective of cardiac rhythm and RV loading conditions.

Introduction
Functional tricuspid regurgitation (FTR) is the most common cause of tricuspid valve (TV) dysfunction in the western world and has a very high mortality.1 Dilation of the tricuspid annulus (TA) is the most important factor in the development of FTR. Accordingly, the TA has become the prime therapeutic target for surgical and interventional procedures for treating FTR.
In the general pathophysiologic sequence of FTR development, TA dilation has been traditionally described as secondary to right ventricular (RV) dilation and dysfunction due to pressure and/or volume overload,2 which, in turn, distort the normal geometry and spatial relationships of leaflets, papillary muscles, and chordae leading to FTR, which further exacerbates RV and TA remodelling constituting a vicious circle.3
However, some patients with mild or moderate FTR may present with significantly dilated TA and RA despite having normal RV size.4 Atrial fibrillation (AF) has been recently recognized as a cause of TA dilation and FTR by promoting RA remodelling, even in the absence of RV dilation or dysfunction.3,5–7 The relative impact of RA and RV remodelling on TA dilation in FTR, irrespective of cardiac rhythm, still remains to be clarified. Previous studies had limited sample sizes and predominantly enrolled patients with significant FTR secondary to advanced stages of left heart disease (LHD).8,9 LHD and pulmonary hypertension (PH) patients commonly present significant FTR with simultaneous dilation of both the RA and RV and permanent AF, making it more challenging to assess which is the primary cause for the TA dilation.3 Moreover, the TA and RV size in previous studies were measured using linear dimensions by 2D echocardiography (2DE), which is known to underestimate their true size.10 In contrast, three-dimensional echocardiography (3DE) enables a more accurate quantification of the TA and right chamber remodelling, avoiding geometric assumptions and plane position errors.
We hypothesized that RA volume might be an important player in determining TA size irrespective of the cardiac rhythm, the aetiology, and the severity of FTR. Accordingly, we sought: (i) to explore the relationships between TA area (TAA) and RA and RV volumes in a large population including healthy subjects and patients with FTR of different aetiologies and severities and (ii) to compare patients with FTR of different aetiologies in terms of TV geometry and relative extent of RA and RV remodelling.
Methods
Study population
A total of 490 subjects including 210 healthy volunteers and 280 patients with FTR were prospectively enrolled from two academic centres between 2011 and 2018 (University of Padua n = 328; University of Chicago, n = 162). Healthy subjects were enrolled according to strict criteria described elsewhere.10 Patients with at least mild FTR were divided into four aetiologies: (i) ‘LHD’ including left-sided valvular prostheses, surgical repair, any degree of mitral stenosis, at least moderate degree of aortic stenosis and/or aortic or mitral regurgitation, or reduced left ventricular ejection fraction (LVEF <50%); (ii) ‘RV pressure overload’ due to PH occurring without LHD, defined as peak FTR velocity >3.4 m/s by Doppler echocardiography or mean pulmonary artery pressure ≥25 mmHg and pulmonary artery wedge pressure ≤15 mmHg at right heart catheterization (‘PH’); (iii) ‘RV volume overload’ due to moderate–severe pulmonary regurgitation in patients with corrected tetralogy of Fallot (‘TOF’); (iv) ‘permanent non-valvular AF’ with low probability of PH (peak FTR velocity ≤ 2.8 m/s) and without LHD defined as above (‘AF’). Exclusion criteria were: mixed aetiologies (i.e. PH, AF, etc.), poor image quality, organic tricuspid regurgitation, pacemaker or implantable cardioverter-defibrillator, dyspnoea or highly irregular cardiac rhythm (precluding the acquisition of multi-beat 3DE datasets with no stitching artefacts), pulmonary valve, or artery stenoses. Informed consent was collected from all subjects and the study was approved by the Institutional Review Boards of both institutions.
Echocardiographic acquisition
Study subjects underwent standard 2DE using Vivid E9/E95 (GE Vingmed, Horten, Norway) equipped with M5S probe and iE33 (Philips, Andover, MA, USA) equipped with S5 transducer. In addition, two multi-beat 3D datasets of the RA and RV were acquired from the apical approach using the 4V/4Vc (GE) or X5 transducers (Philips). Images were digitally stored and analysed offline using EchoPAC 202 (GE) or Xcelera (Philips) by a single experienced researcher from each institution (D.M. and K.A.) blinded to the medical history of the patients.
2D echocardiographic analysis
LV volumes and LVEF were calculated using the biplane disk summation algorithm. Conventional parameters of TA, RA, and RV size and function were measured from the focused RV apical view.11 Pulmonary artery systolic pressure (PASP) was derived from the maximal TR jet velocity and RA pressure estimated from the inferior vena cava.11 TR severity was graded as mild, moderate, or severe using the recommended multiparametric approach.12
3D echocardiographic analysis
RA maximal volume (RAVmax) was measured with a validated software, as described.13 RV end-diastolic volume (RVEDV) and RV end-systolic volume (ESV), and RV ejection fraction (RVEF) were measured using 4D RV-Function 2.0™ (TomTec).14 TV geometry was measured from multi-beat RV datasets [median temporal resolution 30 vps (21–33) for subjects in sinus rhythm and 21 vps (17–26) for AF patients, P < 0.05] using a validated vendor-independent software.10 The TA diameters, area, perimeter, and circularity (ratio of short- to long-axis dimensions) were obtained at mid-systolic (MS, halfway between TV closure and end-systolic frames) and end-diastolic (ED, just before TV closure) frames. Tenting volume was measured in MS frame as the volume delimitated by TV leaflets surface and the TAA (Supplementary data online, Figures S1 and S2).
Statistical analysis
Normal distribution of variables was assessed by Shapiro–Wilk test. Continuous variables were summarized as median (I and III quartiles), and categorical variables as percentages. Non-parametric Wilcoxon rank-sum tests were used for group comparisons, and Spearman ρ correlations were used for univariate analysis. Gender differences were assessed using Mann–Whitney test. For categorical variables, χ2 test was used. Stepwise linear regression was used for multivariable analysis, testing the hypothesis that RAVmax would be independently related to TAA after adjusting for covariates. Preliminary analyses were performed to exclude any violation of the assumptions of normality and multicollinearity. The following univariable correlates were included in two models: sex, body surface area (BSA), RVEDV, and RAVmax (healthy subjects); age, sex, BSA, RAVmax, RVEDV, LVEF, and PASP (FTR patients). ROC curve analysis was used to compare the ability of right chamber volumes and TV geometry to predict severe FTR. For intergroup comparison purposes, the TA and right chamber measurements for all four FTR groups were indexed to BSA and expressed as Z-scores generated by comparison to 4 different control groups matched for age and gender (Z-score ≥2: significantly abnormal). Observer variability for all 3DE software packages used was reported elsewhere.10,13,14 All analyses were performed using SPSS Statistics version 21.0. A P-value <0.05 was considered significant.
Results
Healthy subjects
Median age was 45 (32–60) years and 53% were women. Ninety percent had either trivial or mild FTR. Men had larger body size, higher blood pressure, larger right chamber volumes, TA dimensions and leaflet tenting, and lower RVEF than women (Table 1 and Supplementary data online, Table S1). Indexing chamber and TA measurements to BSA did not eliminate gender differences.
Tricuspid measurements in healthy subjects and FTR patients
| Healthy subjects (n = 210) | FTR patients (n = 280) | |||||
|---|---|---|---|---|---|---|
| Men (n = 97) | Women (n = 113) | P-value | Men (n = 109) | Women (n = 171) | P-value | |
| Non-indexed | ||||||
| TA area at MS (cm2) | 8.6 (7.5–9.7) | 6.8 (6.1–7.4) | 0.0001 | 10.6 (8.6–13.4) | 10.2 (7.7–11.8) | 0.03 |
| TA area at ED (cm2) | 9.7 (8.6–10.8) | 7.8 (6.9–8.8) | 0.0001 | 13 (11–17) | 12 (10–15) | 0.009 |
| TA perimeter at MS (cm) | 10.5 (9.9–11.2) | 9.4 (8.9–9.9) | 0.0001 | 11.7 (10.5–13.2) | 11.4 (9.9–12.3) | 0.02 |
| TA perimeter at ED (cm) | 11.2 (10.4–11.8) | 10.1 (9.5–10.6) | 0.0001 | 12.9 (11.7–14.5) | 12.4 (11.3–13.7) | 0.007 |
| TA circularity at MS | 0.87 (0.83–0.93) | 0.85 (0.79–0.91) | 0.07 | 0.90 (0.83–0.93) | 0.90 (0.84–0.94) | 0.33 |
| TA circularity at ED | 0.86 (0.79–0.91) | 0.82 (0.74–0.90) | 0.07 | 0.88 (0.83–0.92) | 0.88 (0.84–0.93) | 0.66 |
| Tenting volume (mL) | 3.2 (2.5–3.9) | 2.6 (2.0–2.9) | 0.0001 | 4.0 (2.5–5.9) | 3.9 (2.6–5.9) | 0.90 |
| Total leaflet area (cm2) | 10.1 (8.9–11.1) | 8.3 (7.4–9.4) | 0.0001 | 12.3 (9.8–15.8) | 12.1 (9.2–14.9) | 0.21 |
| Indexed (to BSA) | ||||||
| TA area at MS (cm2/m2) | 4.6 (4.0–4.9) | 4.1 (3.8–4.4) | 0.0001 | 5.6 (4.7–7.1) | 6.0 (4.6–7.1) | 0.63 |
| TA area at ED (cm2/m2) | 5.1 (4.6–5.6) | 4.7 (4.3–5.2) | 0.004 | 7.1 (6.0–8.5) | 7.3 (5.9–8.9) | 0.60 |
| TA perimeter at MS (cm/m2) | 5.6 (5.2–5.9) | 5.7 (5.4–6.0) | 0.037 | 6.3 (5.8–6.9) | 6.8 (6.0–7.5) | 0.24 |
| TA perimeter at ED (cm/m2) | 5.9 (5.5–6.2) | 6.1 (5.7–6.4) | 0.005 | 6.9 (6.4–7.7) | 7.5 (6.7–8.4) | 0.70 |
| Total leaflet area (cm2/m2) | 5.4 (4.9–5.9) | 5.1 (4.6–5.6) | 0.09 | 6.5 (5.5–8.1) | 7.1 (5.5–9.2) | 0.22 |
Values are median (I–III quartiles).
BSA, body surface area; ED, end-diastole; MS, mid-systole; TA, tricuspid annulus.
Clinical and echocardiographic characteristics of healthy subjects and functional tricuspid regurgitation patients
| Healthy controls (N = 210) | Functional tricuspid regurgitation (N = 280) | P-Value | |
|---|---|---|---|
| Age (years) | 45 (32–60) | 66 (44–77) | <0.001 |
| Women, n (%) | 113 (54) | 171 (61) | 0.103 |
| TA area at MS (cm2/m2) | 4.3 (3.8–4.7) | 5.8 (4.6–7.1) | <0.001 |
| TA area at ED (cm2/m2) | 4.9 (4.4–5.4) | 7.3 (5.9–8.7) | <0.001 |
| TV tenting volume (mL) | 2.7 (2.2–3.5) | 3.9 (2.5–5.9) | <0.001 |
| RVEDV (mL/m2) | 64 (55–76) | 100 (76–143) | <0.001 |
| RVESV (mL/m2) | 27 (23–34) | 56 (38–86) | <0.001 |
| RVEF (%) | 58 (53–61) | 44 (37–51) | <0.001 |
| FAC (%) | 45 (41–50) | 35 (27–42) | <0.001 |
| TAPSE (mm) | 25 (22–28) | 18 (15–21) | <0.001 |
| S (cm/s) | 13 (13–15) | 10 (9–12) | <0.001 |
| PASP (mmHg) | 22 (20–25) | 47 (34–68) | <0.001 |
| RAVmax (mL/m2) | 28 (22–34) | 48 (35–68) | <0.001 |
| LVEF (%) | 63 (60–65) | 57 (52–64) | <0.001 |
Values are median (I–III quartiles).
2D, two-dimensional; ED, end-diastole; FAC, fractional area change; FTR, functional tricuspid regurgitation; LVEF, left ventricular ejection fraction; MS, mid-systole; PASP; pulmonary systolic pressure; RAVmax, indexed right atrial volume; RVEDV, right ventricular end-diastolic volume; RVEF, right ventricular ejection fraction; RVESV, right ventricular end-systolic volume; TA, tricuspid annulus; TAPSE, tricuspid annulus plane systolic excursion; TV, tricuspid valve.
In the univariate analyses, TAA at MS was correlated with gender (ρ = 0.52, P < 0.0001) and BSA (ρ = 0.59, P < 0.0001), but not with age (P = 0.80). TAA was more closely correlated with RAVmax than with RVEDV (Figure 1). With multivariable analyses, the TAA at MS was independently correlated with gender, BSA and RAVmax (F = 70.8, P < 0.0001 with an R2 = 0.51). RAVmax was the strongest predictor of TA size, accounting for 41% of TAA variance, while BSA and gender accounted for additional 27% and 17%, respectively. TAA increased 0.41 cm2 for each 10 mL increment in RAVmax.
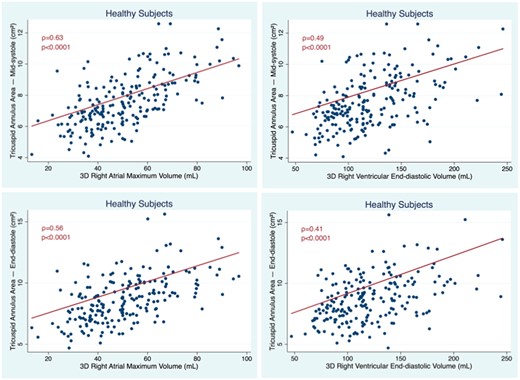
Correlation between TA areas measured at mid-systole (top) and end-diastole (bottom) with RA (left) and RV volumes (right) in healthy subjects. RV, right ventricular; TA, tricuspid annulus.
FTR patients
The cohort of 280 patients with FTR (median age of 66 years) consisted of four aetiological groups: LHD (25%), PH (36%), TOF (15%), and AF (24%). Overall, there were 35%, 35%, and 30% patients with mild, moderate, and severe FTR, respectively. Comparisons between FTR pts and controls are reported in Table 1 and Supplementary data online, Table S2.
TAA at MS correlated with age (ρ = 0.23, P < 0.0001), gender (ρ = 0.13, P = 0.033), and BSA (ρ = 0.36, P < 0.0001). Men had larger TAAs than women, however this difference disappeared after indexing TAA for BSA (Supplementary data online, Table S1). TAA at MS closely correlated with RAVmax and weakly correlated with RV volumes. TAA at ED better correlated with RV volumes than TAA at MS, however the correlation coefficients for RAVmax remained higher than those for RVEDV (Figure 2). There were also weak but significant correlations between TAA at MS with LVEF (ρ = −0.25, P < 0.0001) and conventional parameters of RV function: RVEF (ρ = −0.17, P = 0.005), FAC (ρ = −0.19, P = 0.001), and TAPSE (ρ = −0.13, P = 0.034). TA at MS and ED correlated with PASP (ρ = 0.16 and 0.22, respectively, P < 0.0001).
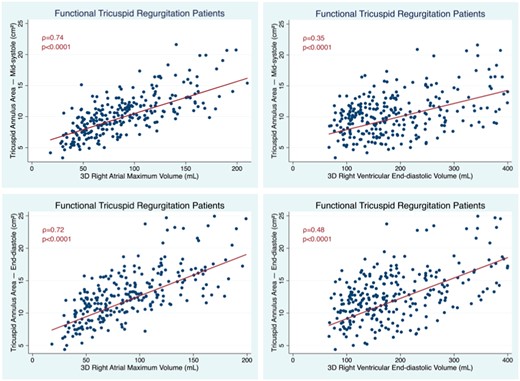
Correlation between TA areas measured at mid-systole (top) and end-diastole (bottom) with RA (left) and RV volumes (right) in patients with FTR. FTR, functional tricuspid regurgitation; RV, right ventricular.
At stepwise multivariable linear regression analysis, TAA at MS was independently correlated with BSA, RAVmax, and RVEDV (F = 90.6, P < 0.0001 with an R2 = 0.55). Among these variables, again RAVmax was the strongest predictor of TA size, accounting for 56% of TAA variance, while RVEDV and BSA accounted for only 23% and 15% of TAA variance, respectively. Mean TAA at MS increased by 0.4 cm2 for each 10 mL increment in RAVmax and by 0.1 cm2 for each 10 mL increment in RVEDV.
TAA at ED was independently correlated with age, RAVmax, RVEDV, and LVEF (F = 98.5, P < 0.0001 with an R2 = 0.64). Among these variables, again RAVmax was the most important predictor of TA size, accounting for 48% of TAA variance, while RVEDV, LVEF, and age accounted for 39%, 15%, and 13% of TAA variance, respectively. TAA at ED increased by 0.4 cm2 for each 10 mL increment in RAVmax, by 0.18 cm2 for each 10 mL increment in RVEDV, by 0.47 cm2 for each 10% decrease in LVEF, and by 0.23 cm2 for each age decade.
Using ROC curve analysis, indexed RAVmax had the largest area under the curve to predict severe FTR (AUC = 0.81, CI = 0.74–0.87). Similarly, indexed TAA at ED (AUC = 0.78, CI = 0.72–0.85) and tenting volume (AUC = 0.79, CI = 0.72–0.86) had an excellent ability to predict severe FTR, while RV EDV had a relatively smaller AUC (AUC = 0.72, CI = 0.64–0.80) (P < 0.0001 for all) (Figure 3).
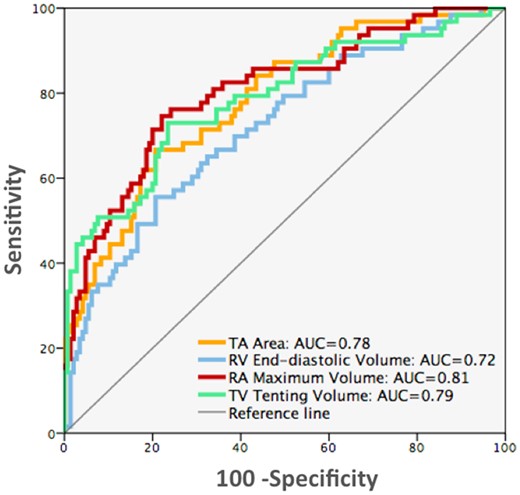
ROC curve analyses comparing the value of 3D echocardiographic parameters to identify patients with severe FTR. AUC, area under curve (P < 0.0001 for all). FTR, functional tricuspid regurgitation; 3D, three-dimensional.
FTR group comparisons
Table 3 summarizes the characteristics of FTR patients grouped by aetiology with respect to their controls. As expected, TOF patients were younger, while AF patients were older than the other groups. Women were more prevalent in the PH and AF groups. Regarding FTR severity, there were more patients with moderate or severe FTR in the PH (70%) and LHD (80%) groups compared with the AF (64%) and TOF (26%) groups.
Comparison of FTR groups with age- and gender-matched controls
| Atrial fibrillation | Left heart disease | Pulmonary hypertension | Tetralogy of Fallot | |||||
|---|---|---|---|---|---|---|---|---|
| Parameter | Controls (n = 28) | Patients (n = 70) | Controls (n = 74) | Patients (n = 66) | Controls (n = 76) | Patients (n = 101) | Controls (n = 32) | Patients (n = 43) |
| Age (years) | 71 (69–80) | 78 (72–83) | 64 (60–69) | 68 (52–77) | 52 (43–66) | 60 (47–74) | 21 (19–25) | 20 (14–23) |
| Women, n (%) | 20 (71) | 41 (59) | 37 (50) | 30 (45) | 56 (74) | 80 (80) | 15 (47) | 20 (47) |
| TA area at ED (cm2/m2) | 4.9 (4.5–5.7) | 7.3 (6.1–8.8)* | 4.9 (4.5–5.6) | 7.7 (6.5–9.0)* | 4.8 (4.4–5.3) | 7.5 (6.0–8.9)* | 5.3 (4.7–5.7) | 6.1 (5.3–7.3)* |
| Tenting volume (mL) | 2.6 (2.1–2.9) | 3.6 (2.5–5.1)* | 2.6 (2.2–3.3) | 4.6 (3.4–7.3)* | 2.6 (2.2–3.0) | 4.4 (3.0–6.3)* | 2.7 (1.9–3.6) | 2.3 (1.7–3.5) |
| RAVmax (mL/m2) | 27 (22–31) | 66 (46–79)* | 28 (23–35) | 46 (38–67)* | 28 (24–34) | 50 (35–62)* | 24 (19–30) | 31 (25–41) |
| RVEDV (mL/m2) | 63 (53–79) | 67 (59–82) | 62 (54–77) | 102 (81–161)* | 61 (52–75) | 115 (89–146)* | 130 (116–159) | 71 (55–76)* |
| RVEF (%) | 59 (57–63) | 51 (46–53)* | 58 (53–62) | 45 (35–51)* | 59 (56–62) | 41 (35–46)* | 56 (52–59) | 44 (39–47)* |
Values are median (I–III quartiles).
ED, end-diastole; FTR, functional tricuspid regurgitation; RAVmax, indexed right atrial volume; RVEDV, right ventricular end-diastolic volume; RVEF, right ventricular ejection fraction; TA, tricuspid annulus.
P < 0.05.
Regarding cardiac chamber remodelling, TOF patients had the largest RV volumes and the smallest RA volumes, whereas AF patients had the smallest RV volumes and the largest RA volumes (more than two-fold larger RAVmax than in TOF patients). Supplementary data online, Figures S3 and S4 show the correlations of TA at MS and ED with RAVmax and RVEDV for each FTR group.
Z-score analysis showed significant intergroup heterogeneity in terms of TA, right chamber size and leaflet tenting (Figure 4). LHD and particularly PH patients had marked dilation of both RV and RA chambers, as most patients had moderate/severe FTR. AF patients had the largest RA volumes and normal RV volumes, despite two of the three patients had moderate/severe FTR (Figure 4). Conversely, TOF patients had marked RV dilation (comparable with the PH group), without significant RA enlargement. Notably, in all FTR patient groups with significant RA enlargement, the TA was dilated. Increased tenting volume was associated with significant RV dilation (PH and LHD). However, TOF patients, despite having similar extents of RV dilation as PH patients, did not have increased leaflet tenting volume, suggesting that other factors besides RV volume (i.e. RV function, shape, ventricular interdependence, etc.) might also contribute to leaflet tethering in the PH and LHD groups.
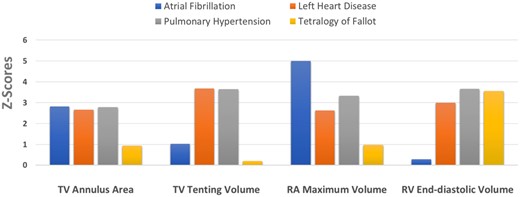
Z-scores in the four aetiologic groups of FTR. There was marked intergroup heterogeneity in right chamber and tricuspid geometry. FTR, functional tricuspid regurgitation.
Discussion
Our study was the first to use state-of-the-art 3DE quantitation to explore the relationships of TAA with both RA and RV volumes in 490 subjects. In this prospective study, we reported the role of RA volume as a major independent determinant of TAA and predictor of FTR severity, irrespective of cardiac rhythm.
The main findings of this study can be summarized as follows: (i) in both FTR patients and healthy subjects, TAA correlated more closely with RAVmax than with RVEDV; (ii) RAVmax was the best independent correlate of mid-systolic TAA, accounting for 41% (normals) and 56% (FTR) of TAA variance; and (iii) different FTR aetiologies were associated with variable extent of TA dilation, leaflet tenting, and right chamber remodelling.
In addition to PH and LHD patients with FTR, our study included two additional groups (AF and TOF), which provided unique insights on the effect of isolated RA dilation or isolated RV dilation on TV geometry. As recently shown by Utsunomiya et al.,6 we found that, in AF patients, dilation of TA is driven by RA dilation, and not by RV dilation.
Anatomically, RA myocardial wall—despite being thinner than the left atrial wall—includes muscle structures, such as the crista terminalis and pectinate muscles. The RA vestibule is a smooth muscular rim that anchors the pectinate muscles and surrounds the TV orifice, with its thin musculature fibres inserting into the leaflet hinges15 (Figure 5). The muscular fibres of RA vestibule are involved in the atrial flutter circuit and responsible for the ‘sphincteric-like’ contraction of TA. The traction from the severely enlarged RA (up to five SDs larger than in controls in our study) might lead to the displacement of lateral TV annulus onto the RV crest (Supplementary data online, Figure S5), as described for atrial functional mitral regurgitation.16 However, in contrast to the mitral annulus (MA), the TA does not have a well-defined annulus fibrosus, and only has a single right fibrous trigone keeping it in contact with myocardium over a larger part of its circumference. The lower amount of fibrotic tissue might explain why the TA is more prone to dilate along with the adjacent chamber than the MA. Moreover, only 40% dilatation of TA is required to result in significant FTR, whereas a 75% dilation of the MA is required for significant mitral regurgitation to occur.17 These differences may provide a pathophysiologic basis for the higher prevalence of FTR compared with functional mitral regurgitation reported in lone AF.18
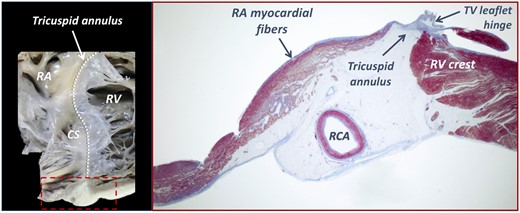
The anatomy of the right atrio-ventricular junction. Note the adipose structure of the atrioventricular groove, including the RCA and veins, and the close spatial relationship between the subendocardial muscular fibres and the fibrous leaflet hinge at the tricuspid annulus level (dashed line). CS, coronary sinus.
Our AF patients had the smallest RV volumes by 3DE among the four FTR groups, yet up to 68% of our AF patients would have been labelled as having a ‘dilated RV’ according to RV basal linear dimension >41 mm criteria,11 likely due to the RV conical deformation in AF patients with dilation confined to basal inflow.19 Since the RV basal region is devoid of papillary muscles, TV leaflet tethering is characteristically absent in AF patients, in contrast to PH or LHD where the RV is more spherical and diffusely dilated (Supplementary data online, Figure S5). The identification of RV dilation by volumetric methods in AF patients, when accompanied by leaflet tethering and RA and TA dilation, is either a consequence of a late stage of atrial FTR with massive-torrential regurgitation or a ventricular form of severe FTR due to PH or LHD that evolved to secondary permanent AF.6
The first study in FTR patients that hypothesized RA dilation as an important determinant of TA size was done by Sagie,8 who observed that RV dilation was not a prerequisite for FTR, as 32% of patients did not have significant RV dilation, whereas all their patients had a dilated RA by 2DE. Using CT, dilation of RA volume and TAA were also reported to occur early in the course of FTR, before RV dilation, the latter being more commonly a late finding associated with moderate-severe FTR.4 In agreement with our findings, TAAs were more closely correlated with RA volumes than with RV volumes by CT.
RA dilation, as well as FTR, is common in PH patients. Cioffi et al.20 reported that the Frank-Starling mechanism operates in the RA proportionally with PH severity and RV diastolic dysfunction. Thus, RA acts more as a reservoir than a conduit, playing an important role in maintaining RV filling and preload to preserve cardiac output and prevent RV failure during chronic pressure overload. As the RA myocardium between the ridges of pectinate muscles is very thin (almost ‘parchment’ like)21 and more predisposed to dilation than hypertrophy, this increased ‘work’ of the RA leads to dilation and increased wall stress in the early stages of PH, when RV size and function are still preserved.
TOF patients—despite similar extent of RV remodelling and RVEF—have very low prevalence of moderate or severe FTR (9.7%), as opposed to 41.9% in RV volume overload due to pulmonary regurgitation in patients without TOF.22 In TOF patients, RV shape is peculiar, characterized by basal bulging, broadening of the apex, and widening in cross section. Thus, RV basal bulging, which is accentuated by TA tilting,23 enables the severely dilated RV to be ‘disconnected’ from TA and RA, which were normal or only mildly dilated in our study. In systole, TA tilting, coupled with impaired longitudinal RV function and preserved transversal shortening to maintain RVEF,23 reduce the tension in the subvalvular apparatus of TV, thus limiting the papillary muscle displacement and tethering forces that occur in PH or LHD. This complex RV shape and TA mechanics in TOF and the close relationship between RA and TA size might explain why these patients did not have significant leaflet tethering and FTR in our study despite having severely dilated RV, concordant with previous reports.22,24
Clinical implications
In light of the key role of RA remodelling for FTR development in AF patients, previous terms, such as ‘idiopathic’ or ‘isolated TR’, for FTR seem inappropriate and could potentially mislead clinicians, who might not recognize worsening FTR as a potential complication of AF.25 In these patients, restoring the sinus rhythm may be occasionally associated with reverse remodelling of both RA and TA and with an impressive improvement in FTR severity.26 Raising awareness about the crucial role of RA volume as a determinant of FTR in AF patients will fuel future research on potential strategies to promote RA reverse remodelling and thereby avoid further progression of TA dilation and FTR worsening (i.e. reducing elevated RA pressure with diuretics, maintenance of sinus rhythm in persistent AF, early interventional annuloplasty for moderate FTR with severely dilated TA and RA, etc.).
Due to its higher accuracy and reproducibility, 3DE appears more suitable than conventional 2DE measures to assess the functional interplay between the complex-shaped right heart structures.6,14,26,27 However, 3DE might have underestimated volumes in very large RVs due to the difficulties to include the entire RV within the pyramidal-shaped dataset. Due to its less complex, elliptical shape, and far field position in apical views, the RA is easier to image and analyse with transthoracic 3DE. Given the significant variability in FTR related to loading conditions, respiration, systolic variation of regurgitant orifice, cycle length in AF, etc. and the challenges of FTR quantification, the measurement of RAVmax, and TAA by 3DE could represent sensitive echocardiographic markers of TV dysfunction severity in FTR patients.
Conclusions
RA volume is a major determinant of TAA in both healthy subjects and FTR patients, suggesting that RA dilation could be an important mechanism of TA dilation in FTR irrespective of cardiac rhythm and RV loading conditions. The relative importance of RA and RV dilation, TA dilation, and TV leaflet tenting on the mechanism of TV incompetence depends on the specific aetiology leading to FTR. Awareness of the pivotal role of 3D RAVmax as mechanism of TA dilation and as predictor of FTR severity has important implications for the imaging follow-up and treatment of FTR patients.
Supplementary data
Supplementary data are available at European Heart Journal - Cardiovascular Imaging online.
Funding
A.C.G. is a recipient of a research grant from Romanian Society of Cardiology.
Conflict of interest: none declared.
Data Availability
The data underlying this article will be shared on reasonable request to the corresponding author.
