


Abstract
In breast cancer (BC) patients treated with anthracyclines-based therapies, we aim at assessing whether adjuvant drugs impact cardiac function differently and whether their cardiotoxicity has a regional pattern.
In a multicentre study, 146 BC patients (56 ± 11 years) were prospectively enrolled and divided into three groups according to the received treatments: AC/EC-Group (doxorubicin or epirubicin + cyclophosphamide), AC/EC/Tax-Group (AC/EC + taxanes), FEC/Tax-Group (fluorouracil + EC + taxanes). Fifty-six patients of the total cohort also received trastuzumab. Left ventricular ejection fraction (LVEF) and global longitudinal strain (GLS) were calculated before starting chemotherapy (T0), at 3 months (T3), at 6 (T6), and 12 months (T12). A ≥10% drop of EF, while remaining within the normal range, was reached at T6 in 25.3% of patients from the whole cohort with an early decrease only in FEC/Tax-Group (P = 0.04). A ≥15% GLS reduction was observed in many more (61.6%) patients. GLS decreased early both in the whole population (P < 0.001) and in the subgroups. The FEC-Tax Group showed the worst GLS at T6. Trastuzumab further worsened GLS at T12 (P = 0.031). A significant reduction of GLS was observed in all LV segments and was more relevant in the anterior septum and apex.
The decrease of GLS is more precocious and pronounced in BC patients who received FEC + taxanes. Cardiac function further worsens after 6 months of adjuvant trastuzumab. All LV segments are damaged, with the anterior septum and the apex showing the greatest impairments.
Introduction
Cancer therapeutics-related cardiac dysfunction (CTR-CD) is the main manifestation of cardiotoxicity due to cancer therapy,1 and it is defined as a left ventricular (LV) systolic dysfunction with a decrease in LV ejection fraction (EF) of ≥10 percentage points, to a value <50%.2
Although LVEF is still considered as the main parameter for assessing systolic function, its limits in the diagnosis of subclinical damage have been well known since several years. To overcome EF limitations, speckle-tracking echocardiography is extensively applied to date.3–8 Global longitudinal strain (GLS) has been validated and included in the last consensus documents on cardiotoxicity2,9 as a useful tool for detecting myocardial injury at an early stage. Currently, a relative GLS reduction ≥15% from baseline value is suggestive in this setting of cardiac damage even when LVEF is still preserved.10 Therefore, GLS may help physicians to adopt tailored therapeutic strategies and start cardioprotective treatments whenever necessary. While the incremental value of GLS in the detection of cardiotoxicity from chemotherapy has been recognized,8 only a few studies tried to identify a typical pattern of regional impairment in LV mechanics.4,11 In the present multicentre prospective study involving a cohort of breast cancer (BC), patients we assessed subtle changes of LV function occurring with anthracyclines-based therapies and checked their persistence after anthracyclines discontinuation as well as the influence of adjuvant agents in determining an early onset and/or longer duration. We also explored whether some LV regions are more vulnerable than others to this kind of damage.
Methods
Study population
Enrolment criteria and design of the study (Figure 1) were previously shared and accepted among the participating centres.
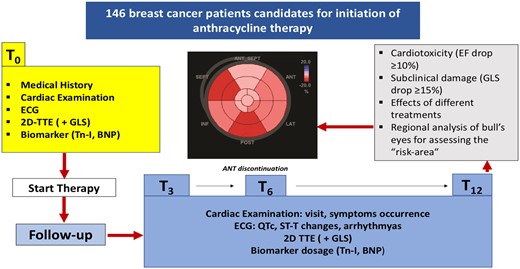
Design of the study.
Patients were consecutively recruited in a prospective way at eight participating centres (from the University Hospitals of Messina, Palermo, Naples, Pisa, Catania, Genoa, Turin, and Cagliari, Italy) with a minimum of 15 subjects that had to be enrolled per centre. At each of the recruitment centres, the following inclusion criteria had to be met: anthracyclines naïve BC patients >18 years old scheduled for receiving anthracyclines-based cancer therapy and afferent to the echocardiography laboratories before the treatment.
Patients exclusion criteria were the previous history of malignancies treated with cardiotoxic drugs and/or thoracic radiotherapy, history of cardiac disease (coronary artery disease, cardiomyopathies, more than mild valvular heart disease), non-sinus cardiac rhythm, left bundle branch block, previous cardiac surgery, inadequate transthoracic acoustic window.
Each patient underwent cardiologic consultation before starting chemotherapy (T0) and at 3 (T3), 6 (T6), and 12 months (T12) from the beginning of the treatment.
At the time of enrolment, cardiovascular risk factors and a detailed medical history were collected for all participants. Patients underwent complete cardiac examination, electrocardiogram, and echocardiogram at each visit (T0, T3, T6, and T12). Likewise, measurement of cardiac biomarkers, troponin I (Tn-I), and brain natriuretic peptide (BNP) was planned at baseline and at every scheduled check during follow-up (T0, T3, T6, and T12).
Written informed consents were obtained from all patients before their inclusion in the study. Every patient was free to drop the study anytime. The study was approved by the institutional review boards of all participating centres and complied with the Declaration of Helsinki.
The data underlying this article are available in the article and in its online supplementary material.
Cancer therapy regimens and cardiotoxicity monitoring
The treatment program for recruited patients was the same for each participating centre. In particular, all patients underwent standard doses of anthracyclines (doxorubicin or epirubicin) and cardiotoxicity from anthracyclines was monitored at each planned step. Additional chemotherapeutic agents more frequently used were: cyclophosphamide, fluorouracil, and taxanes (docetaxel or paclitaxel) added to anthracyclines according to the following standard chemotherapy regimens: AC/EC (doxorubicin or epirubicin + cyclophosphamide), AC/EC-Tax (AC/EC + taxanes), FEC-Tax (Fluorouracil + EC + taxanes). In the adjuvant setting, anthracyclines infusion was repeated for 4–6 cycles, docetaxel every 3 weeks for up to 4 cycles, paclitaxel weekly for 12 weeks, according to standard systemic therapy for BC (more details regarding drugs doses, cycles, and other chemotherapeutic agents are included in the Supplementary data online).
Accordingly, patients were divided into three groups for evaluating cardiotoxicity related to each type of treatment: AC/EC-Group, AC/EC/Tax-Group, and FEC/Tax-Group. We focused on EF and GLS changes from T0 to T3 (early chemotherapy toxicity), T6 (late chemotherapy toxicity), and T12 (late chemotherapy toxicity/recovery).
Two-dimensional transthoracic echocardiography before and during treatment
Echocardiographic examinations were performed at each centre by using the same ultrasound system (GE-E95 Vingmed Ultrasound AS, Horten, Norway) equipped with a cardiac M4S transducer. The data collection mode and the image acquisition technique were shared between the centres so that the same dataset was obtained for each patient. A comprehensive evaluation of cardiac dimensions and function as well as a careful assessment of valves and pericardium was done both at baseline and at each step during the follow-up.
Analysis of two-dimensional (2D) strain was performed offline through the automated function imaging, using semiautomatic tracking on high frame rate (>50 frames/s) apical views (four, two, and three chambers), previously transferred to an Echo-Pac workstation (V.202, GE). The LV GLS bull’s eye map was derived and GLS mean values were calculated at each step (T0, T3, T6, T12). A relative reduction of ≥15% in GLS values between pre- and post-chemotherapy was considered clinically significant for defining cardiac damage, according to current recommendations.10
Further methodological details on conventional and speckle-tracking echocardiography that were applied in the study, are present in the Supplementary data online.
In patients who met the criteria of subclinical cardiotoxicity (GLS drop of ≥15% from the baseline), the GLS bull's eye before treatment and the one corresponding to the peak of GLS reduction during treatment were analysed for each patient to compare the segmental values from baseline to the time of GLS drop. The difference of segmental longitudinal strain (from baseline to the time of GLS drop), named delta longitudinal strain (Δ-LS), was calculated to detect the myocardial region with the most relevant drop in myocardial deformation. We used a cut-off of Δ-LS ≥4% to identify segments with the greatest damage; conversely, segments with a Δ-LS <2% were considered as spared from the injury and those with Δ-LS in an intermediate range (≥2 but< 4), as only slightly impaired. These cut-off values were derived from, respectively, the 25th (Δ-LS = 2%) and 75th (Δ-LS = 4%) percentiles of the variation, before and after chemotherapy, of the myocardial strain of the overall segments.
Statistical analysis
Data were analysed using SPSS (V.20 for Windows; SPSS Inc., Chicago, IL, USA). The data are expressed as mean ± standard deviation. Chi-square test was employed to compare categorical variables. Repeated measures one-way analysis of variance (ANOVA), implemented with post hoc Bonferroni test, was used to compare continuous variables at different stages of follow-up. ANOVA was adjusted for covariates including main cardiovascular risk factors and anti-hypertensive drugs. Paired Student’s T-test was used to compare segmental strain values between baseline and follow-up. Intra-observer and inter-observer variability in the measurement of the segmental strain were assessed by performing Bland–Altman analysis and calculating the intra-class correlation coefficient (the results are reported in the Supplementary data online, Tables S1 and S2).
A P-value ≤0.05 was considered significant.
Results
Baseline patients’ characteristics
One-hundred and forty-six patients (mean age 56 ± 11 years, 98.6% female) with BC (62% invasive ductal carcinoma; 8% invasive lobular carcinoma; 30% other rarer histological types) were included in the study. Baseline demographic and clinical characteristics of the overall population as well as cancer treatment received are detailed in Tables 1 and 2 respectively, and more extensively described in Supplementary data online.
Demographic and clinical baseline data of the study population
| Variables | Patients (n = 146) |
|---|---|
| Age (years) | 56 ± 11 |
| Female, n (%) | 144 (98.6) |
| Invasive ductal carcinoma, n (%) | 90 (62) |
| Invasive lobular carcinoma, n (%) | 12 (8) |
| Others histological types, n (%) | 44 (30) |
| Heart rate, bpm | 74 ± 13 |
| BSA (m2) | 1.7 ± 13 |
| SBP (mmHg) | 124 ± 17 |
| DBP (mmHg) | 77 ± 11 |
| Arterial hypertension, n (%) | 51 (35) |
| Dyslipidaemia, n (%) | 37 (25) |
| Diabetes mellitus, n (%) | 24 (16) |
| Smoker, n (%) | 29 (20) |
| ACEi/ARB, n (%) | 29 (20) |
| Beta-blockers, n (%) | 22 (15) |
| Diuretics, n (%) | 10 (6.8) |
ACEi, angiotensin-converting enzyme inhibitor; ARB, angiotensin receptor blocker; bpm, beats per minute; BSA, body surface area; DBP, diastolic blood pressure; SBP, systolic blood pressure.
Distribution of all patients receiving anthracyclines
| Chemotherapy, n (%) | 146 (100%) |
|---|---|
| Chemotherapy without trastuzumab | 90 (61.6) |
| Chemotherapy + trastuzumab | 56 (38.3) |
| Chemotherapy groups | |
| AC/EC, n (%) | 30 (20.5) |
| AC/EC- Tax, n (%) | 69 (47.3) |
| FEC- Tax, n (%) | 47 (32.2) |
| Other agentsa, n (%) | 5 (3.4) |
| Chemotherapy, n (%) | 146 (100%) |
|---|---|
| Chemotherapy without trastuzumab | 90 (61.6) |
| Chemotherapy + trastuzumab | 56 (38.3) |
| Chemotherapy groups | |
| AC/EC, n (%) | 30 (20.5) |
| AC/EC- Tax, n (%) | 69 (47.3) |
| FEC- Tax, n (%) | 47 (32.2) |
| Other agentsa, n (%) | 5 (3.4) |
AC, doxorubicin + cyclophosphamide; EC, epirubicin + cyclophosphamide; FEC, fluorouracil + epirubicin + cyclophosphamide; Tax, taxanes (docetaxel/paclitaxel).
Capecitabine, Gemcitabine, Carboplatin, Cisplatin, Bevacizumab, Vinorelbine.
Clinical evaluation, biomarkers, and echocardiography in the whole population during follow-up
All patients were regularly followed by a cardio-oncologists team at each referring centre from baseline until 12 months after initiation of chemotherapy. Calculated mean duration of the overall follow-up was 309 ± 109 days. No patient developed symptoms of heart failure (HF) and the ECGs remained unremarkable throughout the follow-up.
Data from standard transthoracic echocardiography and biomarkers of the overall population at each step are summarized in Table 3.
Changes of the principal variables during follow-up in overall population
| Patients, n = 146 | T0 | T3 | T6 | T12 | P-value |
|---|---|---|---|---|---|
| SBP (mmHg) | 124 ± 17 | 126 ± 15 | 127 ± 16 | 130 ± 18* | *0.03 vs. T0 |
| DBP (mmHg) | 77 ± 11 | 75 ± 10 | 76 ± 10 | 78 ± 11 | 0.4 |
| HR (b/m′) | 74 ± 13 | 75 ± 10 | 74 ± 10 | *71 ± 12 | *0.04 vs. all |
| Troponin I (ng/mL) | 0.01 ± 0.008 | 0.03 ± 0.03* | 0.02 ± 0.01 | 0.01 ± 0.01 | * 0.004 vs. T0 |
| BNP (pg/mL) | 36.9 ± 25 | 55 ± 32.3* | 39.1 ± 22.6 | 33.5 ± 18.3° | * 0.01 vs. T0 , °0.04 vs. T3 |
| LVEF (%) | 62 ± 5 | 60 ± 5* | 59 ± 5° | 59 ± 4# | *,°,# <0.001 vs. T0 |
| EDVi (mL/m2) | 43.1 ± 13.4 | 44 ± 13.2 | 43.1 ± 12.4 | 41.1 ± 13.6* | * 0.03 vs. T3 |
| ESVi (mL/m2) | 17.9 ± 5.2 | 19.7 ± 5.2* | 20.3 ± 5.3° | 19.4 ± 5.2 | * 0.005 vs. T0,°<0.001 vs. T0 |
| WMSI | 1 ± 0 | 1 ± 0 | 1 ± 0 | 1 ± 0 | |
| S′ mean (cm/s) | 7.7 ± 1.5 | 7.4 ± 1.8 | 7.2 ± 1.5* | 7.3 ± 1.5° | * <0.001 vs. T0,°0.002 vs. T0 |
| LV GLS (%) | −20.8 ± 2.7 | −18.7 ± 2.9* | −18.1 ± 2.7° | −18.2 ± 3# | *,°,# <0.001 vs. T0 |
| LAVi (mL/m2) | 29.5 ± 9.4 | 28.9 ± 7.8 | 28.4 ± 8.3 | 28.2 ± 8.3 | 0.3 |
| E/A | 1.04 ± 0.42 | 1.05 ± 0.42 | 1.03 ± 0.39 | 1 ± 0.38 | 0.06 |
| E/E′ | 8 ± 2.8 | 8 ± 2.3 | 8.3 ± 2.3 | 8.3 ± 2.7 | 0.1 |
| TAPSE (mm) | 23 ± 4 | 23 ± 4 | 22 ± 4 | 24 ± 4* | * 0.001 vs. T3 |
| s-PAP (mmHg) | 27 ± 7 | 28 ± 8 | 27 ± 7 | 28 ± 5 | 0.9 |
BNP, brain natriuretic peptide; EDVi, end-diastolic volume indexed; ESVi, end-systolic volume indexed; GLS, global longitudinal strain; HR, heart rate; LAVi, left atrial volume indexed; LV, left ventricle; LVEF, left ventricle ejection fraction; s-PAP, systolic pulmonary artery pressure; TAPSE, tricuspid annular plane systolic excursion; WMSI, wall motion score.
With regard to biomarkers, Tn-I showed a slight increase at T3 vs. T0 (0.03 ± 0.03 ng/mL vs. 0.01 ± 0.008 ng/mL, P = 0.004); similarly, a significant increase of BNP was found at T3 vs. T0 (55 ± 32.3 pg/mL vs. 36.9 ± 25 pg/mL, P = 0.01). Although increased, both Tn-I and BNP values remained in the normal range and returned to baseline values at the last follow-up after 1-year (T12) from the onset of chemotherapy.
In the whole population, LVEF showed a mild and stable reduction at every stage compared to the baseline (Table 3). A ≥ 10% drop in EF compared to the baseline was reached in 34 patients (23.3%) at 3 months and in 37 (25.3%) at 6 months; however, EF absolute values remained >50% (with no patient developing cardiotoxicity according to the EF criterion2).
Alterations of myocardial function identified by using 2D strain off-line analysis were more relevant. A relative reduction of GLS ≥15% (subclinical damage) compared to the baseline was observed in 61.6% (90/146) of patients after chemotherapy, a much higher number than that identified by EF. In addition, GLS decreased in the whole population from T0 (−20.8 ± 2.7 %) to T3 (−18.7 ± 2.9%, P < 0.001), keeping this stable trend at T6 (−18.1 ± 2.7%, P < 0.001) and T12 (−18.2 ± 3%, P < 0.001), meaning early onset of myocardial injury (Table 3).
Analysis of LVEF and GLS changes according to chemotherapy protocols
Table 4 shows LVEF and GLS data in groups divided according to the type of chemotherapy.
LVEF and GLS changes up to 6 months in overall population according to the type of chemotherapy
| Chemotherapy | ||||
|---|---|---|---|---|
| T0 | T3 | T6 | ||
| LVEF (%) | ||||
| AC/EC | 63 ± 3 | 63 ± 6 | 61 ± 1 | NS |
| AC/EC-Tax | 62 ± 6 | 60 ± 6 | 59 ± 7* | *0.003 vs. T0 |
| FEC-Tax | 63 ± 5 | 60 ± 5* | 58 ± 5§ | *0.04 vs. T0, §0.001 vs. T0 |
| LV GLS (%) | ||||
| AC/EC | −22.5 ± 0.1 | −19.2 ± 0.4* | −18.5 ± 0.9§ | * 0.002 vs. T0, § <0.001 vs. T0 |
| AC/EC-Tax | −20.7 ± 3.2 | −18.5 ± 3.5* | −18.2 ± 2.9§ | *0.001 vs. T0, §<0.001 vs. T0 |
| FEC-Tax | −20.7 ± 2.2 | −19 ± 2.2* | −17.8 ± 2.7§° | *0.01 vs. T0, §<0.001 vs. T0, °0.02 vs. T3 |
In the whole population, EF did not decrease below the normal range (>50%) regardless of the type of chemotherapy. However, significant differences about EF trend can be observed according to the different drug protocols. In patients treated with AC/EC protocol, a non-significant reduction of LVEF has been observed during the 12-month follow-up. However, when taxanes were added to the protocol, a significant impairment of LVEF occurred after 6 months (P = 0.003). When the protocol included taxanes, anthracyclines, and florouracil a significant decrease of LVEF already occurred early, after three months, (T3 vs. T0, P = 0.04), and it was more evident at T6 (T6 vs. T0, P = 0.001).
More relevant and earlier were the alterations of myocardial function which were identified by 2D strain. Indeed, GLS decreased in the overall population since T3. Moreover, while in the other groups no significant differences were observed between T3 and T6, in FEC-Tax Group a further GLS reduction was observed at T6 (-17.8 ± 2.7%) compared to T3 (−19± 2.2%; P=0.02 T6 vs.T3) (Table 4, Figure 2).
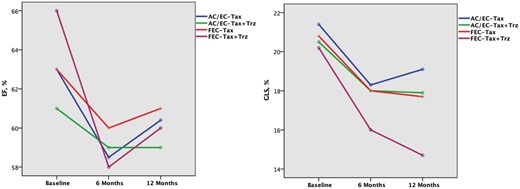
Changes of LVEF (A) and GLS (B) from baseline until 1 year according to the type of chemotherapy and the addition of trastuzumab at T6. At 12 months, there was a no significant decrease of LVEF in each protocol, whether or not trastuzumab was administered. (B). In all groups, GLS decreased over time, with a greater extent at 12 months (P < 0.001 vs. baseline), with the only exception of the patients who underwent AC/EC – Tax without trastuzumab showing the worst GLS value at 6 months (P = 0.002 vs. baseline). See Tables 2-3 for abbreviations.
To evaluate the effect of trastuzumab when added to the other chemotherapy protocol, we compared patients who underwent chemotherapy with (n = 56) and without trastuzumab (n = 90). In the whole population we found that the reduction of LVEF was still significant after 12 months, only in patients who received trastuzumab (Table 5, Figure 3). Moreover, the addition of trastuzumab to chemotherapy determined a progressive worsening of GLS throughout the follow-up with persistent lower values than those observed at the same step in the group treated with conventional chemotherapy without trastuzumab (Table 5, Figure 3). The same trend was observed and was more evident when analysing each single chemotherapy protocol according to the addition of trastuzumab (Table 6, Figure 2). In particular, FEC-Tax and AC/EC-Tax patients who received trastuzumab showed a significant GLS reduction at T12 (p < 0.001 for both), which did not occur in patients receiving only chemotherapy (Table 6). No patient of the AC/EC Group received adjuvant trastuzumab at the end of anthracyclines.
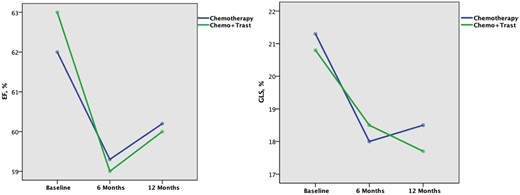
Changes of LVEF (A) and GLS (B) from baseline until 1 year in patients treated only with chemotherapy (blue line) and in those receiving also trastuzumab (green line). The significant drop of both LVEF (A) and GLS (B) from baseline (before starting chemotherapy) to 6 months is due to cardiotoxicity from anthracyclines. At 6 months 56 patients start trastuzumab, however, LVEF (A) is unable to identify the reduction of systolic function 6 months later in these patients. Conversely, GLS (B) reveals that at 12 months patients receiving only chemotherapy moved towards a recovery from myocardial injury (blue line), while those receiving also trastuzumab (green line) had a further decrease of systolic function. See Table 5 for P-values. Trast, trastuzumab.
LVEF and GLS changes during follow-up in patients underwent chemotherapy with (n = 56) and without (n = 90) trastuzumab
| T0 | T3 | T6 | T12 | P-value | |
|---|---|---|---|---|---|
| LVEF (%) | |||||
| CT without TRZ, n = 90 | 62 ± 5 | 60.5 ± 5.3 | 59.3 ± 5.3* | 60.2 ± 4.7 | *0.005 vs. T0 |
| CT +TRZ, n = 56 | 63 ± 5.3 | 60.5 ± 6.2 | 59 ± 5.2* | 60 ± 4.4° | *0.027 vs. T0; °<0.001 vs. T0 |
| LV GLS (%) | |||||
| CT without TRZ, n = 90 | −21.3 ± 3.2 | −18.9 ± 3.8* | −18 ± 2.9° | −18.5 ± 3.6§ | *0.03 vs. T0; °<0.001 vs. T0; §0.003 vs. T0 |
| CT + TRZ, n = 56 | −20.8 ± 2.5 | −18.3 ± 1.7* | −18.5 ± 2.3§ | −17.7 ± 2.1° | *0.001 vs. T0; §0.001; vs. T0; °0.031 vs. T0 |
CT, chemotherapy; GLS, global longitudinal strain; LVEF, left ventricle ejection fraction; TRZ, trastuzumab.
Infusion of TRZ started on average at 6 months after anthracyclines infusion and continued for 1 year. For further explanation see the text.
LVEF and GLS changes in each group of chemotherapy according to the addition of trastuzumab at T6
| Start anthracyclines | Start trastuzumab | ||||||
|---|---|---|---|---|---|---|---|
| T0 | T6 | T12 | |||||
| TRZ YES | TRZ NO | TRZ YES | TRZ NO | TRZ YES | TRZ NO | ||
| LVEF (%) | |||||||
| AC/EC | 63 ± 3 | 61 ± 1 | 61 ± 2 | ns | |||
| AC/EC-Tax | 61 ± 5 | 63 ± 7 | 59 ± 5 | 58.5 ± 6 | 59 ± 4 | 60.4 ± 5 | ns |
| FEC-Tax | 66 ± 3 | 63 ± 5 | 58 ± 7 | 60 ± 6 | 60 ± 5 | 61 ± 3 | ns |
| GLS (%) | |||||||
| AC/EC | −22.5 ± 0.1 | −18.5 ± 0.9§ | −18.2 ± 3* | §*<0.001 vs. T0 | |||
| AC/EC-Tax | −20.5 ± 3.5 | −21.4 ± 2.4 | −18 ± 3.7§ | −18.3 ± 3° | −17.9 ± 3* | −19.1 ± 3 | * < 0.001 vs T0 , § 0.02 vs. T0, ° 0.002 vs T0 |
| FEC-Tax | −20.2 ± 0.9 | 20.8 ± 2.3 | −16 ± 1 | −18 ± 2.8 | −14.7 ± 1* | −17.7 ± 2.9 | *<0.001 vs. T0 |
For abbreviations see Tables 2-3.
Bull's eye regional analysis
The results of the regional analysis of bull’s eye from basal deformation to that of the peak of reduction analysed in patients (n = 90/146, 61.6%) reaching subclinical damage (GLS drop ≥15%) are described in Table 7. A significant decrease of LS was observed in all segments, but a greater impairment was found in all (basal-mid-apical) segments of the anterior septum (mean value after chemotherapy = −14.8 ± 2.3%; mean Δ-LS ≥ 4%) and in the apex (mean value after chemotherapy= -16.5 ± 2.6%; mean Δ-LS ≥ 4%) (Figure 4). A less evident reduction was present in basal and mid-segments of the inferior wall; indeed, although their mean values after chemotherapy were close to normal (-17.7 ± 3.1%), the change from baseline (Δ-LS) was > 2%. Conversely, basal and mid-segments of the inferior septum (mean value after chemotherapy = −17 ± 2.1%; mean Δ-LS < 2%) and basal and mid-segments of the inferior-lateral wall (mean value after chemotherapy = −17.9 ± 3.1%; mean Δ-LS < 2%) appeared relatively spared by chemotherapy-related myocardial injury.
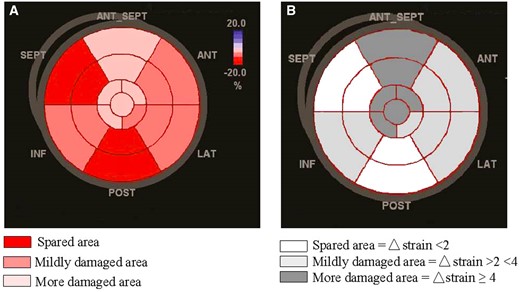
Pattern of anthracyclines mediated regional myocardial damage by speckle-tracking echocardiography shown in A by mean values of longitudinal strain (%) and in B by delta strain (%). Apex and anterior septum (pink segments in A; dark-grey segments in B) show the greater impairment.
Mean values of segmental longitudinal strain and delta (Δ ) strain between steps in pts with a GLS drop ≥15% during follow-up
| Before chemotherapy | Follow-up | P-value | Difference between steps | |
|---|---|---|---|---|
| (Δ-strain) | ||||
| Basal segments | ||||
| Inferoseptal | −16.5 ± 2.5 | −15.8 ± 2.4 | <0.001 | 0.9 ± 0.3 |
| Anteroseptal | −19.2 ± 2.9 | −14.5 ± 2.6 | <0.001 | 4.8 ± 1.7 |
| Anterior | −19.8 ± 3.5 | −16.6 ± 3.1 | <0.001 | 3 ± 1.2 |
| Anterolateral | −19.3 ± 3.1 | −17.3 ± 3.4 | 0.001 | 2.1 ± 1.3 |
| Inferolateral | −19.6 ± 3.3 | −17.8 ± 3.9 | 0.015 | 1.7 ± 0.7 |
| Inferior | −20.6 ± 3.5 | −18.3 ± 2.9 | 0.015 | 2.5 ± 1.3 |
| Mid-segments | ||||
| Inferoseptal | −19.5 ± 2.7 | −18.6 ± 1.9 | 0.005 | 0.8 ± 0.3 |
| Anteroseptal | −18.1 ± 3.6 | −14.2 ± 2.6 | 0.004 | 5.1 ± 1.4 |
| Anterior | −17.9 ± 3.1 | −15.3 ± 2.5 | 0.017 | 2.5 ± 1.4 |
| Anterolateral | −18.5 ± 3.7 | −15 ± 3.5 | <0.001 | 3.7 ± 1.4 |
| Inferolateral | −18.6 ± 2.7 | −18 ± 2.3 | 0.009 | 0.6 ± 0.4 |
| Inferior | −21.4 ± 3.7 | −17.1 ± 3.6 | <0.001 | 3.5 ± 1.3 |
| Apical segments | ||||
| Septal | −20 ± 2.1 | −15.9 ± 1.8 | 0.026 | 4.1 ± 1 |
| Anterior | −19 ± 3.3 | −14.3 ± 2.5 | 0.005 | 5.6 ± 1.2 |
| Lateral | −20.7 ± 2.3 | −17.3 ± 2.5 | <0.001 | 3.3 ± 1.2 |
| Inferior | −22.5 ± 3.8 | −17.7 ± 3.6 | <0.001 | 4.9 ± 1.5 |
| Apical cap | −22.5 ± 2.2 | −17.7 ± 2.6 | 0.001 | 4.9 ± 1.3 |
Discussion
The main findings of our study are the following: (i) Impaired LV function occurs in most patients with BC treated with anthracyclines; importantly, GLS, but not LVEF is able to recognize early myocardial damage; (ii) chemotherapy regimens including fluorouracil and taxanes beyond anthracyclines are associated with the earliest and more pronounced GLS decrease; (iii) trastuzumab also leads to a further and persisting GLS reduction after 6 months of treatment ; (iv) the most relevant chemotherapy-mediated decrease of regional strain seems to involve the anterior septum and the apex.
Our study showed that, although the mean EF value of the study population decreased during chemotherapy, it remained in the normal ranges. Indeed, a late (T6) drop ≥10% compared to baseline value was reached in 25.3% of patients, with an EF absolute value remaining >50% so that no patient developed cardiotoxicity according to the EF criterion. Therefore, this mild and stable reduction of EF may not actually have a real clinical impact, because it would not change in any way the management of these patients. Nonetheless, we agree that EF values around 50% could be a sort of ‘red-flag’ suggestive of initial myocardial damage.
On the contrary, GLS was more sensitive and identified subclinical alterations of the LV systolic function, as pointed out in recent recommendations.12
Moreover, we confirm the results of previous studies, identifying an early reduction of GLS in most of our patients, with a significant fall of GLS already at 3-months after starting therapy.13–15 No patients developed HF symptoms during the follow-up and only a subclinical LV dysfunction was identified. However, the early identification of myocardial damage secondary to anticancer treatment could allow to prevent the development of an overt HF, guaranteeing at the same time the best anticancer treatment to the patients. The SUCCOUR trial16 in this regard has just proven that patients diagnosed with CTRCD in the EF-guided arm had a larger reduction in LVEF at follow-up than in the GLS-guided arm (9.1 ± 10.9% versus 2.9 ± 7.4%, p = 0.03).
Beyond anthracyclines, docetaxel and paclitaxel are frequently used in breast cancer, in combination with or after anthracyclines and cyclophosphamide, fluorouracil, and followed or not by trastuzumab.17,18 All these agents appear to increase the incidence of HF; however, the contribution of individual agents in multidrug therapies is frequently difficult to assess.19
There is currently no consensus on the optimal treatment and/or prophylaxis of these cardiotoxicities, beside early detection and therapy discontinuation.20 In the trastuzumab setting, quarterly imaging has demonstrated a cumulative percentage of reduced LVEF (LVEF drop by >10–15% or to <50%) of 10% at 3 months, 19% at 6 months, and 25% at 12 months of therapy, respectively, in patients with prior anthracyclines exposure.21 The serial assessment of GLS in patients undergoing trastuzumab has demonstrated superior predictive value for future cardiotoxicity compared with changes in LVEF.6,14,21 Abnormal GLS has been consistently shown to precede diagnostic LVEF reductions by about 3 months in adjuvant trastuzumab treatment, which may provide a window of opportunity to initiate cardioprotective therapy and prevent discontinuation of potentially life-saving anticancer treatment.3
Accordingly, we found a significant decrease of systolic function in every group of chemotherapy, as per the well-known effects of anthracyclines-based chemotherapy. Interestingly, the FEC-Tax Group showed an earlier reduction of EF already at T3, not observed in other types of treatment, and the worst GLS value compared to the other groups at T6. Altogether these data seem to identify FEC-Tax treatment as likely the more cardiotoxic. On the other hand, as previously shown, fluorouracil itself may induce direct myocardial injury and impair oxygen delivery, probably leading to more serious cardiotoxicity in treated patients. However, we are not able to determine whether the early GLS reduction in this chemotherapy regimen is dependent on the action of fluorouracil alone or, more likely, it is the effect of its combination with epirubicin and cyclophosphamide. Anyway, this group of patients may need to be closely monitoring to prevent HF.
Of note, the addition of trastuzumab to conventional chemotherapy did not impact on EF at follow-up, while it induced a further and persistent worsening of GLS until T12, confirming the cardiotoxic role of trastuzumab beyond anthracyclines22 and the incremental value of GLS beyond EF.
In order to investigate for a possible regional pattern of anthracyclines-mediated myocardial damage, we analysed the bull’s eyes at basal and at the peak of GLS reduction, comparing the values of each LV 17 segments. Even if all myocardial segments showed a significant reduction of longitudinal strain, we observed that the anterior septum and the apex showed the greatest impairment (mean ‘delta’ strain ≥4%). In patients receiving anthracyclines, regional wall motion abnormalities involving in particular the apical segments, have long been recognized.23 Poterucha et al.4 found that changes of LV longitudinal strain in mid and apical segments were moderately predictive of decreased LVEF and that changes in LV segmental longitudinal strain in the apical cap were correlated with cumulative anthracyclines doses. Similarly, previous studies also observed a significant reduction of longitudinal strain involving the interventricular septum.24 The explanation for this regional pattern is currently unclear, but shear stress forces acting differently in relation to LV geometry, as well as increased exposure to anthracyclines of regions of terminal circulation, or the differential local activation of signal transduction pathways of fibrosis or apoptosis, can be hypothesized as underlying mechanisms. However, the pattern of myocardial damage that we have shown could not reflect what usually occurs after anthracyclines exposure and could be affected by loading conditions (anaemia, hypovolaemia, etc.) as well as multidrug treatments. Nonetheless, while these findings need confirmation in further studies, our data highlight that it is crucial not only to consider global function (GLS) but also to look carefully at the polar map of deformation which is a faithful representation of the site as well as the extent of the heart damage.
Limitations and Conclusions
Our multicentre prospective study is limited by the relatively small sample size that could have partially affected our results. As all patients enrolled in our study underwent anthracyclines, we cannot evaluate the independent cardiotoxic effect of each additional drug (i.e. fluorouracil, cyclophosphamide, taxanes, trastuzumab, etc.) included in the different treatments beyond anthracyclines. Moreover, at the moment we are unable to demonstrate whether regional and global reductions of LS are predictive of late cardiac dysfunction because a long-term data are not available. However, a long-term follow-up is ongoing.
Lastly, the cardiotoxic effect of radiotherapy was not investigated due to the differences existing in timing and total cumulative dosage among patients. On the other hand, radiation-induced cardiac damage may occur several years (>5 years) after irradiation.25 A long-term follow-up to investigate both the prevalence of radiotherapy-related cardiac damage is ongoing too.
In conclusion, we confirm that GLS is more sensitive than conventional echocardiography in early detection of anthracyclines-cardiotoxicity, and is able to discriminate different degrees of cardiotoxicity among several anthracycline-based regimens, as shown in patients treated with FEC-Tax or trastuzumab. Finally, segmental changes involving the anterior septum and the apex could represent a regional model of cardiotoxicity that might be typically induced by anthracyclines, thus supporting the need for implementing a more detailed echocardiographic analysis focused not only on EF and GLS but also on the regional strain.26
Supplementary data
Supplementary data are available at European Heart Journal - Cardiovascular Imaging online.
Funding
This research did not receive any specific grant from funding agencies in the public, commercial, or not-for-profit sectors.
Conflict of interest: none declared.
References
Thavendiranathan P, Negishi T, Somerset E, Negishi K, Penicka M, Lemieux J, et al. SUCCOUR investigators. Strain-Guided Management of Potentially Cardiotoxic Cancer Therapy. J Am Coll Cardiol. 2020 Nov 16:S0735-1097(20)37802-5.
