


It remains controversial whether cardiovascular magnetic resonance imaging with gadolinium only enhances acutely infarcted or also salvaged myocardium. We hypothesized that enhancement of salvaged myocardium may be due to altered extracellular volume (ECV) and contrast kinetics compared with normal and infarcted myocardium. If so, these mechanisms could contribute to overestimation of acute myocardial infarction (AMI) size.
Imaging was performed at 1.5T ≤ 7 days after AMI with serial T1 mapping and volumetric early (5 min post-contrast) and late (20 min post-contrast) gadolinium enhancement imaging. Infarcts were classified as transmural (>75% transmural extent) or non-transmural. Patients with non-transmural infarctions (n = 15) had shorter duration of symptoms before reperfusion (P = 0.02), lower peak troponin (P = 0.008), and less microvascular obstruction (P < 0.001) than patients with transmural infarcts (n = 22). The size of enhancement at 5 min was greater than at 20 min (18.7 ± 12.7 vs. 12.1 ± 7.0%, P = 0.003) in non-transmural infarctions, but similar in transmural infarctions (23.0 ± 10.0 vs. 21.9 ± 9.9%, P = 0.21). ECV of salvaged myocardium was greater than normal (39.5 ± 5.8 vs. 24.1 ± 3.1%) but less than infarcted myocardium (50.5 ± 6.0%, both P < 0.001). In kinetic studies of non-transmural infarctions, salvaged and infarcted myocardium had similar T1 at 4 min but different T1 at 8–20 min post-contrast.
The extent of gadolinium enhancement in AMI is modulated by ECV and contrast kinetics. Image acquisition too early after contrast administration resulted in overestimation of infarct size in non-transmural infarctions due to enhancement of salvaged myocardium.
Introduction
Cardiovascular magnetic resonance (CMR) imaging with late gadolinium enhancement (LGE) has become the gold standard for detection of myocardial infarction, as it correlates well with the size of irreversibly injured myocardium in preclinical studies and traditional markers of myocardial damage.1–4 The size and extent of LGE have shown prognostic value in patients with chronic myocardial infarction, suspected coronary artery disease, and clinically unrecognized myocardial infarction.5–8 However, a recent review did not find sufficient evidence to establish independent prognostic value of LGE in acute myocardial infarction (AMI).9
In the setting of AMI, the extent of LGE has been shown to decrease within the first weeks.3,10–12 Some have proposed that early overestimation of infarct size is due to imaging of the peri-infarct zone and highlighted the importance of timing of image acquisition after contrast administration.3,13,14 Recently, two studies described the utility of early gadolinium enhancement for detection of the myocardial area at risk (infarcted and salvaged myocardium).15,16 Thus, further understanding of gadolinium kinetics in infarcted and salvaged myocardium in AMI is important for accurate discrimination of reversibly injured from infarcted myocardium.
The aim of this study was to use quantitative T1 maps to describe gadolinium kinetics in the myocardium of patients with AMI by using pre- and post-contrast T1 values to estimate the ECV, the space in which gadolinium distributes.17 We hypothesized that (i) gadolinium kinetics and ECV would be different in salvaged, infarcted, and remote myocardium, (ii) salvaged myocardium would enhance early after contrast administration, and (iii) the enhancement of salvaged myocardium would cause overestimation of infarct size early after gadolinium administration in AMI.
Methods
Patient selection
Consecutive patients who presented with AMI and underwent cardiac catheterization were included. Infarction was defined and managed according to current guidelines and physician judgment. Inclusion criteria were CMR imaging performed ≤7 days after symptom onset, with both protocol-specific serial T1 quantification and LGE imaging. Exclusion criteria were haemodynamic instability, significant arrhythmias, congenital heart disease, previous myocardial infarction or coronary bypass surgery, absence of infarct on LGE imaging, LGE patterns of myocarditis, and standard CMR contraindications. This study was approved by the institutional review board of the National Heart, Lung, and Blood Institute, Bethesda, MD, USA (clinicaltrials.gov identifier NCT00027170). All patients gave written informed consent.
CMR acquisition
Imaging was performed using a 32-channel coil at 1.5 T (Siemens Medical Solutions, Erlangen, Germany). All acquisitions were electrocardiogram gated. Cine imaging was done in a short-axis orientation covering the left ventricle. One slice with a regional wall motion abnormality was chosen for kinetic imaging. T1 quantification was performed with a motion-corrected Modified Look-Locker Inversion (MOLLI) recovery sequence during a breath-hold.17 Five images were acquired after the first inversion followed by three heart beat recovery, and three images were acquired after the second inversion. Typical imaging parameters were steady-state free-precession (SSFP) readout, field of view 360 × 270 mm2, matrix size 256 × 144, slice thickness 6 mm, repetition time/echo time 2.7/1.1 ms, and parallel imaging factor 2. Images were acquired before 2, 4, 8, 10, 15, and 20 min and after intravenous administration of 0.15 mmol/kg bolus gadopentetate dimeglumine (Magnevist®, Bayer Healthcare Pharmaceuticals, Wayne, NJ, USA).
Standard LGE images were acquired between 10 and 20 min after contrast administration using a phase-sensitive inversion recovery, segmented turbo fast low-angle shot sequence.18 Typical imaging parameters were field of view 360 × 270 mm2, matrix size 256 × 144, slice thickness 6 mm, inversion time set to null the normal myocardium (commonly 300 ms), repetition time/echo time 8.5/3.2 ms. Parallel imaging factor 2 was only used if necessary for patient compliance.
At 5 and 20 min after contrast administration, a phase-sensitive inversion recovery, single-shot sequence with SSFP readout was used to acquire a full stack of images of the myocardium. The inversion pulse was fixed at 200 ms for the 5-min acquisition and optimized to null normal myocardium at 20 min (typically 350 ms). Typical imaging parameters were field of view 360 × 270 mm2, matrix size 192 × 108, slice thickness 6 mm, repetition time/echo time 2.8/1.4 ms, and parallel imaging factor 2.
Image analysis
Image analysis was performed using a commercially available workstation (Leonardo, Siemens) and a custom in-house software programme. Left ventricular (LV) volumes, mass, and ejection fraction were quantified by computer-assisted planimetry. Regions of interest (ROIs) were placed in infarcted, salvaged, and remote myocardium as well as in the LV blood pool on T1 maps. Infarct was defined as areas that displayed enhancement on standard LGE images, based on the feature analysis and combined thresholding (FACT) computer algorithm, which has been validated by histopathology.2 Infarcts were classified as transmural if the radial transmural extent of LGE was >75%. Transmural infarcts were divided into an endocardial (infarctendo) and epicardial (infarctepi) ROI. In non-transmural infarctions, an ROI for salvaged myocardium was defined as the area of non-LGE myocardium epicardial to the infarcted myocardium. An ROI was also placed in areas of microvascular obstruction (MVO), defined as areas of hypoenhancement (<2SD) within the hyperenhanced areas on LGE images. Care was taken to exclude areas of MVO in the infarct ROIs. Remote myocardium did not display LGE and was in a different myocardial territory than the infarction.
The size of enhancement was quantified on nine slices of the heart using single-shot LGE images using both the FACT algorithm and a 2SD threshold for enhancement. The number of enhanced voxels as a per cent of the LV was reported using both methods. To display the impact that timing of image acquisition has on the visually detectable extent of infarction, synthetic LGE images were generated from the post-contrast T1 maps, producing an image contrast corresponding to a traditional phase-sensitive LGE image at the optimal inversion time.
Calculation of ECV
ECV was calculated for infarcted, salvaged, MVO, and remote myocardium at all MOLLI imaging time points regardless of whether steady state had been achieved. Haematocrit was drawn on the day of the CMR exam.
Statistics
Statistical analysis was performed using MedCalc (version 12.7.7, Ostend, Belgium) or SAS (version 9.3, Cary, NC, USA). Data are presented as mean ± SD unless otherwise indicated. Paired and unpaired t-tests were used to compare means of normally distributed continuous variables as appropriate. Otherwise, the Mann–Whitney or Signed Wilcoxon test was used. Differences in T1 of myocardium ROIs and ECV were tested with repeated-measures analysis of variance to account for intra-subject testing, and Bonferroni correction to account for multiple comparisons. Categorical data were analysed with χ2 or Fischer's exact test as appropriate. A P-value of <0.05 was considered statistically significant.
Results
Patient characteristics
Thirty-seven patients underwent CMR imaging 4.7 ± 1.6 days after AMI, 15 had a non-transmural infarction in the imaged slice on standard LGE images. Seventy-eight per cent (29/37) were male, with a mean age of 58.1 ± 12.8 years (Table 1). The majority of patients (70%) presented with an ST elevation myocardial infarction (STEMI).
Baseline characteristics
| Characteristic | Non-transmural infarction (n = 15) | Transmural infarction (n = 22) | P-value |
|---|---|---|---|
| Age (years) | 58.3 ± 12.5 | 58.0 ± 13.3 | 0.95 |
| Men, n (%) | 12 (80) | 17 (77) | 1.0 |
| Body mass index (kg/m2) | 28.7 ± 5.5 | 28.7 ± 6.8 | 0.98 |
| Hypertension, n (%) | 8 (53) | 15 (68) | 0.13 |
| Dyslipidaemia, n (%) | 14 (93) | 22 (100) | 0.85 |
| Diabetes, n (%) | 3 (20) | 6 (27) | 0.91 |
| Current smoker, n (%) | 4 (27) | 3 (14) | 0.57 |
| Family history of ischaemic heart disease, n (%) | 4 (27) | 3 (14) | 0.41 |
| Previous stable angina, n (%) | 3 (20) | 5 (23) | 1.0 |
| Estimated glomerular filtration rate (mL/min) | 79.9 ± 19.7 | 76.5 ± 20.4 | 0.61 |
| STEMI, n (%) | 9 (60) | 17 (77) | 0.45 |
| Days since infarction | 4.7 ± 1.5 | 4.7 ± 1.8 | 0.93 |
| Culprit vessel, n (%) | 0.44 | ||
| Left anterior descending artery | 4 (27) | 8 (36) | |
| Circumflex artery | 6 (40) | 10 (45) | |
| Right coronary artery | 5 (33) | 4 (18) | |
| TIMI flow 0 before reperfusion, n (%) | 14 (93) | 15 (68) | 0.16 |
| TIMI flow 3 after reperfusion, n (%) | 13 (87) | 18 (82) | 0.95 |
| Door to balloon time, STEMI patients (min), median (inter-quartile range) | 67 (58.3–97.3) | 79 (55.7–111.2) | 0.91 |
| Time from symptom onset to reperfusion (STEMI patients) | |||
| ≥12 h, n (%) | 2 (22) | 3 (18) | 1.0 |
| <12 h (h) | 2.9 ± 0.71 | 5.0 ± 2.9 | 0.02 |
| Mean peak troponin (ng/mL) | 33.4 ± 31.3 | 69.9 ± 43.0 | 0.008 |
| LV ejection fraction (%) | 53 ± 4.3 | 48.1 ± 11.3 | 0.08 |
| LV mass (g) | 100.5 ± 31.0 | 118.8 ± 32.5 | 0.10 |
| LV end-diastolic volume (mL) | 154.7 ± 31.7 | 165.5 ± 34.9 | 0.34 |
| LV end-systolic volume (mL) | 73.6 ± 21.4 | 87.3 ± 31.1 | 0.15 |
| MVO, n (%) | 1 (7) | 15 (68) | <0.001 |
TIMI, thrombolysis in myocardial infarction.
Consistent with smaller infarctions, patients classified as having a non-transmural AMI had shorter symptom to reperfusion times (P = 0.02, Figure 1), significantly lower peak troponin levels (P = 0.008, Figure 1), and trended towards better LV ejection fraction (Table 1) than patients with transmural AMI. Patients with non-transmural AMI were also less likely to have MVO (P < 0.001, Figure 1) compared with patients with transmural AMI. There were no differences in cardiovascular risk factors, door-to-balloon times, culprit vessel location, or adequacy of reperfusion between the patient groups.
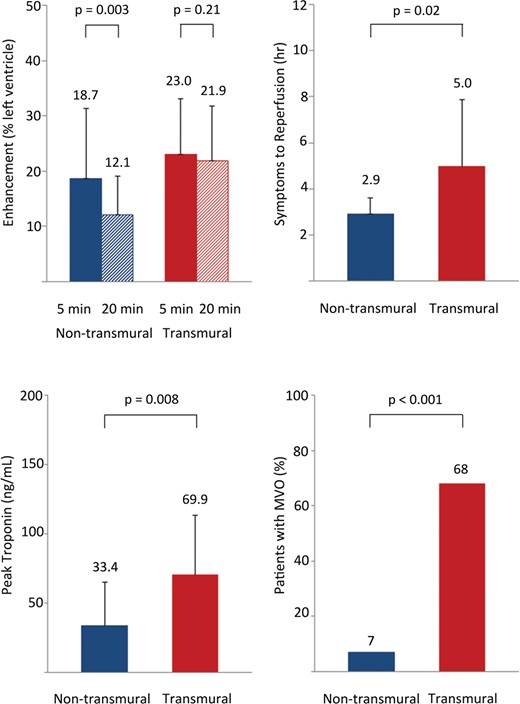
Transmural extent of infarction predicts important clinical parameters. Early gadolinium enhancement (5 min) overestimated the size of AMI in patients with non-transmural infarction. Patients with non-transmural infarctions had significantly shorter duration of symptoms to reperfusion (top right), lower peak troponin levels (bottom left), had a lower incidence of MVO (bottom right) than patients with transmural infarctions. The size of enhancement was similar at 5 and 20 min in patients with transmural infarctions.
Size of enhancement early and late after contrast administration
Consistent with the hypothesis that early gadolinium enhancement overestimates AMI size, the enhanced area in non-transmural infarctions was significantly greater 5 min after contrast administration than at 20 min using the FACT quantification method (18.7 ± 12.7 vs. 12.1 ± 7.0%, P = 0.003, Figure 1). A clinical example is displayed in Figure 2. In transmural infarctions, the extent of enhancement was not significantly different at the two time points (23.0 ± 10.0 vs. 21.9 ± 9.9%, P = 0.21, Figure 1).
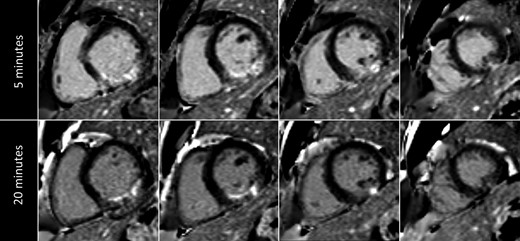
Overestimation of infarct size in a patient with non-transmural infarction. In a patient with a non-transmural infarction in the right coronary artery territory, the enhancement at 5 min (upper row) is clearly greater than at 20 min (lower row) after contrast administration.
As a quality assurance metric, we also analysed the extent of enhancement using a 2 SD threshold. For patients with non-transmural AMI, the extent of gadolinium enhancement decreased from 5 to 20 min post-contrast (26.5 ± 13.0 vs. 21.0 ± 10.4%, P = 0.006) while the extent of enhancement in transmural AMI did not change significantly (29.9 ± 13.8 vs. 28.8 ± 12.0%, P = 0.57).
Native T1 values
Figure 3 depicts the native T1 maps in two patients with non-transmural infarctions and two patients with transmural infarction. In general, the infarct-related region of increased T1 appeared transmural in infarctions that were classified as non-transmural or transmural. Longer native T1 values are consistent with increased water content as might be seen in oedematous tissue.
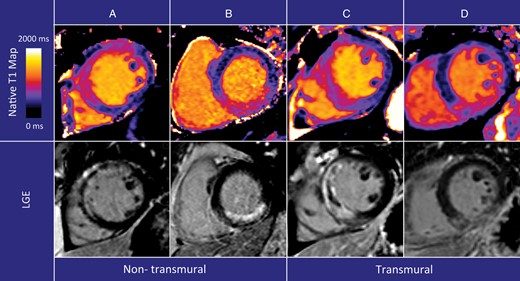
Native T1 maps in non-transmural and transmural infarction. Native T1 maps (top row) and LGE of the infarction (bottom row). Both in patients with non-transmural and transmural infarctions, the abnormality in native T1 abnormality appears transmural. The culprit lesion was the left anterior descending artery in images in (A and C) and the right coronary artery in (B and D).
In non-transmural infarctions, native T1 values were not significantly different in infarcted (1212 ± 79 ms) and salvaged myocardium (1173 ± 71 ms), P = 0.15. The T1 of both the infarcted and salvaged myocardium was longer than the T1 of remote myocardium (956 ± 37 ms, both P < 0.001).
In transmural infarctions, the T1 values in the endocardial part of the infarct were similar to the epicardial half of the infarct (T1 infarctendo 1221 ± 84 ms and T1 infarctepi 1218 ± 89 ms, P = 1.0). T1 infarctendo and T1 infarctepi were longer than the T1 of remote myocardium (992 ± 72 ms, P < 0.001 for both).
T1 kinetics in myocardium and blood after contrast administration
The changes in blood and myocardial T1 as a function of time are shown in Figure 4 for non-transmural and transmural infarctions. T1 values are presented in Supplementary data online, Table S1. Shorter T1 values are consistent with higher gadolinium concentrations.
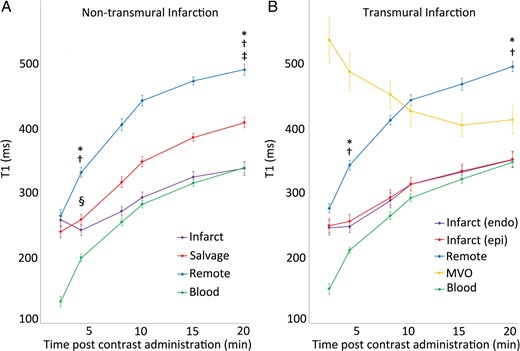
T1 in myocardium and blood post-contrast administration. Full data provided in Supplementary data online, Table S1. Data presented as mean ± 1 SEM to depict confidence limits of the mean values. (A) *P < 0.001 for infarct vs. remote, †P < 0.001 salvage vs. remote, ‡P < 0.001 infarct vs. salvage, §P > 0.05 infarct vs. salvage. (B) *P < 0.001 for infarctendo vs. remote, †P < 0.001 infarctepi vs. remote.
In non-transmural infarctions, there was no statistical difference in post-contrast T1 values between infarcted, salvaged, and remote myocardium at 2 min. By 4 min, the T1 values of infarcted and salvaged myocardium were not different from each other (P = 0.17), but both were different than remote (P < 0.001). Between 8 and 20 min, the salvaged myocardial T1 was longer than the infarcted myocardium (P < 0.001), and both T1s were shorter than remote myocardium (P < 0.001), consistent with gadolinium enhancement of both infarcted and salvaged myocardium.
In transmural infarcts, the T1 of infarctendo and infarctepi was not different (P = 0.11), but both were shorter than remote myocardium (P < 0.001) at 4 min. The infarctendo and infarctepi values were not significantly different during the entire imaging period. At 20 min, both regions exhibited shorter T1 values than the remote myocardium (P < 0.001).
The T1 of blood in the left ventricle recovered throughout the time of imaging. T1 values of infarcted myocardium and blood approached each other at the later time points in both transmural and non-transmural infarcts. At 20 min, the T1 of infarctendo was not different than that of blood pool in transmural infarctions (P = 0.74), which also was the case for infarct vs. blood pool in non-transmural infarcts (P = 0.91). Although the MVO ROIs were placed within the infarcted territory, these areas demonstrated very different contrast kinetics than the rest of the myocardium with decreasing T1 values during the imaging period, consistent with very slowly increasing gadolinium enhancement. At 20 min, there was still a significant difference in the T1 of MVO compared with infarctendo (P = 0.007).
The influence these differences in gadolinium kinetics had on the extent of LGE in these distinctly different areas of myocardium is illustrated in Figure 5 for a patient with a non-transmural infarction and Figure 6 for a patient with transmural infarction.

T1 maps and synthetic LGE images in a patient with non-transmural infarction. At 4 min, the LGE abnormality appears transmural which changes to subendocardial at 15 and 20 min. Post-contrast T1 maps (upper row) after contrast administration and synthetic LGE images (bottom row). Synthetic LGE images are generated from MOLLI T1 data on a pixel-by-pixel basis and displayed at the optimal inversion time to null normal myocardium.
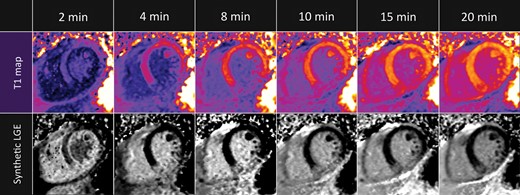
T1 maps and synthetic LGE in a patient with transmural infarction. The extent of LGE is constant throughout the entire imaging period. T1 maps (upper row) and synthetic LGE images (bottom row).
ECV calculation
Figure 7 depicts the calculated ECV as a function of time in the different myocardial regions. Since ECV is an equilibrium measurement, the time points closest to a plateau most safely represent an ECV estimate. Since all regions except MVO reached a plateau by 15 min, this time point was selected for statistical comparisons.
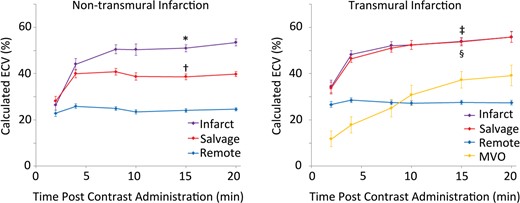
Calculated ECV in infarcted, salvaged, and remote myocardium. Pseudo steady state was reached for most areas of myocardium between 8 and 15 min except for regions of MVO. The ECV of salvaged myocardium is significantly different from both remote and infarcted myocardium in non-transmural infarctions. Data presented as mean ± 1 SEM. *P < 0.001 infarct vs. salvage, †P < 0.001 salvage vs. remote. ‡P > 0.05 infarctendo vs. infarctepi. §P < 0.001 infarctendo vs. remote and infarctepi vs. remote.
In non-transmural infarctions 15 min post-contrast, the ECV of infarcted myocardium was greater than salvaged myocardium (50.5 ± 6.0 vs. 39.5 ± 5.8%, P < 0.001). Salvaged myocardium also had a significantly greater ECV than remote myocardium (39.5 ± 5.8 vs. 24.1 ± 3.1%, P < 0.001). The mean difference in ECV between salvaged and remote myocardium was 14.6 ± 3.7%. In transmural infarctions, there was no difference between infarctendo and infarctepi at 15 min (54.0 ± 7.3 vs. 53.7 ± 7.9%, P = 1.0), but both were greater than remote myocardium (27.6 ± 4.6%, P < 0.001 for both comparisons).
Discussion
Quantification of myocardial gadolinium kinetics is now feasible in patients with recent myocardial infarction and these measurements provide objective evaluations of early vs. LGE of infarcted and salvaged myocardium. This study demonstrates the importance of acquiring gadolinium-enhanced images of AMI late after contrast administration to avoid overestimating the extent of non-transmural infarctions. These experiments provide two mechanisms for overestimation of infarct size by early gadolinium-enhanced images: expansion of the extracellular space (oedema) and differential wash-in/wash-out kinetics between salvaged and infarcted myocardium.
We found no difference between the T1 of infarcted and salvaged myocardium at 4 min in non-transmural infarctions, which explains why these two areas appear enhanced on T1-weighted images at an early time point. Conversely, after 8 min, there was a significant difference in the T1 of infarcted and salvaged myocardium.
Matsumoto et al.15,16 reported that the size of gadolinium enhancement myocardium when imaged 2 min after contrast administration correlated well with the size of the area at risk as determined by T2-weighted imaging. Furthermore, the size of myocardium that displayed early gadolinium enhancement was greater than the size of gadolinium enhancement at 20 min, a finding confirmed by the present study.
The importance of timing in image acquisition was previously addressed in preclinical experiments by Oshinski et al.,14 as they reported that early gadolinium enhancement overestimated infarct size but accurately represented infarct size ∼20–30 min post-contrast.14 This concept is important clinically, as obtaining gadolinium-enhanced images too early can lead to acute infarct size overestimation. Some studies started gadolinium-enhanced imaging in the first 10 min.11 This appears to be too early to accurately quantify the size of non-transmural infarctions and may partially explain why LGE in AMI has limited prognostic value.
Another important finding was that the ECV in salvaged myocardium was significantly different from both remote and infarcted myocardium. This is in line with the preclinical study by Arheden et al. in which the ECV of the entire area at risk in reperfused AMI was less than that of the infarct core and greater than remote myocardium.19 However, an earlier preclinical study could not detect a difference in the gadolinium concentration in reversibly injured myocardium in a rabbit model of ischaemia compared with remote myocardium.20 This may be due to the sensitivity of the technique used. The lower detection threshold of the electron probe X-ray microanalysis was ∼17% of the remote region and could have missed the 14.6% difference seen in this study. Similar to earlier preclinical studies,19,21,22 we also found a significant difference between the ECV of infarcted and remote myocardium. An increase in the partition coefficient of gadolinium in acutely infarcted myocardium compared with normal myocardium was also reported by Flacke et al.23 in a clinical study of AMI using a Look-Locker sequence, in agreement with our findings.
Preclinical studies have described an overestimation of infarct size by LGE compared with histopathology.13,24,25 Similarly, in patients with AMI, the size of LGE myocardium and degree of transmurality decrease during infarct healing.11,26,27 Sectors with a high degree of LGE transmurality have also shown evidence of functional recovery.8,11,28,29 In addition to resolution of oedema, infarct healing and myocardial remodelling also play an important role in the functional recovery in these clinical studies.
How long gadolinium enhancement of the salvaged myocardium is detectable after infarction is not yet known, though substantial ‘fading’ happens in the first days in a canine model.30 Although there is ample evidence to suggest that LGE accurately depicts chronically infarcted myocardium, the simplified statement that ‘bright is dead’ does not accurately reflect the complex interplay between gadolinium kinetics and the pathophysiology of AMI.
Limitations
Partial volume effects may have influenced our results due to a mixture of myocardium species in each voxel. Despite this, contrast kinetics in the salvaged myocardium are clearly different than in remote and infarcted myocardium. Furthermore, the same type of images used to determine that early gadolinium enhancement overestimates infarct size at 5 min were able to separate the patient groups at 20 min with respect to time from symptoms to reperfusion, peak troponin, and probability of having MVO. In-homogeneities of the B1 and/or B0 field can cause biases in T1 measurements,31 but the spatial variation is typically <5% and thus less than the reported differences between infarct or salvage and remote myocardium.
We defined MVO as areas of hypoenhancement at 15 min, and these pixels were excluded from the infarct ROI. However, smaller areas of MVO may be interspersed within the infarct. Similarly, the salvage ROI was carefully placed so as not to include the infarct. We chose to define the salvaged myocardium as epicardial to the infarct to minimize ‘edge effects,’ a method used by Reimer and Jennings.32 Infarcted myocardium was defined by LGE imaging ∼15 min post-contrast, which still may overestimate the size of the infarction. A follow-up CMR scan was not available in these patients.
The timing of image acquisition after administration of the bolus was done as accurately as possible, but minor discrepancies (within a minute or two) may have occurred. With the exception of MVO areas, pseudo steady state was achieved between ∼8 and 20 min.
In conclusion, with novel T1 quantification of the myocardium, we were able to show that acutely infarcted, salvaged, and remote myocardium exhibit different contrast dynamics in human AMI. The most important clinical implication of these findings is that infarct size is overestimated early after contrast administration in non-transmural infarctions. This is largely due to the greater ECV of salvaged myocardium compared with remote.
Funding
This work was supported by the Intramural Research Program of the National Heart, Lung, and Blood Institute, National Institutes of Health, USA (Z01 HL006136-03 and HL004607-15). Funding to pay the Open Access publication charges for this article was provided by the Division of Intramural Research, NHLBI, National Institutes of Health.
Acknowledgements
The authors thank Jennifer Henry, Peg Lowery, and Luis Rosario for help and support in patient coordination. We also thank the patients for their participation in the study.
Conflict of interest: A.E.A. is a principal investigator on a US government Cooperative Research and Development Agreement with Siemens Medical Solutions (HL-CR-05-010).
References
Author notes
Institution where work was performed: Laboratory for Advanced Cardiovascular Imaging, National Heart, Lung, and Blood Institute, National Institutes of Health, Department of Health and Human Services, Bethesda, MD, USA.
