


Abstract
The aim of our study was to assess the two-dimensional carotid strain as an index of arterial stiffness in a population of patients without carotid atherosclerotic plaques.
Two-dimensional carotid strain, carotid intima–media thickness (CIMT), stiffness index (β), Peterson's elastic modulus, and distensibility coefficient were evaluated in 47 patients. For all patients, cardiovascular risk scores were calculated. Peak systolic circumferential strain was significantly correlated with conventional indices of arterial stiffness and with the CIMT. Peak systolic circumferential strain adjusted for pulse pressure was the only parameter that showed a significant difference between the three cardiovascular risk groups in which patients were classified. Two-dimensional carotid strain showed an excellent reproducibility.
The two-dimensional strain allows the assessment of carotid arterial mechanics. Probably the assessment of arterial stiffness allows a better risk stratification of patients.
Carotid atherosclerosis is correlated with the presence of atherosclerotic lesions in other vascular beds, including the coronary circulation. Both carotid intima–media thickness (CIMT) and various indices of arterial stiffness are associated with coronary atherosclerosis, the risk of stroke, and cardiovascular mortality.1–3 Arterial stiffness can be assessed non-invasively, from the measurement of maximum and minimum diameters of the vessel by B-mode and M-mode ultrasound or by using special software or equipment.4 In recent years, the speckle-tracking technique has enabled the assessment of myocardial deformation using two-dimensional strain.5 This technique identifies acoustic tissue markers, the speckles, in a two-dimensional, greyscale ultrasound image, tracked, frame by frame, during the cardiac cycle. This allows for angle-independent viewing of the myocardial speed, and the extent of myocardial deformation, derived from the relative movement (strain) and speed of movement (strain rate) of the speckles.6,7 The aim of our study was to evaluate the feasibility of assessment of arterial mechanics by two-dimensional strain, derived from speckle tracking, and whether this parameter can be an alternative or complementary to evaluation of the conventional vascular stiffness parameters and the CIMT in carotid arteries study aimed at cardiovascular risk stratification.
Methods
The study was conducted on 47 patients undergoing echo-colour Doppler examination of carotid arteries. The data regarding cardiovascular risk factors were collected from the patient's history and by clinical evaluation and review of blood test results carried out by no later than 30 days. The cardiovascular risk factors were defined as follows: hypertension for blood pressure>140/90 mmHg in three serial measurements or current anti-hypertensive therapy; hypercholesterolaemia for total cholesterol >220 mg/dL or statin therapy; diabetes for fasting blood glucose >126 mg/dL or oral hypoglycaemic therapy or insulin; and smoking habits in the case of habitual use of cigarettes and smoking cessation for <12 years. The medication taken was not interrupted before the study. Exclusion criteria were: presence of atrial fibrillation, prior cerebrovascular and cardiovascular events, and evidence of atherosclerotic carotid plaque. On the basis of the data collected, an individual cardiovascular risk score was calculated, according to the method recommended for the Italian population by the Institute of Health (the CUORE Project individual score). Using eight cardiovascular risk factors (age, sex, diabetes, cigarette smoking, systolic blood pressure, total cholesterol, high-density lipoprotein cholesterol, and intake of anti-hypertensive therapy), this score allows one to estimate the probability of experiencing a first major cardiovascular event (myocardial infarction or stroke) within 10 years, based on predictive models developed with the longitudinal studies of CUORE Project8 (http://www.cuore.iss.it/sopra/calc-rischio. asp). The CUORE Project predictive equation showed better accuracy than Framingham Heart Study and PROCAM study equations for the Italian population.9 The images were acquired by experts in carotid imaging, using a Vivid 7 ultrasound system (GE Medical System), equipped with a 7.5–10 MHz linear probe. Once an electrocardiogram (ECG) trace was obtained, images of the long axis of the common carotid arteries (CCA) up to the carotid bulb, optimizing the visualization of the intima–media complex in diastole, cine loops of three cardiac cycles of long axis of the CCA, and cine loops of three cardiac cycles of short axis of the CCA, immediately before the carotid bulb, were acquired for each patient, at a frame rate >70 frames/s. All acquisitions were performed during short breath-holding, to minimize the presence of motion artefacts. All examinations were stored digitally in RawDICOM format. Left upper limb systolic (Ps) and diastolic (Pd) blood pressures were measured by an automatic system, after 5 min of being in the supine position. The temperature was maintained at 22°C during the execution of each examination. Data analysis was performed off-line on a workstation equipped with dedicated software (EchoPac PC, GE Vingmed Ultrasound). The measurement of the CIMT was performed bilaterally on the images of the long axis of the CCA, immediately before the carotid bulb, using a semi-automatic calculation system, with assessment of the average CIMT over a distance of 2 cm in length along the medial wall of the vessel. The strain analysis was performed on cine loops of short axis of the CCA, bilaterally, using a speckle-tracking algorithm. A region of interest (ROI) was traced manually along the intima–blood interface. Considering the small thickness of the vascular wall in comparison with the cardiac walls, the width of the ROI was reduced to the minimum allowed by the software. The appropriate tracking of the vessel walls was checked both visually by the operator or automatically by the software. The average peak systolic circumferential strain along the whole circumference of the short axis blood vessel was considered. During systole, positive values were assumed due to the distension of the vessel walls. Figure 1 shows an example of an assessment of carotid strain by speckle tracking. Whereas the pulse pressure (PP), defined as Ps−Pd, certainly plays an important role in vascular wall distensibility at the same arterial stiffness, the value of strain adjusted for the PP, expressed as strain/PP, was also considered. An M-mode trace perpendicular to the vessel walls, immediately before the carotid bulb, was obtained from the cine loops of the long axis of the CCA, bilaterally. The maximum vessel diameter (Ds), identified at or immediately after the level of the T-wave on the ECG trace, and the minimum diameter (Dd), corresponding to the R-wave on the ECG trace, were measured. The conventional parameters measured to evaluate the mechanical properties of carotid arteries were: stiffness index (β)4 = ln (Ps/Pd)/[(Dd−Ds)/(Dd)], Peterson's elastic modulus (Ep)4= [(Ps−Pd) Dd]/(Dd−Ds), and distensibility coefficient (DC)4 = (Ds–Dd)/[(Ps−Pd) Dd]. Measurements of both the strain and the diameters of CCA were performed twice by the same operator in 30 patients, to assess the intra-observer variability; on the same 30 patients, the measurements of the strain and the CCA diameters were carried out double-blind by two different operators in order to assess the inter-observer variability.
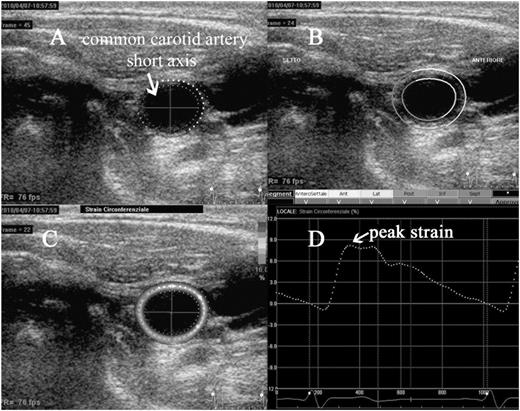
An example of evaluation of carotid circumferential strain. Short axis of the common carotid artery, immediately before the carotid bulb. The region of interest (ROI) is manually drawn along the intima–blood interface, with subsequent adjustment of the width of the region of interest (A); the software automatically checks the appropriate tracking along segments in which the region of interest is divided (B); is then performed the calculation of the strain, that appears in colour scale at the level of ROI, according to the degree of distension of the vessel during systole (C); is then displayed a curve of average strain along the region of interest during the cardiac cycle, with the possibility to measure the peak systolic value (D).
Statistical analysis
For each patient, the CIMT, peak systolic circumferential strain, β, Ep, and DC were calculated as average values of the right and left CCA. The correlation between parameters was assessed using the Pearson correlation coefficient (r). Patients were divided into tertiles using the cardiovascular risk score, IMT, and each parameter of arterial stiffness to get three numerically comparable groups for each parameter. According to the cardiovascular risk score, patients were divided as low-risk (first tertile, 16 patients), intermediate risk (second tertile, 15 patients), and high-risk (third tertile, 16 patients). According to each parameter of arterial stiffness and IMT, patients were classified into three groups: 16 patients with mild vascular involvement (first tertile for IMT, β, and Ep; third tertile for peak systolic circumferential strain and DC), 15 patients with moderate vascular involvement (second tertile for all parameters), and 16 patients with hard vascular involvement (third tertile for IMT, β, and Ep; first tertile for peak systolic circumferential strain and DC). Within each group of the cardiovascular risk score, the classification of vascular involvement, according to tertiles of the IMT and arterial stiffness parameters, was assessed. The comparison of the parameters between the three risk groups was performed by independent samples t-test, with a Welch correction test when unequal variance between groups was observed. All the data fit a normal distribution according to the Kolmogorov–Smirnov test, both in the overall population and in the three cardiovascular risk groups. Assessment of inter-observer and intra-observer variability was carried out by calculating the concordance correlation coefficient (ρc) and the inter-rater agreement statistic (K). On the basis of the values of K, reproducibility of measurements was considered poor (K < 0.20), fair (K = 0:21–0:40), moderate (K = 0.41–0.60), good (K = 0.61–0.80), or very good (K > 0.81).10 The statistical significance test was considered as a P-value of < 0.05.
Results
Of the 47 patients, 21 were women and 26 were men; mean age 57 ± 13 years. The general characteristics of the studied population are shown in Table 1. A good distribution of cardiovascular risk factors was observed. The three cardiovascular risk groups were defined as follows: low-risk group (16 pts with a risk of major cardiovascular events at 10 years of 0.2–3.1%), intermediate-risk group (15 pts with a risk of 5–13%), and high-risk group (16 pts with a 13–41% risk). The strain analysis and assessment of conventional parameters of arterial stiffness were possible in all studied patients. In the strain analysis, none of the segments in which the cross-sectional area of the CCA is automatically divided by the software was excluded because of inadequate tracking, according to verification by the software itself. Both peak systolic circumferential strain and peak systolic circumferential strain/PP were significantly correlated with conventional indices of arterial stiffness and with the CIMT (Table 2). All indices of arterial stiffness and CIMT were significantly correlated with the risk score (Table 3). The evaluation of arterial stiffness parameters and CIMT in the three cardiovascular risk groups showed that: all parameters were significantly different between the low-risk group and the high-risk group; the CIMT, not adjusted peak systolic circumferential strain, peak systolic circumferential/PP, and Ep were significantly different between the low-risk group and the intermediate-risk group; β and DC were not significantly different between the low-risk group and the intermediate-risk group and even between the intermediate-risk group and the high-risk group; the IMT, not adjusted peak systolic circumferential strain, and Ep were not significantly different between the intermediate-risk group and high-risk group; the only parameter that showed a significant difference between the low-risk group and the intermediate-risk group, both among the low-risk group and high-risk group that among the intermediate-risk group and high-risk group was peak systolic circumferential strain/PP (Table 4). The assessment of vascular involvement (defined by the tertile of each parameter of arterial stiffness and IMT) in the three cardiovascular risk groups showed that in a good percentage of patients, it was found that the degree of vascular involvement was not related to risk group membership, as shown in Table 5; in particular, in the group with low cardiovascular risk, a rate of 13–31% of patients (depending on the considered vascular involvement parameter) with moderate vascular involvement, and a rate of 6–13% of patients with marked vascular involvement have been identified; in the high-risk group, 25–44% of patients showed moderate vascular involvement, and 7–19% of patients showed mild vascular involvement; in the intermediate-risk group up to 40% of patients showed marked vascular involvement and up to 40% of patients showed mild vascular involvement. The evaluations of inter-observer and intra-observer variability showed excellent strain measurement reproducibility (intra-observer ρc= 0.99; K = 0.87; inter-observer ρc = 0.98; K = 0.80), compared with only moderate reproducibility of the measurement of conventional arterial stiffness indices, which appeared to overlap reports in other studies11,12 (Figures 2 and 3). The time employed for the acquisition of the images is similar to that used to carry out a routine ultrasonography of the carotid arteries, because the long axis and short axis images of the vessels, needed for off-line analysis, are those commonly acquired. The off-line analysis of bilateral circumferential strain required an average time of 2 min. The measurement of the vessel diameters bilaterally, needed for the calculation of other indices of arterial stiffness, required an average time of 1 min and 40 s.
Characteristics of studied population
| Overall (47 pts) | Low risk (16 pts) | Intermediate risk (15 pts) | High risk (16 pts) | |
|---|---|---|---|---|
| Age | 57 ± 13 | 43 ± 11 | 61 ± 9 | 65 ± 7 |
| Male, n (%) | 26 | 10 (63) | 8 (54) | 8 (50) |
| Female, n (%) | 21 | 6 (37) | 7 (46) | 8 (50) |
| SBP (mean ± SD, mmHg) | 137 ± 22 | 123 ± 14 | 133 ± 19 | 154 ± 21 |
| DBP (mean ± SD, mmHg) | 84 ± 11 | 77 ± 9 | 87 ± 10 | 89 ± 12 |
| Hypertension, n (%) | 28 (59) | 2 (12) | 10 (66) | 16 (100) |
| Dyslipidaemia, n (%) | 20 (42) | 3 (18) | 6 (40) | 11 (68) |
| Diabetes, n (%) | 10 (21) | – | 2 (13) | 8 (50) |
| Smoking, n (%) | 14 (29) | 2 (12) | 5 (33) | 7 (43) |
| ACE-I, n (%) | 6 (12) | – | 3 (20) | 3 (20) |
| ARB, n (%) | 14 (29) | 1 (6) | 5 (33) | 8 (50) |
| β-Blockers, n (%) | 9 (19) | 1 (6) | 2 (13) | 6 (37) |
| Diuretics, n (%) | 7 (15) | – | 3 (20) | 4 (25) |
| CCB, n (%) | 3 (6) | – | 1 (6) | 2 (12) |
| α-Blockers, n (%) | 3 (6) | – | 2 (13) | 1 (6) |
| Statins, n (%) | 10 (21) | 1 (6) | 4 (27) | 5 (31) |
| Cardiovascular risk score [range (%); mean (%) ± SD] | 0.2–3.1; 1.4 ± 1 | 5–13; 8.4 ± 2.8 | 13–41; 24.6 ± 7.8 |
SPB, systolic blood pressure; DBP, diastolic blood pressure; SD, standard deviation; ACE-I, angiotensin-converting enzyme inhibitors; ARB, angiotensin receptor blockers; CCB, calcium channels blockers.
Correlations between peak systolic circumferential strain, carotid intima–media thickness, and conventional parameters of vascular stiffness
| Peak systolic circumferential strain | Peak systolic circumferential strain/PP | |
|---|---|---|
| CIMT | r = −0.52, P < 0.0001 | r = −0.60, P < 0.0001 |
| Β | r = −0.54, P < 0.0001 | r = −0.61, P < 0.0001 |
| Ep | r = −0.56, P < 0.0001 | r = −0.68, P < 0.0001 |
| DC | r = 0.61, P < 0.0001 | r = 0.72, P < 0.0001 |
Peak systolic circumferential strain/PP, peak systolic circumferential strain adjusted for pulse pressure (PP); CIMT, carotid intima–media thickness; β, stiffness index; Ep, Peterson's elastic modulus; DC, distensibility coefficient.
Correlation between arterial stiffness indices and carotid intima–media thickness with risk score
| Peak systolic circumferential strain | Peak systolic circumferential strain/PP | |
|---|---|---|
| CIMT | r = −0.51 | P= 0.0002 |
| Β | r = −0.57 | P< 0.0001 |
| Ep | r = −0.53 | P< 0.0001 |
| CIMT | r = 0.56 | P< 0.0001 |
| Strain | r = −053 | P< 0.0001 |
| Strain/PP | r = −0.68 | P< 0.0001 |
| Peak systolic circumferential strain | Peak systolic circumferential strain/PP | |
|---|---|---|
| CIMT | r = −0.51 | P= 0.0002 |
| Β | r = −0.57 | P< 0.0001 |
| Ep | r = −0.53 | P< 0.0001 |
| CIMT | r = 0.56 | P< 0.0001 |
| Strain | r = −053 | P< 0.0001 |
| Strain/PP | r = −0.68 | P< 0.0001 |
β, stiffness index; Ep, Peterson's elastic modulus; DC, distensibility coefficient; Strain, peak systolic circumferential strain; Strain/PP, peak systolic circumferential strain adjusted for pulse pressure (PP).
Carotid intima–media thickness and arterial stiffness parameters values in patients divided by risk score
| Average value for the entire population | Low risk (n = 16) | Intermediate risk (n = 15) | High risk (n = 16) | Low vs. intermediate | Intermediate vs. high | Low vs. high | |
|---|---|---|---|---|---|---|---|
| Risk score [range (%); mean ± SD] | 0.2–3.1; 1.4 ± 1 | 5–13; 8.4 ± 2.8 | 13–41; 24.6 ± 7.8 | P < 0.0001 | P < 0.0001 | P < 0.0001 | |
| CIMT (mean ± SD, mm) | 0.71 ± 0.2 | 0.57 ± 0.12 | 0.72 ± 0.15 | 0.83 ± 0.22 | P = 0.0055 | P = 0.1 | P = 0.0003 |
| Strain (mean ± SD, %) | 3.6 ± 2 | 5.5 ± 2.2 | 2.9 ± 1.2 | 2.4 ± 0.5 | P = 0.0005 | P = 0.16 | P = 0.0001 |
| Strain/PP | |||||||
| (×10−2 mean ± SD, %) | 7.5 ± 4.1 | 11.4 ± 3.3 | 7 ± 3.5 | 4 ± 1.1 | P = 0.0013 | P = 0.0052 | P < 0.0001 |
| β (mean ± SD) | 6.6 ± 3 | 5.2 ± 2.3 | 6.6 ± 2.5 | 8.0 ± 3.4 | P = 0.12 | P = 0.18 | P = 0.009 |
| Ep (kPa) | 735 ± 378 | 513 ± 220 | 739 ± 364 | 954 ± 404 | P = 0.04 | P = 0.13 | P = 0.0009 |
| DC (×10−3 kPa) | 17.9 ± 8.8 | 23.3 ± 9.3 | 17.7 ± 8.5 | 12.6 ± 4.9 | P = 0.09 | P = 0.05 | P = 0.0005 |
CIMT, carotid intima–media thickness; strain, peak systolic circumferential strain; strain/PP, peak systolic circumferential strain adjusted for pulse pressure (PP); β, stiffness index; Ep, Peterson's elastic modulus; DC, distensibility coefficient; SD, standard deviation.
Reclassification of patients divided into three cardiovascular risk groups by assessment of vascular involvement
| Risk group | Reclassification by vascular involvement | Strain | Strain/PP | CIMT | β | Ep | DC |
|---|---|---|---|---|---|---|---|
| High (16 patients) | Hard | 9 pz–56% | 11 pz–69% | 10 pz–62% | 9 pz–56% | 9 pz–56% | 9 pz–56% |
| Moderate | 7 pz–44% | 5 pz–31% | 4 pz–25% | 4 pz–25% | 6 pz–37% | 6 pz–37% | |
| Mild | – | – | 2 pz–13% | 3 pz–19% | 1 pz–7% | 1 pz–7% | |
| Intermediate (15 patients) | Hard | 6 pz–40% | 5 pz–33% | 4 pz–27% | 5 pz–33% | 5 pz–33% | 5 pz–33% |
| Moderate | 5 pz–33% | 5 pz–33% | 9 pz–60% | 6 pz–40% | 4 pz–27% | 5 pz–33% | |
| Mild | 4 pz–27% | 5 pz–33% | 2 pz–13% | 4 pz–27% | 6 pz–40% | 5 pz–33% | |
| Low (16 patients) | Hard | 1 pz–6% | – | 1 pz–6% | 2 pz–13% | 2 pz–13% | 2 pz–13% |
| Moderate | 3 pz–19% | 5 pz–31% | 2 pz–13% | 5 pz–31% | 5 pz–31% | 4 pz–25% | |
| Mild | 12 pz–75% | 11 pz–69% | 13 pz–81% | 9 pz–56% | 9 pz–56% | 10 pz–62% |
Strain, peak systolic circumferential strain; Strain/PP, peak systolic circumferential strain adjusted for pulse pressure (PP); CIMT, carotid intima–media thickness; β, stiffness index; Ep, Peterson's elastic modulus; DC, distensibility coefficient.
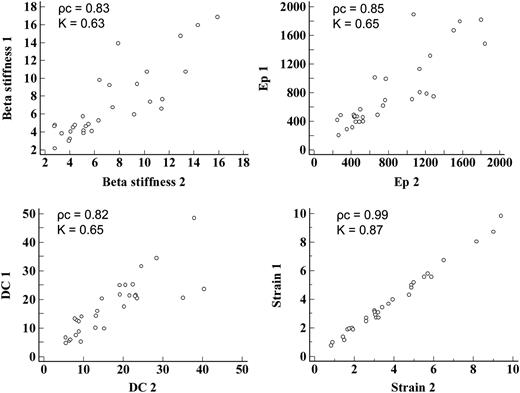
Intra-observer variability of the arterial stiffness parameters. Ep, Peterson's elastic modulus; DC, distensibility coefficient; 1, First measurement of the observer; 2, Second measurement of the observer; ρc, concordance correlation coefficient; K, inter-rater agreement statistic.
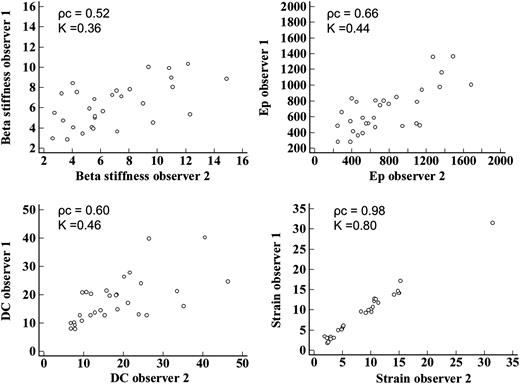
Inter-observer variability of arterial stiffness parameters. Ep, Peterson's elastic modulus; DC, distensibility coefficient; ρc, concordance correlation coefficient; K, inter-rater agreement statistic.
Discussion
This study shows that the two-dimensional strain, evaluated by speckle tracking, represents a usable parameter in evaluation of elastic properties of vascular walls. To our knowledge, only one other study has examined the possibility of using two-dimensional strain for characterization of changes in elastic properties of the carotid arteries according to age in a healthy population, without cardiovascular risk factors.13 Our study shows that the assessment of vascular stiffness, by two-dimensional strain of the carotid arteries, allows to characterize the cardiovascular risk profile in a population of patients with a good distribution of common risk factors, in the absence of detectable atherosclerotic carotid plaques. As in case of equal arterial stiffness, a high pulse pressure should theoretically determine higher strain values, we considered appropriate to adjust the strain values for pulse pressure, considering the peak systolic circumferential strain/PP as a parameter more reliable compared with the strain. In the primary prevention of cardiovascular events, indices that allow for early identification of atherosclerotic vascular disease are required, in order to better assess cardiovascular risk in asymptomatic patients. Evaluation of common risk factors is necessary, but not sufficient to estimate the risk of cardiovascular disease.14 About 40% of the adult population of the USA would have an intermediate risk for developing cardiovascular disease, when assessed using the common algorithms for calculating risk based on the consideration of only the risk factors, and these patients may require additional parameters for better risk stratification.15 The CIMT is one of the parameters frequently used in the non-invasive evaluation of atherosclerotic disease. The CIMT correlates with the degree of carotid atherosclerosis measured at autopsy 16 and with the presence of atherosclerotic vascular disease in other vascular beds.17 Various studies have shown that an increase in the CIMT is predictive of cardiovascular events in asymptomatic patients 18–20 and of the recurrence of events in patients with known cardiovascular disease.21 In recent years great interest has been evinced in the study of arterial stiffness in the stratification of cardiovascular risk. Various parameters of arterial stiffness have been able to predict cardiovascular mortality, coronary events, and stroke.1,2,22–26 The routine non-invasive evaluation of arterial stiffness and the CIMT may be performed for a more precise risk stratification compared with that achieved from common risk score only.27 Several reports suggest that changes in CIMT and arterial stiffness may represent different aspects of atherosclerosis.28–30 Our data show only a moderate correlation between the CIMT and the peak systolic circumferential strain. These data suggest that the measurements of arterial stiffness, in addition to the evaluation of CIMT, could allow a more accurate evaluation of the subclinical phase of the atherosclerotic disease, enabling one to assess the different effects of atherosclerotic disease on the vascular walls, which are not necessarily present at the same time, and allowing an earlier and more accurate identification of the arterial wall involvement, in comparison with the evaluation of the CIMT alone. Among the parameters considered in our study, the peak systolic circumferential strain adjusted for pulse pressure was significantly different in all the three cardiovascular risk groups in which patients were classified; in particular, the peak systolic circumferential strain/PP was the only parameter to differ significantly between the intermediate-risk group and the high-risk group. These data suggest that the assessment of the peak systolic circumferential strain could allow a better stratification of patients in comparison with other arterial stiffness parameters and with the CIMT. In addition, with regard to the assessment of vascular involvement, identified by the study of arterial stiffness and the CIMT, in a good percentage of patients the degree of vascular involvement does not match the degree of cardiovascular risk assessed by traditional risk factors; in particular, patients at intermediate cardiovascular risk, which, in clinical practice, are the group of patients for whom we need a more accurate risk stratification, presented in 27–40% of cases a marked vascular involvement, and in 13–40% of cases a mild vascular involvement. This could mean that those patients considered at intermediate risk of cardiovascular disease could be reclassified as having low or high risk of cardiovascular disease when assessed by the parameter of arterial vascular involvement in addition to the evaluation of the cardiovascular risk score. Unfortunately, to date, assessment of arterial stiffness requires the use of dedicated equipment,4,27 otherwise, when run through the ultrasound study of carotid arteries may be characterized by a less than optimal reproducibility of the measurements.11,12 These limitations have probably prevented the use of the evaluation of arterial stiffness in routine practice. In fact, more accessible and reproducible methods to assess arterial stiffness are of great interest of study.31,32 Our data indicate that the evaluation of carotid two-dimensional strain, derived from speckle tracking, could allow for a routine assessment of arterial stiffness providing excellent reproducibility, sharply higher than conventional indices of arterial stiffness when measured by ultrasound, and it is certainly more readily available than dedicated equipment for the study of arterial stiffness parameters.
Study limitations
The first limitation of the study is represented by the small number of patients. There was still a good distribution of cardiovascular risk factors in the population studied. Patients with atrial fibrillation, in which the pulse pressure is different depending on the length of the cardiac cycle, were not considered; the reliability of the assessment of carotid strain in this population cannot be assumed. The evaluation of patients was performed without interruption of drug therapy that may interact with arterial stiffness, although this very much reflects the clinical reality. Finally, the correlation of the CIMT and arterial stiffness parameters with the cardiovascular risk score and not with the actual cardiovascular events was considered. It would be appropriate to obtain follow-up data regarding the number of cardiovascular events in relation to the CIMT and carotid arterial stiffness parameters on a wider patient population.
Conclusions
The two-dimensional strain derived from speckle tracking allows the evaluation of carotid artery mechanics with good reproducibility of the measurements. Furthermore, being a method implemented on a common echocardiographic system, it could permit the routine assessment of arterial mechanics. Probably the assessment of arterial involvement allows a better risk stratification of patients compared with the assessment of the cardiovascular risk score alone. This is particularly important in the population of patients at intermediate risk identified by the assessment of traditional risk factors alone. Studies on large populations will be necessary to demonstrate the ability of carotid strain to predict cardiovascular events.
Conflict of interest: none declared.
