


While preclinical studies suggest that mitochondria play a pivotal role in ischaemia–reperfusion injury, the knowledge of mitochondrial function in human out-of-hospital cardiac arrest remains scarce. The present study sought to compare oxidative phosphorylation capacity in skeletal muscle biopsies from out-of-hospital cardiac arrest patients to healthy controls.
This was a substudy of a randomised trial comparing targeted temperature management at 33°C versus 36°C for out-of-hospital cardiac arrest patients. Skeletal muscle biopsies were obtained from adult resuscitated comatose out-of-hospital cardiac arrest patients 28 hours after initiation of targeted temperature management, i.e. at target temperature prior to rewarming, and from age-matched healthy controls. Mitochondrial function was analysed by high-resolution respirometry. Maximal sustained respiration through complex I, maximal coupled respiration through complex I and complex II and maximal electron transport system capacity was compared.
A total of 20 out-of-hospital cardiac arrest patients and 21 controls were included in the analysis. We found no difference in mitochondrial function between temperature allocations. We found no difference in complex I sustained respiration between out-of-hospital cardiac arrest and controls (23 (18–26) vs. 22 (19–26) pmol O2/mg/s, P=0.76), whereas coupled complex I and complex II respiration was significantly lower in out-of-hospital cardiac arrest patients versus controls (53 (42–59) vs. 64 (54–68) pmol O2/mg/s, P=0.01). Furthermore, electron transport system capacity was lower in out-of-hospital cardiac arrest versus controls (63 (51–69) vs. 73 (66–78) pmol O2/mg/s, P=0.005).
Mitochondrial oxidative phosphorylation capacity in skeletal muscle biopsies was reduced in out-of-hospital cardiac arrest patients undergoing targeted temperature management compared to age-matched, healthy controls. The role of mitochondria as risk markers and potential targets for post-resuscitation care remains unknown.
Introduction
The high mortality after successful resuscitation from out-of-hospital cardiac arrest (OHCA) is attributed to a post-cardiac arrest syndrome,1 which is caused by periods of ischaemia and re-perfusion injury during OHCA and after return of spontaneous circulation (ROSC).
Preclinical studies suggest that mitochondria are pivotal components of ischaemia and reperfusion injury, both as targets and effectors.2,,,–6 Primary functions of the mitochondria are the generation of energy in the form of adenosine tri-phosphate (ATP) by oxidative phosphorylation through the electron transport chain, as well as the initiation of programmed cell death, apoptosis;7 and both processes are suggested to be affected by ischaemia and reperfusion. In addition, mitochondria play a role in fatty acid oxidation, production of free radicals, and Ca2+-homeostasis.8,,–11 Despite the suggested associations between ischaemia/reperfusion injury and mitochondrial function, the knowledge on these associations in OHCA patients remains scarce.
In animal models, ischaemia and reperfusion injury has been associated with impaired oxidative phosphorylation in cardiomyocytes.10,–12 In humans, higher serum levels of markers of mitochondrial injury, including cytochrome C and mitochondrial DNA, in cardiac arrest patients versus healthy controls, and higher levels in non-survivors versus survivors after cardiac arrest have been demonstrated.13,–15 The relationship between OHCA and oxidative phosphorylation in humans remains unknown.
The primary objective of the present study was to compare oxidative phosphorylation capacity in skeletal muscle tissue biopsies from OHCA patients compared to healthy controls. The secondary objective was to assess possible associations between mitochondrial respiration, markers of post-cardiac arrest syndrome severity, compromised haemodynamics and markers of organ injury/dysfunction in OHCA patients. To our knowledge, this is the first study to assess mitochondrial respiration pathways in OHCA.
Methods
The present study is a prospective observational substudy of a randomised clinical trial comparing adult comatose OHCA patients from a single tertiary heart centre to healthy controls.
OHCA patients
All OHCA patients were participants of the TTM trial,16 and were randomly assigned in a 1:1 ratio to either targeted temperature management (TTM) at 33°C or 36°C under sedation for a minimum of 24 hours. Patients included in the trial were resuscitated from OHCA from a presumed cardiac cause with sustained ROSC for more than 20 minutes, and a Glasgow coma score below 9. Prehospital data were systematically collected according to the Utstein guidelines.17 The full treatment protocol has been published previously.18
Muscle biopsies were obtained from the femoral muscle (vastus lateralis) 28 hours after initiation of TTM, i.e. at target temperature prior to rewarming, and kept in cold buffer until analysed. Simultaneously, an arterial blood gas was drawn and analysed for partial pressure of oxygen (PaO2), partial pressure of carbon dioxide (PaCO2), blood glucose level, lactate level and pH value. In addition, blood was drawn from a pulmonary artery catheter and analysed for central venous oxygen saturation (SvO2). Biomarkers of organ damage/function were systematically collected 24 hours, 48 hours and 72 hours after admission, including troponin T (TnT), creatinine and neuron-specific enolase (NSE).
Prior to inclusion, informed consent from patients’ next of kin was obtained. Furthermore, informed consent was obtained from each patient’s general practitioner, and from patients regaining consciousness. The ethics committee of the Capital Region Copenhagen approved the study (protocol H-1-2010-059), and the study was conducted in accordance with the Helsinki Declaration.19
Healthy controls
The age-matched healthy controls of this study were part of a longitudinal study to investigate the effect of high-intensity interval training on insulin sensitivity.20 Included control samples were obtained at baseline prior to any intervention. All controls provided written informed consent prior to enrollment, and muscle biopsies were obtained from the femoral muscle (vastus lateralis). The ethics committee of the Capital Region Copenhagen approved the study (protocol H-3-2012-024).
Laboratory testing
We included the following components of mitochondrial function in our analysis of both OHCA and healthy controls: maximal mitochondrial respiratory capacity through complex I (NADH dehydrogenase, CI), maximal coupled mitochondrial respiratory capacity through complex I and II (succinate dehydrogenase, CI+II), and maximal electron transport system (ETS) capacity. In addition, for OHCA patients only, we analysed the Michaelis–Menten constant for creatine kinase (Kmck) with versus without the addition of creatine (substrate). The delta-Kmck value for added creatine versus no added creatine (delta-Kmck = Kmck (without creatine) – Kmck (with creatine)) was used as a marker of creatine kinase function. In addition, the flux control ratio was calculated as CI+II/ETS × 100%21 as a marker of the degree of electron transport system coupling.
High-resolution respirometry was applied to measure mitochondrial oxygen consumption (JO2) expressed as picomoles oxygen per milligram of wet weight per second (pmol O2/mg/s). Approximately 2 mg from each biopsy was prepared for respirometry using permeabilised fibre technique.22 The separation of muscle fibres was done by mechanical dissection with sharp forceps. All respiratory measurements were carried out in duplicate after hyperoxygenation to avoid any potential oxygen limitation to respiration. Two different substrate and inhibitor protocols were employed in two high-resolution respirometers (Oxygraph 2k; Oroboros Instruments, Innsbruck, Austria), at 37°C. Data acquisition and analyses were performed using DatLab software (Oroboros Instruments, Innsbruck, Austria). The dissected tissue was permeabilized by gentle agitation for 30 minutes at 0°C in a resting buffer solution (BIOPS) supplemented with 50 μg/ml saponin and then washed in ice-cold respiration medium (Mir05) 2 × 10 minutes during gentle agitation. Mir05 consisted of 110 mmol/l sucrose, 60 mmol/l K-lactobionate, 0.5 mmol/l ethylene glycol tetraacetic acid (EGTA), 1 g/l bovine serum albumin (BSA) essentially fatty acid free, 3 mmol/l MgCl2, 20 mmol/l taurine, 10 mmol/l KH2PO4, 20 mmol/l K HEPES at pH 7.1. The oxygen solubility of Mir05 was set to 10.5 mM/kPa. Prior to respirometry, muscle specimens were blotted on filter paper and weighed (Mettler Toledo xs105, Ohio, USA). Two respirometry protocols were performed on two different specimens. Both protocols were carried out in duplicate, and one (protocol A) was carried out both in the presence and absence of creatine, 20 mmol/l (all concentrations are final concentrations in the respiratory chamber). In both protocols, we defined baseline respiration as respiration without the addition of exogenous substrates or adenosine diphosphate (ADP) (baseline). This state was followed by the addition of malate (5 mmol/l) and glutamate (10 mmol/l) (protocol A). Maximal state 3 respiration was reached after titration of ADP (0.05, 0.10, 0.25, 0.35, 0.50, 1.0, 2.5, and 5.0 mmol/l) (state GM3). The integrity of the outer mitochondrial membrane was then tested by the addition of cytochrome C (10 μmol/l). With the subsequent addition of succinate (10 mmol/l), complex I+ II sustained respiration was assessed (state GMS3 – maximally coupled respiration). Oxygen flux was corrected for chemical as well as for instrumental background.
Maximal ETS respiration was assessed in protocol B, by adding a ionophore, carbonylcyanide-4-trifluoromethoxy-phenylhydrazone (FCCP) in steps of 0.25 μmol l−1 until maximal uncoupled respiration was achieved. Uncoupling was measured on top of maximal coupled respiration.
Michaelis–Menten (KM) values for the ADP titration response were obtained by enzyme kinetics regression of the substrate titration curves (Sigma-Plot, v 11.0; Systat Software Inc., San Jose, CA, USA).
Statistical analyses
Descriptive statistics were used for comparison of the populations (Table 1, Figure 1). Categorical variables are presented as counts (frequencies), and continuous variables are presented as mean (standard deviation) if normally distributed, or median (25th–75th percentile) if non-normally distributed. Comparisons between groups were performed with the chi-square test or Fisher’s exact test, as appropriate, for categorical variables, and with Wilcoxon’s rank sum test for continuous variables. To compare two continuous variables, we applied general linear regression models and presented the resulting estimates with 95% confidence intervals. Parameters were logistically transformed as appropriate to approximate normal distribution prior to analysis. All analyses were two sided with a significance level of 0.05.
Baseline characteristics.
| Out-of-hospital cardiac arrest | Healthy controls | P value | ||
|---|---|---|---|---|
| n=20 | n=21 | |||
| Age, years | Mean±SD | 63±16 | 63±5 | 0.58 |
| Male sex | n (%) | 17 (85) | 11 (52) | 0.02 |
| BMI | Mean±SD | 27±5 | 31±3 | 0.001 |
| Cardiac arrest characteristics | ||||
| Witnessed arrest | n (%) | 20 (100) | − | − |
| Bystander CPR | n (%) | 15 (75) | − | − |
| Shockable primary rhythm | n (%) | 17 (85) | − | − |
| Time to ROSC, min | Median (IQR) | 25 (14–41) | − | − |
| Lactate on admission | Median (IQR) | 3.0 (2.1–5.7) | − | − |
BMI: body mass index; CPR: cardiopulmonary resuscitation; ROSC: return of spontaneous circulation; IQR: interquartile range.
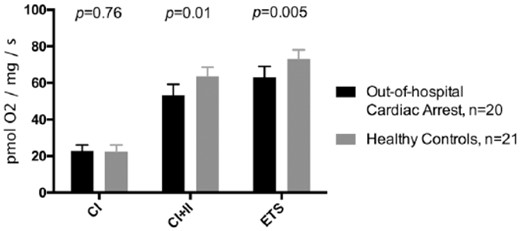
Median maximal mitochondrial respiration through complex I (CI), through complex I+II (CI+II), and total uncoupled electron transport system (ETS) capacity.
Results
Population
A total of 20 patients admitted after OHCA and 21 healthy controls were included. Compared to controls, a higher percentage of OHCA patients were men (85% vs. 52%, P=0.02) and OHCA patients had a significantly lower body mass index (BMI) (27±5 vs. 31±3, P=0.001) (Table 1).
In the combined group of OHCA and controls, maximal coupled mitochondrial respiration through CI+II was 58 (47–64) pmol O2/mg/s in men versus 58 (50–65) pmol O2/mg/s in women (P=0.90). BMI was not associated with maximal coupled mitochondrial respiration through CI+II (estimate −0.13 (−1.0−0.78) pmol O2/mg/s per one BMI increase, P=0.78).
Targeted temperature management at 33°C versus 36°C
Between patients treated with TTM at 33°C compared to 36°C, we found no difference in CI sustained respiration (23 (17–27) pmol O2/mg/s vs. 23 (20–24) pmol O2/mg/s, P>0.99), maximal coupled CI+II respiration (53 (39–60) pmol O2/mg/s vs. 58 (46–59) pmol O2/mg/s, P=0.54), or maximal ETS capacity (55 (48–64) pmol O2/mg/s vs. 63 (63–69) pmol O2/mg/s, P=0.09). Furthermore, we found no difference in delta-Kmck between 33°C versus 36°C (0.09 (0.005–0.11) vs. 0.09 (0.009–0.36), P=0.47).
Oxidative phosphorylation in OHCA and controls
The maximal mitochondrial coupled respiration through CI was similar in OHCA patients versus controls (23 (18–26) vs. 22 (19–26) pmol O2/mg/s, P=0.76, Figure 1), whereas the maximal mitochondrial coupled respiration through CI+II was significantly lower in OHCA patients versus controls (53 (42–59) vs. 64 (54–68) pmol O2/mg/s, P=0.01, Figure 1). Furthermore, the maximal uncoupled ETS capacity was significantly reduced in OHCA patients compared with controls (63 (51–69) vs. 73 (66–78) pmol O2/mg/s, P=0.005, Figure 1). The median flux control ratio was 86% (80–89%) in OHCA patients versus 88% (81–92%) in controls (P=0.66).
Associations between post-cardiac arrest syndrome severity, inflammatory response and mitochondrial function in OHCA
We found no significant associations between time to ROSC and maximal CI+II respiration or maximal uncoupled ETS capacity (P=0.58, P=0.49, respectively). In addition, we found no significant associations between lactate concentrations in blood (P=0.34, P=0.11), cardiovascular SOFA score (P=0.31, P=0.26), or cardiac index (P=0.25, P=0.46) at time of randomisation versus CI+CII respiration and maximal uncoupled ETS capacity, respectively (data not shown). Finally, we found no significant associations between inflammatory markers including C-reactive protein (P=0.07, P=0.53), procalcitonin (P=0.16, P=0.40), interleukin (IL)-1b (P=0.70, P=0.20), or IL-6 (P=0.70, P=0.60) versus maximal CI+II respiration and maximal uncoupled ETS capacity, respectively (data not shown).
Associations between haemodynamic function and mitochondrial function in OHCA
At time of biopsy sampling, the median cardiac index was 2.0 (1.6–2.6) L/min/m2, arterial lactate was 1.3 (1.0–1.5) mmol/L, SvO2 was 75 (74–79)%, PaO2 was 12 (10–14) KPa and PaCO2 was 5.1 (4.5–5.4) KPa.
There was a significant association between higher PaO2 and CI respiration (estimate 1.4 (0.11–2.7) pmol O2/mg/s per kPa, P=0.03), and a non-significant association between higher PaO2 and CI+II respiration (estimate 2.9 (–0.04–5.9) pmol O2/mg/s per kPa, P=0.05). In addition, a higher PaO2 was associated with a significantly lower delta-Kmck (delta-Kmck, estimate −0.46 (−0.87 to −0.06), P=0.03). A higher PaCO2 was significantly associated with a higher ETS capacity (estimate 8.1 (2.3–14) pmol O2/mg/s per KPa, P=0.009). We found no other associations between markers of compromised perfusion and mitochondrial function (Table 2).
Associations between haemodynamics and mitochondrial function at time of biopsy sampling in OHCA patients.
| Mitochondrial function | Haemodynamics | Estimate (95%CI) | P value |
|---|---|---|---|
| CI (pmol O2/mg/s) | Cardiac index (L/min/m2) | 0.55 (–3.5–4.6) | 0.78 |
| Arterial lactate (mmol/L) | −1.6 (–5.9–2.7) | 0.44 | |
| SvO2 (%) | 0.06 (−0.56−0.68) | 0.84 | |
| Arterial PaO2 (KPa) | 1.4 (0.11–2.7) | 0.03 | |
| Arterial PaCO2 (KPa) | −2.6 (−6.0−0.75) | 0.12 | |
| CI+II (pmol O2/mg/s) | Cardiac index (L/min/m2) | 6.98 (−1.86−16) | 0.11 |
| Arterial lactate (mmol/L) | −3.7 (−14−6.1) | 0.43 | |
| SvO2 (%) | 0.75 (−0.61−2.1) | 0.26 | |
| Arterial PaO2 (KPa) | 2.9 (−0.04−5.9) | 0.05 | |
| Arterial PaCO2 (KPa) | −3.7 (−12−4.4) | 0.35 | |
| ETS capacity (pmol O2/mg/s) | Cardiac index (L/min/m2) | 5.1 (−3.2−13) | 0.21 |
| Arterial lactate (mmol/L) | −7.4 (−16−1.5) | 0.10 | |
| SvO2 (%) | −0.63 (−1.8−0.55) | 0.27 | |
| Arterial PaO2 (KPa) | −0.51 (−3.3−2.3) | 0.71 | |
| Arterial PaCO2 (KPa) | 8.1 (2.3–14) | 0.009 | |
| Delta-Kmcka | Cardiac index (L/min/m2) | 0.79 (–0.71–2.3) | 0.27 |
| Arterial lactate (mmol/L) | 0.44 (−1.03−1.9) | 0.52 | |
| SvO2 (%) | −0.04 (−0.28−0.19) | 0.71 | |
| Arterial PaO2 (KPa) | −0.46 (−0.87– −0.06) | 0.03 | |
| Arterial PaCO2 (KPa) | 0.74 (−0.26−1.7) | 0.13 |
Logarithmically transformed to approximate normal distribution.
CI: complex I; CII: complex II; SvO2: venous oxygen saturation; PaO2: partial pressure of oxygen; PaCO2: partial pressure of carbon dioxide; ETS: electron transport system.
Associations between markers of organ damage and mitochondrial function in OHCA
After 24 hours from admission, the median TnT concentration was 2.0 (0.62–7.3) ng/mL, and the median creatinine concentration was 1.1 (0.75–1.6) mg/dL. After 48 hours from admission, the median NSE concentration was 25 (18–47) ng/mL.
There were no significant associations between TnT levels and CI, CI+II, and maximal ETS capacity (P=0.42, P=0.20, P=0.39, respectively, data not shown). Neither were there any significant associations between creatinine levels and CI, CI+II, and maximal ETS capacity (P=0.54, P=0.82, P=0.96, respectively, data not shown), or any significant associations between NSE levels and CI, CI+II, and maximal ETS capacity (P=0.38, P=0.44, P=0.52, respectively, data not shown).
Associations between mitochondrial function and outcome after OHCA
At 180 days after admission, five (25%) patients admitted after OHCA had died. There were no differences in median maximal CI or CI+II respiration in non-survivors versus survivors (P=0.49 and P=0.73, respectively). There was a non-significant difference in ETS capacity between non-survivors and survivors (51 (47–63) vs. 64 (62–70) pmol O2/mg/s, P=0.06). Delta-Kmck was similar in non-survivors versus survivors (P>0.99).
Discussion
The primary finding of the present study is that maximal stimulated mitochondrial respiration through CI+II as well as ETS capacity was significantly reduced in OHCA patients undergoing TTM compared to controls, while maximal CI sustained respiration was similar in OHCA and controls. Furthermore, the median flux control ratio was similar in OHCA and controls, indicating that the coupling of oxidative phosphorylation and ETS was unaffected by cardiac arrest and resuscitation. To our knowledge, this is the first study to examine mitochondrial oxidative phosphorylation in human OHCA patients. The findings suggest that mitochondrial dysfunction is a part of the post-cardiac arrest syndrome.
Mitochondrial CII, succinate : ubiquinone oxido-reductase, plays a central role in oxidative metabolism by catalysing the oxidation of succinate to fumarate in the mitochondrial matrix as part of the tricarboxylic acid cycle. Furthermore, the oxidation of succinate is coupled to the reduction of ubiquinone to ubiquinol at the inner mitochondrial membrane as part of the ETS. Accordingly, CII is the only direct link between the tricarboxylic acid cycle and the ETS.23
Consistent with our results, Chen et al. has demonstrated that CII function is significantly decreased in rat myocardium following 30 minutes of ischaemia and 24 hours of reperfusion.10 In contrast, Han et al. found that 8 minutes of cardiac arrest, followed by a 60-minute reperfusion phase, resulted in decreased CI function but normal CII function in cardiomyocytes from mice.11 Similarly, Paradies et al. demonstrated that 30 minutes of global ischaemia followed by 15 minutes of reperfusion decreased CI function in rat myocardium.12 While the present study and Chen et al. demonstrated decreased CII function after approximately 24 hours of reperfusion,10 the studies by Han et al. and Paradies et al. demonstrated decreased CI function immediately after reperfusion.11,12 In addition, Kim et al. has shown that the impact of ischaemia on mitochondrial respiration varies greatly among different animals, and whether results from animal studies can be extrapolated to humans is questionable.3
Investigating the roles of CII during ischaemia–reperfusion in rats, Chen et al. has shown that the presence of succinate (CII substrate) resulted in the generation of mitochondrial superoxide, which led to a 60–70% decrease in CII electron transfer capacity.10 The generation of superoxide by CII is relatively well established,24 and reactive oxygen species have been linked to cell death and reperfusion injury.8,,–11,25,26 As reactive oxygen species are key components of apoptosis and cell death,8,11,25 dysfunction of CII could potentially be involved in the process of ischaemia–reperfusion injury after OHCA.
In the present study, the decreased activity of CII could not be caused by lack of CII substrate as succinate was added prior to analysis. However, cofactors such as riboflavin and iron are necessary for both CI and CII, and a loss of such cofactors could theoretically limit respiration through both pathways. Another essential factor for ETS capacity, coenzyme Q10 (coQ10), represents an intersection in the electron transport chain, where electrons from both CI and CII are carried to CIII. As such, a lack of coQ10 could limit total ETS capacity, even with preserved function of CI. CoQ10 levels have been demonstrated to be low in post-cardiac arrest patients, and lower coQ10 levels have been associated with poor outcome.27 Furthermore, a small pilot trial demonstrated a beneficial survival effect of coQ10 compared to placebo in OHCA patients,28 and another pilot trial is currently enrolling post-cardiac arrest patients to receive either coQ10 or placebo (NCT02934555).
In OHCA patients, we found a significant association between increased PaO2 and increased CI capacity as well as lower delta-Kmck. Furthermore, we found a non-significant association between increased PaO2 and increased CI+II capacity. The decrease in delta-Kmck, with high PaO2 levels is suggestive of an increased activity of the mitochondrial creatine kinase. In human observational studies, hyperoxia has been associated with poor outcomes,29,30 and in interventional animal models, hyperoxia has been associated with decreased mitochondrial respiration.26,31 However, many methodological differences exist between animal studies and the present clinical results. Primarily, the two mentioned studies used a fraction of inspired oxygen of 100% for ‘hyperoxia’ groups during resuscitation and the post-resuscitation phase.26,31 In contrast, in the present study, OHCA patients were ventilated targeting normoxia in accordance with contemporary guidelines, and the median PaO2 level was within the normal range (interquartile range 10–14 KPa). This suggests that PaO2 levels within physiological ranges could be associated with mitochondrial respiration.
Furthermore, we found a significant association between increased arterial pCO2 and maximal uncoupled ETS capacity. We found no significant difference in mitochondrial function between patients treated at 33°C versus 36°C, suggesting that TTM does not affect mitochondrial respiratory capacity.
The presented analyses should be interpreted in light of a relatively small sample size. Accordingly, non-significance may be caused by a lack of statistical power. In addition, the analyses of mitochondrial function were conducted ex vivo, and may as such not be generalisable to the clinical setting. The mitochondrial function was assessed after TTM at 37°C, and accordingly, mitochondrial function may have been affected by different target temperatures during TTM. Mitochondrial function was assessed by Oroboros technology without other measures of mitochondrial function, similar to previously applied measures.32,33 Mitochondrial activity was measured in skeletal muscle, and whether mitochondrial activity in skeletal muscle can be used as a surrogate marker for mitochondrial activity in cardiac muscle is unknown; however, previous studies have demonstrated an association between cardiac disease and mitochondrial dysfunction.21,33 We did not measure other markers of mitochondrial function, including ATP generation and the generation of reactive oxygen species. While preclinical studies strongly support the association between OHCA and mitochondrial dysfunction, it is possible that other differences between OHCA and controls could confound the results, including demographics and physical activity levels as well as post-cardiac arrest treatment. However, importantly, neither sex nor BMI was associated with mitochondrial respiration in the cohort.
Conclusion
Mitochondrial oxidative phosphorylation capacity in skeletal muscle biopsies was reduced in OHCA patients undergoing TTM compared to age-matched, healthy controls. The role of mitochondria as risk markers and potential targets for post-resuscitation care remains unknown.
The authors declare that there is no conflict of interest.
This research received no specific grant from any funding agency in the public, commercial, or not-for-profit sectors.

Comments