


Despite recent advances in the diagnosis and management, the mortality of acute aortic dissection remains high. This study aims to clarify the current status of the management and outcome of acute aortic dissection in Japan.
A total of 18,348 patients with acute aortic dissection (type A: 10,131, type B: 8217) in the Japanese Registry of All Cardiac and Vascular Diseases database between April 2012–March 2015 were studied. Characteristics, clinical presentation, management, and in-hospital outcomes were analyzed.
Seasonal onset variation (autumn- and winter-dominant) was found in both types. More than 90% of patients underwent computed tomography for primary diagnosis. The overall in-hospital mortality of types A and B was 24.3% and 4.5%, respectively. The mortality in type A patients managed surgically was significantly lower than in those not receiving surgery (11.8% (799/6788) vs 49.7% (1663/3343); p<0.001). The number of cases managed endovascularly in type B increased 2.2-fold during the period, and although not statistically significant, the mortality gradually decreased (5.2% to 4.1%, p=0.49). Type A showed significantly longer length of hospitalization (median 28 days) and more than five times higher medical costs (6.26 million Japanese yen) than those in type B. The mean Barthel index at discharge was favorable in both type A (89.0±22.6) and type B (92.6±19.0). More than two-thirds of type A patients and nearly 90% of type B patients were directly discharged home.
This nationwide study elucidated the clinical features and outcomes in contemporary patients with acute aortic dissections in real-world clinical practice in Japan.
Introduction
Despite recent advances in the diagnosis and management, the mortality of acute aortic dissection (AAD) remains high at 25–30%.1 Type A AAD is a surgical emergency because of the associated high risk of developing life-threatening complications, and the mortality rates increase 1–2% per hour after symptom onset without surgical intervention.2 Operative mortality for type A at experienced centers ranges from 7–36%, whereas that for medical therapy is around 50%. 1,3,–5 In contrast, about 70% of type B cases can be managed medically, and the in-hospital mortality for these patients is reported to be 10%.6 Surgical or endovascular treatments for type B are performed for patients with complications, and the in-hospital mortality of these patients is about 20–30%, even after surgery.7
Current guidelines8,–10 provide evidence-based recommendations, such as emergent computed tomography (CT) for the diagnosis, beta blocker prescription for the control of blood pressure and heart rate, and emergency surgery or thoracic endovascular aortic repair (TEVAR) for type A and complicated type B patients. However, there may be some evidence-to-practice gaps in real-world treatment without directed efforts to bring evidence to practice.11 Furthermore, there has been no nationwide survey of the current status of the management of AAD in Japan.
This study explored the current status of the management and outcomes of AAD in a nationwide administrative database performed in Japan.
Materials and methods
Study population and data explanation
Data on patients who were admitted to hospitals with a diagnosis of AAD between 1 April 2012–31 March 2015, were obtained from The Japanese Registry of All Cardiac and Vascular Diseases-Diagnostic Procedure Combination (JROAD-DPC) database. The JROAD was launched in 2004 by the Japanese Circulation Society to assess the clinical activity at cardiovascular hospitals. All participating hospitals provide real-world, nationwide, primary data of resources (hospital bed sizes, cardiologists or surgeons volume, institutional categories), patients’ data, and outcomes.12 Since 2012, the DPC database, which is derived from the Japanese DPC/Per Diem Payment System, was combined with the JROAD to create the JROAD-DPC database which covers about 60% of all DPC hospitals with cardiovascular beds. We analyzed the JROAD-DPC data from 610 hospitals in 2012, 637 hospitals in 2013, and 742 hospitals in 2014 from all regions in Japan during the study period. This database includes the following information on each patient: unique hospital identifier, date of admission, age and gender, primary diagnoses and comorbidities, consciousness at arrival and discharge defined by Japan Coma Scale,13 purpose of the admission (examination, scheduled treatment, or emergency treatment), treatments and devices, diagnostic and therapeutic procedures, hospitalization length, total medical cost,14 and discharge status, including in-hospital death, functional status at discharge according to the Barthel index (BI),15 and discharge locations.16 The details of the JROAD-DPC database have been described previously,17,–19 and the validity of the DPC database is high, especially for primary diagnoses and procedure records.20
The identification of patients hospitalized for aortic dissection was first based on the International Classification of Diseases (ICD)-10 diagnosis code of I71.0. We excluded patients who were not admitted for emergent treatment. In addition, we excluded patients admitted to hospitals with incomplete response to the JROAD study in order to standardize the quality of treatment and data. Furthermore, we used the detailed diagnosis written in Japanese in the DPC database (types of dissection, chronic or acute, other anatomical or surgical information; these data were sorted by YS and classified by TY) to exclude chronic dissection or dissections of unspecified sites in order to increase the accuracy of the diagnosis. Finally, we excluded some patients of unknown age.
Baseline characteristics, clinical presentation, management, and in-hospital outcomes, including death, length of hospitalization, medical cost, the activity of daily living (ADL) at discharge, and discharge locations, were analyzed.
Ethical considerations
This research plan was designed by the authors and approved by the Institutional Review Board of the Tokyo Medical University. The requirement for informed consent was waived because of the anonymized catalogue of the data. This study was conducted in compliance with the Declaration of Helsinki and the Japanese Ethical Guidelines for Medical and Health Research involving Human Subjects.
Statistical analyses
Data are expressed as mean and standard deviation for normally distributed variables and as the median with the interquartile range for non-normally distributed data. Continuous variables were compared using Student’s t-test or the Mann–Whitney U test, as appropriate. Categorical data are expressed as numbers and percentages and were compared using the chi-square test or Fisher’s exact test. The correlation between the baseline characteristics and each group was compared using a one-way analysis of variance or Kruskal-Wallis as appropriate. When necessary, variables were transformed for further analyses. Time trend analyses for yearly changes in treatments and mortality were performed using the Cochran-Armitage trend test. Statistical analyses were conducted by a physician (TY) and a statistician (MN) using the Stata software program, 14.2 (Stata Corporation, College Station, Texas, USA). A two-sided p value <0.05 was considered statistically significant.
Results
Patient characteristics, management, and mortality
A total of 31,905 patients admitted with a primary diagnosis of aortic dissection (I71.0) between 1 April 2012–31 March 2015, were potentially eligible for this study. The flow chart of patient selection is shown in Figure 1. After excluding non-eligible patients, a total of 18,348 patients with AAD (type A: 10,131, type B: 8217) were studied. Seasonal onset variation (autumn- and winter-dominant) was found in both types (type A: 61.2%, type B: 59.1%). Seasonal mortality variation was found in type A (p=0.002) (Figure 2(a)), but not in type B (p=0.60) (Figure 2(b)). Baseline characteristics, management, and outcomes of patients stratified by the type of dissection are shown in Table 1. Female patients were dominant in type A, while male patients were dominant in type B. Approximately 13% of the patients with type A arrived at the hospital in a coma. CT was performed in more than 90% of the patients in both types. Open surgery and/or TEVAR were performed in 67.0% in type A and 7.4% in type B. Blood pressure was monitored by an arterial line in three-quarters of patients with type A and half of those with type B. Beta blockers were prescribed for nearly 80% of the patients who could discharge alive in both types. Overall in-hospital mortality was 24.3% in type A and 4.5% in type B. Patients’ characteristics, management, and outcomes stratified by types and management are shown in Tables 2 and 3.

Patient selection flow chart.
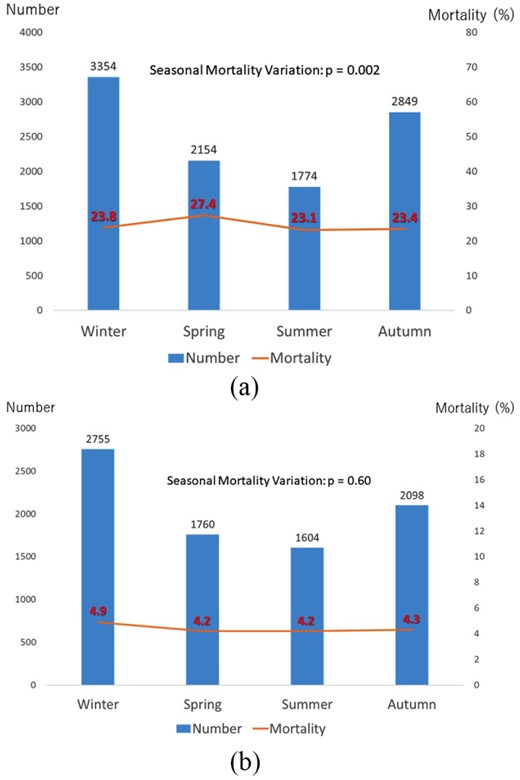
Seasonal onset variation and mortality for (a) type A and (b) type B. (a) Winter: December–February, spring: March–May, summer: June–August, autumn: September–November. (b) Winter: December–February, spring: March–May, summer: June–August, autumn: September–November.
Patients’ baseline characteristics, treatments, and outcomes stratified by types of dissection.
| Variables | Type A | Type B | p Value |
|---|---|---|---|
| n=10131 | n=8217 | ||
| Age (years) | 69.8 (13.5) | 69.3 (13.2) | 0.033 |
| Male gender | 4753 (46.9%) | 5723 (69.6%) | <0.001 |
| Medical history | |||
| Myocardial infarction | 412 (4.1%) | 225 (2.7%) | <0.001 |
| Heart failure | 2135 (21.1%) | 1378 (16.8%) | <0.001 |
| Cerebrovascular disease | 1097 (10.8%) | 554 (6.7%) | <0.001 |
| Chronic obstructive pulmonary disease | 296 (2.9%) | 336 (4.1%) | <0.001 |
| Diabetes mellitus | 868 (8.6%) | 729 (8.9%) | 0.47 |
| Chronic kidney disease | 347 (3.4%) | 427 (5.2%) | <0.001 |
| Status at the emergency department | |||
| Vasopressor use | 7253 (71.6%) | 793 (9.7%) | <0.001 |
| Coma at arrival | 1353 (13.4%) | 77 (0.9%) | <0.001 |
| Institutional parameters | |||
| Designation of emergency center | 5817 (57.4%) | 4465 (54.3%) | <0.001 |
| Bed size | <0.001 | ||
| 20–100 beds | 158 (1.6%) | 116 (1.4%) | |
| 100–200 beds | 263 (2.6%) | 206 (2.5%) | |
| 200–300 beds | 647 (6.4%) | 534 (6.5%) | |
| 300–450 beds | 2201 (21.7%) | 2051 (25.0%) | |
| 450–750 beds | 4886 (48.2%) | 3975 (48.4%) | |
| >750 beds | 1974 (19.5%) | 1334 (16.2%) | |
| Number of cardiovascular surgeons | 5 (3–8) | 4 (3–7) | <0.001 |
| Number of certified cardiologists | 11 (7–19) | 10 (7–15) | <0.001 |
| Tests and managements | |||
| Contrast computed tomography | 8369 (82.6%) | 7542 (91.8%) | <0.001 |
| Overall computed tomography | 9445 (93.2%) | 8080 (98.3%) | <0.001 |
| Blood pressure control under arterial pressure line | 7790 (76.9%) | 4337 (52.8%) | <0.001 |
| Beta blocker prescription | 6444 (63.6%) | 6659 (81.0%) | <0.001 |
| Beta blocker prescription (survivor to discharge) | 6062/7669 (79.1%) | 6496/7850 (82.8%) | <0.001 |
| Procedures and treatments | <0.001 | ||
| Open surgery | 6682 (66.0%) | 239 (2.9%) | |
| TEVAR | 61 (0.6%) | 362 (4.4%) | |
| Both open surgery and TEVAR | 45 (0.4%) | 11 (0.1%) | |
| IOTEE | 5200/6788 (76.6%) | 161/612 (26.3%) | <0.001 |
| Outcomes | |||
| In-hospital death | |||
| Overall | 2462 (24.3%) | <0.001 | |
| Operative treatment | 799/6788 (11.8%) | 44/612 (7.2%) | <0.001 |
| Conservative treatment | 1663/3343 (49.7%) | 323/7605 (4.2%) | <0.001 |
| Length of hospitalization (days) | 23 (12–35) | 22 (16–29) | 0.004 |
| Length of hospitalization (days) (survival to discharge) | 28 (20–40) | 22 (16–29) | <0.001 |
| Medical cost (million Japanese yen) | 5.84 (1.45–7.51) | 1.17 (0.86–1.61) | <0.001 |
| Medical cost (million Japanese yen) (survival to discharge) | 6.26 (4.68–7.72) | 1.18 (0.88–1.60) | <0.001 |
| Barthel Index at discharge | 89.0 (22.6) | 92.6 (19.0) | <0.001 |
| Discharge location | n=7669 | n=7850 | |
| Home | 5255 (68.5%) | 6784 (86.4%) | <0.001 |
| Transfer | 2327 (30.4%) | 954 (12.2%) | |
| Nursing home | 82 (1.1%) | 101 (1.3%) | |
| Other | 5 (0.1%) | 11 (0.1%) |
IOTEE: intraoperative transesophageal echocardiography; TEVAR: thoracic endovascular aneurysm repair.
The data are expressed as the numbers (%), means and standard deviations, or medians and interquartile ranges. Coma was defined as Japan Coma Scale 100–300.
Patients’ baseline characteristics and managements for type A dissection stratified by emergency operative treatment.
| Variables | Surgical | TEVAR | Both | Medical | p Value |
|---|---|---|---|---|---|
| n=6682 | n=61 | n=45 | n=3343 | ||
| Age (years) | 66.99 (13.06) | 68.57 (10.77) | 65.96 (12.65) | 75.34 (12.77) | <0.001 |
| Male gender | 3233 (48.4%) | 37 (60.7%) | 28 (62.2%) | 1455 (43.5%) | <0.001 |
| Medical history | |||||
| Myocardial infarction | 243 (3.6%) | 1 (1.6%) | 1 (2.2%) | 167 (5.0%) | 0.008 |
| Heart failure | 1699 (25.4%) | 8 (13.1%) | 6 (13.3%) | 422 (12.6%) | <0.001 |
| Cerebrovascular disease | 676 (10.1%) | 7 (11.5%) | 2 (4.4%) | 412 (12.3%) | 0.004 |
| Chronic obstructive pulmonary disease | 191 (2.9%) | 0 (0.0%) | 1 (2.2%) | 104 (3.1%) | 0.49 |
| Diabetes mellitus | 714 (10.7%) | 8 (13.1%) | 3 (6.7%) | 143 (4.3%) | <0.001 |
| Chronic kidney disease | 242 (3.6%) | 1 (1.6%) | 1 (2.2%) | 103 (3.1%) | 0.43 |
| Status at the emergency department | |||||
| Vasopressor use | 6461 (96.7%) | 36 (59.0%) | 45 (100.0%) | 711 (21.3%) | <0.001 |
| Coma at arrival | 428 (6.4%) | 0 | 0 | 925 (27.7%) | <0.001 |
| Institutional parameters | |||||
| Designation of emergency center | 3674 (55.0%) | 38 (62.3%) | 27 (60.0%) | 2078 (62.2%) | <0.001 |
| Bed size | <0.001 | ||||
| 20–100 beds | 144 (2.2%) | 0 (0.0%) | 0 (0.0%) | 14 (0.4%) | |
| 100–200 beds | 203 (3.0%) | 1 (1.6%) | 0 (0.0%) | 59 (1.8%) | |
| 200–300 beds | 445 (6.7%) | 2 (3.3%) | 9 (20.0%) | 191 (5.7%) | |
| 300–450 beds | 1434 (21.5%) | 11 (18.0%) | 7 (15.6%) | 749 (22.4%) | |
| 450– 750 beds | 3074 (46.0%) | 33 (54.1%) | 19 (42.2%) | 1760 (52.6%) | |
| >750 beds | 1380 (20.7%) | 14 (23.0%) | 10 (22.2%) | 570 (17.1%) | |
| Number of cardiovascular surgeons | 5 (4–9) | 7 (5–10) | 5 (3–8) | 4 (3–7) | <0.001 |
| Number of certified cardiologists | 11 (8–20) | 14 (8–26) | 10 (5–17) | 10 (7–15) | <0.001 |
| Number of aortic surgeries | 36 (20–62) | 45 (32–62) | 54 (35–102) | 24 (11–43) | <0.001 |
| Number of TEVAR procedures | 34 (15–61) | 54 (35–83) | 46 (41–89) | 25 (8–51) | <0.001 |
| Tests and managements | |||||
| Contrast computed tomography | 5987 (89.6%) | 61 (100.0%) | 43 (95.6%) | 2278 (68.1%) | <0.001 |
| Overall computed tomography | 6478 (96.9%) | 61 (100.0%) | 44 (97.8%) | 2862 (85.6%) | <0.001 |
| IOTEE | 5148 (77.0%) | 16 (26.2%) | 36 (80.0%) | 0 (0.0%) | <0.001 |
| Blood pressure control under arterial pressure line | 6202 (92.8%) | 58 (95.1%) | 45 (100.0%) | 1485 (44.4%) | <0.001 |
| Beta blocker prescription | 5021 (75.1%) | 50 (82.0%) | 35 (77.8%) | 1338 (40.0%) | <0.001 |
| Beta blocker prescription (survival to discharge) | 4815/5896 (81.7%) | 45/52 (86.5%) | 35/41 (85.4%) | 1167/1680 (69.5%) | <0.001 |
| Outcomes | |||||
| Overall in hospital death | 786 (11.8%) | 9 (14.8%) | 4 (8.9%) | 1663 (49.7%) | <0.001 |
| In-hospital death stratified by number of cardiovascular surgeons | |||||
| Lowest (0–3) | 238/1524 (15.6%) | 3/11 (27.3%) | 2/13 (15.4%) | 714/1304 (54.8%) | <0.001 |
| Low (4–5) | 224/1895 (11.8%) | 1/9 (11.1%) | 0/11 (0%) | 385/852 (45.2%) | <0.001 |
| High (6–8) | 173/1580 (11.0%) | 1/16 (6.3%) | 1/10 (10.0%) | 254/572 (44.4%) | <0.001 |
| Highest (≥9) | 151/1683 (9.0%) | 4/25 (16.0%) | 1/11 (9.1%) | 292/575 (50.8%) | <0.001 |
| In-hospital death stratified by number of aortic surgeries per year | |||||
| Lowest (0–17) | 191/1305 (14.6%) | 0/5 (0%) | 0/3 (0%) | 691/1290 (53.6%) | <0.001 |
| Low (18–32) | 200/1650 (12.1%) | 2/11 (18.2%) | 1/5 (20.0%) | 352/724 (48.6%) | <0.001 |
| High (33–56) | 200/1742 (11.5%) | 6/28 (21.4%) | 0/15 (0%) | 362/728 (49.7%) | <0.001 |
| Highest (≥57) | 189/1922 (9.8%) | 1/16 (6.3%) | 3/21 (14.3%) | 213 (41.5%) | <0.001 |
| Length of hospitalization (days) (survival to discharge) | 28 (20–41) | 31 (22–45) | 42 (36–59) | 25 (16–34) | <0.001 |
| Medical cost (million Japanese yen) | 6.86 (5.81–8.24) | 5.71 (4.05–6.84) | 11.32 (9.66–13.17) | 0.67 (0.18–1.41) | <0.001 |
| Medical cost (million Japanese yen) (survival to discharge) | 6.82 (5.82–8.13) | 5.23 (3.96–6.69) | 11.03 (9.66–12.93) | 1.31 (0.85–1.83) | <0.001 |
| Barthel Index at discharge | 89.94 (21.38) | 91.63 (17.92) | 92.50 (16.56) | 85.25 (26.83) | <0.001 |
| Discharge location | n=5896 | n=52 | n=41 | n=1680 | <0.001 |
| Home | 4080 (69.2%) | 46 (88.5%) | 31 (75.6%) | 1098 (65.4%) | |
| Transfer | 1776 (30.1%) | 6 (11.5%) | 10 (24.4%) | 535 (31.8%) | |
| Nursing home | 39 (0.7%) | 0 (0.0%) | 0 (0.0%) | 43 (2.6%) | |
| Other | 1 (0.02%) | 0 (0.0%) | 0 (0.0%) | 4 (0.2%) |
IOTEE: intraoperative transesophageal echocardiography; TEVAR: thoracic endovascular aneurysm repair.
The data are expressed as the numbers (%), means and standard deviations, or medians and interquartile ranges. Coma was defined as Japan Coma Scale 100–300.
Patients’ baseline characteristics and treatments for type B dissection stratified by emergency operative treatment.
| Variables | Surgical | TEVAR | Both | Medical | p Value |
|---|---|---|---|---|---|
| n=239 | n=362 | n=11 | n=7605 | ||
| Age (years) | 63.8 (13.7) | 67.6 (12.9) | 59.0 (19.6) | 69.6 (13.1) | <0.001 |
| Male gender | 192 (80.3%) | 275 (76.0%) | 8 (72.7%) | 5248 (69.0%) | <0.001 |
| Medical history | |||||
| Myocardial infarction | 3 (1.3%) | 9 (2.5%) | 0 (0.0%) | 213 (2.8%) | 0.48 |
| Heart failure | 37 (15.5%) | 48 (13.3%) | 3 (27.3%) | 1290 (17.0%) | 0.21 |
| Cerebrovascular disease | 11 (4.6%) | 34 (9.4%) | 1 (9.1%) | 508 (6.7%) | 0.12 |
| Chronic obstructive pulmonary disease | 7 (2.9%) | 13 (3.6%) | 0 (0.0%) | 316 (4.2%) | 0.66 |
| Diabetes mellitus | 23 (9.6%) | 36 (9.9%) | 3 (27.3%) | 667 (8.8%) | 0.15 |
| Chronic kidney disease | 11 (4.6%) | 18 (5.0%) | 2 (18.2%) | 396 (5.2%) | 0.26 |
| Status at the emergency department | |||||
| Vasopressor use | 214 (89.5%) | 224 (61.9%) | 10 (90.9%) | 345 (4.5%) | <0.001 |
| Coma at arrival | 3 (1.3%) | 4 (1.1%) | 0 (0%) | 70 (0.9%) | 0.92 |
| Institutional parameters | |||||
| Designation of emergency center | 115 (48.1%) | 245 (67.7%) | 7 (63.6%) | 4098 (53.9%) | <0.001 |
| Bed size | <0.001 | ||||
| 20–100 beds | 5 (2.1%) | 4 (1.1%) | 0 (0.0%) | 107 (1.4%) | |
| 100–200 beds | 13 (5.4%) | 3 (0.8%) | 0 (0.0%) | 190 (2.5%) | |
| 200–300 beds | 22 (9.2%) | 18 (5.0%) | 0 (0.0%) | 494 (6.5%) | |
| 300–450 beds | 54 (22.6%) | 67 (18.5%) | 3 (27.3%) | 1927 (25.3%) | |
| 450–750 beds | 91 (38.1%) | 179 (49.4%) | 4 (36.4%) | 3701 (48.7%) | |
| >750 beds | 54 (22.6%) | 91 (25.1%) | 4 (36.4%) | 1185 (15.6%) | |
| Number of cardiovascular surgeons | 5 (4–9) | 6.5 (4–10) | 7 (4–18) | 4 (3–7) | <0.001 |
| Number of certified cardiologists | 11 (8–22) | 12 (8–22) | 17 (8–31) | 10 (7–15) | <0.001 |
| Number of aortic surgeries | 42 (21–61) | 40 (24–63) | 44 (32–123) | 25 (12–48) | <0.001 |
| Number of TEVAR procedures | 32 (13–61) | 56 (39–84) | 70 (31–103) | 25 (8–50) | <0.001 |
| Tests and managements | |||||
| Contrast computed tomography | 225 (94.1%) | 354 (97.8%) | 11 (100.0%) | 6952 (91.4%) | <0.001 |
| Overall computed tomography | 236 (98.7%) | 361 (99.7%) | 11 (100.0%) | 7472 (98.3%) | 0.17 |
| IOTEE | 135 (56.5%) | 20 (5.5%) | 6 (54.5%) | 0 (0.0%) | <0.001 |
| Blood pressure control under arterial pressure line | 226 (94.6%) | 329 (90.9%) | 10 (90.9%) | 3772 (49.6%) | <0.001 |
| Beta blocker prescription | 207 (86.6%) | 276 (76.2%) | 9 (81.8%) | 6167 (81.1%) | 0.016 |
| Beta blocker prescription (survival to discharge) | 191/215 (88.8%) | 269/342 (78.7%) | 9/11 (81.8%) | 6027/7282 (82.8%) | 0.022 |
| Outcomes | |||||
| Overall in-hospital death | 24 (10.0%) | 20 (5.5%) | 0 (0%) | 323 (4.2%) | <0.001 |
| In-hospital death stratified by number of cardiovascular surgeons | |||||
| Lowest (0–3) | 8/52 (15.4%) | 3/57 (5.3%) | 0/2 (0%) | 138/2802 (4.9%) | 0.009 |
| Low (4) | 4/51 (7.8%) | 1/37 (2.7%) | 0/2 (0%) | 62/1190 (5.2%) | 0.73 |
| High (5–7) | 5/52 (9.6%) | 9/127 (7.1%) | 0/2 (0%) | 72/1971 (3.7%) | 0.043 |
| Highest (≥8) | 7/84 (8.3%) | 7/141 (5.0%) | 0/5 (0%) | 46/1538 (3.0%) | 0.041 |
| In-hospital death stratified by number of aortic surgeries per year | |||||
| Lowest (0–13) | 3/31 (9.7%) | 1/21 (4.8%) | 0 (0%) | 110/2049 (5.4%) | 0.57 |
| Low (14–26) | 4/42 (9.5%) | 6/77 (7.8%) | 0/2 (0%) | 81/1894 (4.3%) | 0.20 |
| High (27–51) | 6/85 (7.1%) | 7/129 (5.4%) | 0/5 (0%) | 66/1764 (3.7%) | 0.35 |
| Highest (≥52) | 10/79 (12.7%) | 6/127 (4.7%) | 0/4 (0%) | 57/1700 (3.4%) | <0.001 |
| Length of hospitalization (days) | 42 (27–62) | 29 (21–44) | 78 (39–96) | 21 (16–28) | <0.001 |
| Length of hospitalization (days) (survival to discharge) | 42 (30–62) | 22 (16–28) | 78 (39–96) | 22 (16–28) | <0.001 |
| Medical cost (million Japanese yen) | 6.39 (4.75–8.69) | 5.38 (4.21–6.47) | 13.00 (8.83–15.13) | 1.12 (0.84–1.47) | <0.001 |
| Medical cost (million Japanese yen) (survival to discharge) | 6.28 (4.60–8.48) | 5.37 (4.19–6.46) | 13.00 (8.83–15.13) | 1.13 (0.85–1.47) | <0.001 |
| Barthel Index at discharge | 93.9 (16.1) | 90.3 (21.9) | 81.2 (25.9) | 92.7 (18.9) | 0.042 |
| Discharge location | n=215 | n=342 | n=11 | n=7282 | |
| Home | 172 (80.0%) | 282 (82.5%) | 7 (63.6%) | 6323 (86.8%) | <0.001 |
| Transfer | 43 (20.0%) | 58 (17.0%) | 4 (36.4%) | 849 (11.7%) | |
| Nursing home | 0 | 2 (0.6%) | 0 | 99 (1.4%) | |
| Other | 0 | 0 | 0 | 11 (0.2%) |
IOTEE: intraoperative transesophageal echocardiography; TEVAR: thoracic endovascular aneurysm repair.
The data are expressed as the numbers (%), means and standard deviations, or medians and interquartile ranges. Coma was defined as Japan Coma Scale 100–300.
For type A (Table 2), patients who were managed surgically tended to be younger and were admitted to hospitals with large numbers of surgeons and operative case volume. The mortality in type A patients managed surgically (patients who underwent surgery, TEVAR, and both surgery and TEVAR, 67%) was significantly lower than in those not receiving surgery (11.8% (799/6788) vs 49.7% (1663/3343); p<0.001) (Tables 1 and 2). Figure 3(a) compares the proportion of the patients undergoing open surgery and medical treatment. The proportion was similar, and the mortality rate has not changed in this period (p=0.66).
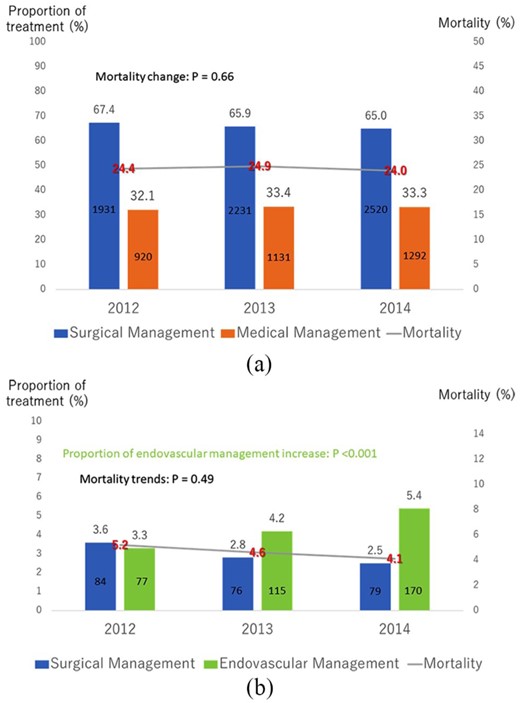
Time trend for treatments and mortality for (a) type A and (b) type B.
For type B (Table 3), patients who underwent operative treatment tended to be younger, male, and need vasopressors and were more likely to be in a coma at admission. They also tended to be admitted to hospitals with large numbers of surgeons and operative case volume. The mortality of the type B patients treated medically was significantly lower than in those managed surgically including TEVAR (4.2% (323/7605) vs 7.2% (44/612); p<0.001) (Tables 1 and 3). The number of TEVAR procedures for type B increased by 2.2-fold (proportion of TEVAR increased by 1.62-fold, p<0.001), and although not statistically significant, the overall mortality gradually decreased in the study period (5.2% to 4.1%, p=0.49) (Figure 3(b)).
Length of hospital stay and medical cost
The median length of hospitalization (survival to discharge) was significantly longer in type A than in type B (type A: 28 (20–40) vs type B: 22 (16–29) days; p<0.001) (Table 1). Compared with open surgery, the hospitalization duration was shorter in patients who underwent TEVAR for type B (TEVAR: 22 (16–28) vs open surgery: 42 (30–62) days) (Table 3); however, no marked difference was found in those with type A (TEVAR: 31 (22–45) vs open surgery: 28 (20–41) days). The medical costs of the patients who were discharged alive were more than five times higher in type A patients than that in type B patients (type A: 6.26 vs type B: 1.18 million Japanese yen) (Table 1). The medical costs of the patients who were managed via open surgery (type A: 6.82 vs type B: 6.28 million yen) and TEVAR (type A: 5.23 vs type B: 5.37 million yen) were similar in both types and were much higher than in those who were managed medically (type A: 1.31 vs type B: 1.13 million yen) (Tables 2 and 3).
ADL at discharge and discharge location
The mean BI at discharge was favorable in both type A (89.0±22.6) and type B (92.6±19.0) (Table 1). In both types, the ADL of the patients who were managed surgically was not inferior to that in those who were managed medically (Tables 2 and 3). Figure 4 and Tables 2 and 3 show the discharge location stratified by types and management approach. For type A, more than two-thirds of the patients who were discharged alive (5255/7669) were discharged directly home, whereas about 30% of the patients who were managed surgically or medically were transferred to other hospitals. For type B, nearly 90% of patients (6784/7850) were discharged directly home. However, the few patients (n=11) who underwent both surgical treatment and TEVAR had a high transfer rate (36.4%), a very long hospital stay (median 78 days), and low BI at discharge (81.2±25.9).
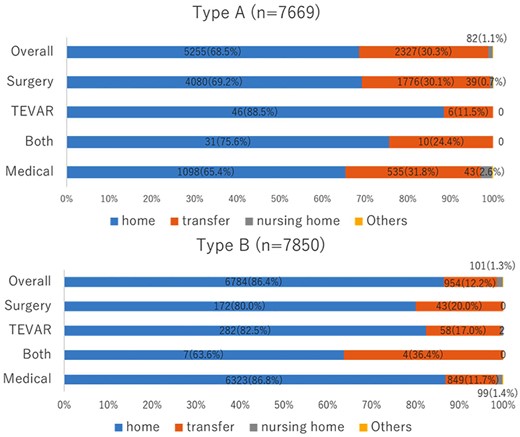
Discharge location for different types and management.
TEVAR: thoracic endovascular aortic repair.
Discussion
To our knowledge, this is the largest study evaluating the current status of management and outcomes of AAD in Japan, and the first study analyzing type A and B separately using a nationwide claim-based database. Analyzing the current management approaches and outcomes in real clinical practice will aid in reevaluating the management approaches for AAD and clarify the unmet needs for clinical trials. Most previous claim-based database analyses analyzed only operative mortality for AAD or analyzed type A and B simultaneously because the original ICD-10 code did not differentiate types A and B.21,,–24 However, in the present study, we were able to differentiate the types of dissection using the detailed diagnosis written in Japanese in the DPC database and collected very comprehensive data, including whether a patient was treated surgically or medically. Consequently, this is the first “comprehensive” analysis of the claim-based database and the most up-to-date study collecting various outcomes, including death, functional status at discharge, length of hospitalization, medical cost, and discharge locations.
Current demographics and management for AAD in Japan
In the Oxford Vascular study,25 the incidence of AAD is estimated at six per 100,000 persons per year and this incidence increases with age. Because the current Japanese population is about 125 m and Japan has notable aging of the population, the possible incidence of AAD in Japan is estimated to be 7500 per year or more. Similar to previous reports,26,27 a significant seasonal onset variation was also found in this study. The onset was frequent in autumn and winter, but mortality was not higher in these seasons than in others, potentially implying that there is no strong relationship between the onset number and severity in AAD. The mortality for type A was slightly higher in spring, whereas no difference was found in type B. Since spring is the beginning of the fiscal year in Japan, many surgeons move to other facilities all at the same time in this season. This large-scale simultaneous movement of the surgeons all over Japan could be a possible reason for higher mortality in spring for type A AAD that require emergent surgery. The mean age (67 years) and proportion of women (43%) in this study were higher than those (63 years and 33%) in the International Registry of Acute Aortic Dissection (IRAD)28 and those (64.7 years and 27%) in the Spanish Registry of Acute Aortic Syndrome (RESA-II).29 Type A in this study accounted for 55% of cases, which was smaller than the 67% in IRAD and 70.4% in RESA-II. Whether this difference is due to racial differences or not is unclear at present. Coma on arrival was found in 13.4% of patients with type A, which was similar to the IRAD results (10%). Conservative treatments were selected for 68.4% (925/1353) of type A patients with a coma, which can lead to a poor prognosis.
More than 90% of the patients underwent CT for the primary diagnosis, which was much higher than the rate of 69% in the IRAD registry and 78% in RESA-II. This may be due to the extremely high penetration rate of CT in Japan. The number of CT per million population was 101.3 in Japan in 2018, which was 4.1-fold higher than that in Organization for Economic Co-operation and Development (OECD) countries.30 We hypothesize that the high prevalence of AAD in this study is related to the high penetration of CT all over Japan and high level of use of CT in the emergency department. The diagnostic accuracy of CT for AAD was reported to be 100% for pooled sensitivity and 98% for pooled specificity.31 Because the quality of echocardiography depends on the skill of the operator and magnetic resonance imaging takes a much longer time to perform, CT should be the first option, if available, for making a diagnosis of AAD, especially in Japan where its accessibility is quite high.
Current guidelines8,–10 recommend the administration of beta blockers to reduce the heart rate to <60 beats/min and lower the systolic blood pressure to 100–120 mm Hg. In this study, nearly 80% of the patients of both types who were discharged alive were prescribed beta blockers during hospitalization. The administration of beta blockers is proven to be effective not only in acute management but also for the long-term survival in type B.32
Although there is no guideline recommendation for blood pressure control with an arterial line, in the present study three-quarters of type A and more than half of type B patients were monitored by an arterial line. Strict control of the heart rate and blood pressure were obtained with an arterial line, which may have resulted in the observed evidence-practice gap.
Treatments and mortality
For type A, 67% of patients were managed surgically, which was much lower than the rate of 86% in IRAD28 and 78.3% in RESA-II.29 In contrast, for type B, 92.6% were treated medically in this study, which was much higher than the rate of 63% in IRAD and 62.4% in RESA-II. The relatively low operation rates in both types in this study may be due to our patients being relatively old, and differences among participating hospitals. For instance, in this study, half of the hospitals were not designated as emergency or critical care centers (Table 1). In contrast, most of the participating IRAD centers were tertiary referral hospitals (total referral rate: 69.7%)28 and all 26 participating hospitals in RESA-II were tertiary hospitals, and the included patients were therefore those who had survived long enough to reach such centers to undergo surgical treatment.
The overall in-hospital mortality, surgical mortality, and medical mortality of type A in this study were comparable to those in IRAD (JROAD vs IRAD, overall: 24.3% vs 22%, surgical: 11.8% vs 18%, and medical: 49.7% vs 57%, respectively).30 The mortality was also comparable to those in RESA-II (JROAD vs RESA-II, surgical: 11.8% vs 25.1%, and medical: 49.7% vs 68%, respectively).29 The surgical mortality for type A in this study (11.8%) was also comparable to that in previous reports from the annual survey by the Japanese Association for Thoracic Surgery in 2013 (9.1%)33 in which most Japanese surgical centers participated.
For type B, the overall in-hospital and surgical mortality were more favorable than those in IRAD (JROAD vs IRAD, overall: 4.5% vs 13%, surgical management including TEVAR: 7.2% vs 30%). Similarly, the outcomes were more favorable than those in RESA-II (JROAD vs RESA-II, Medical: 4.2% vs 13.8%, surgical: 10.0% vs 33%, TEVAR: 5.5% vs 18.0%, respectively). This may be explained by the reverse referral effect of IRAD and RESA-II hospitals where patients with complicated type B who need surgical treatment could be transferred to. The number of TEVAR procedures increased 2.2-fold over three years, which may have helped improve the outcomes of complicated type B AAD in Japan.
Length of hospital stay and medical cost
The median hospital stay among surviving patients in this study was 28 days in type A and 22 days in type B, periods which were much longer than the stay of 16 days in both types in the IRAD study34 The length of the hospital stay is generally much longer in Japan than in other countries because inpatients receive not only acute treatments but also nursing care and rehabilitation during the same hospitalization period.35 TEVAR resulted in a much shorter hospital stay than open surgery in type B, which was a positive result driven by the low invasiveness of endovascular management.
The medical cost of type A was more than five times higher than that of type B in this study. Since most of the medical cost was used for surgical treatment (operation fee and graft fee), the cost of surgically managed patients in both groups was similar. In both types, the medical cost was significantly higher for open surgery than TEVAR, probably because the operation fee is much lower for TEVAR (about 0.5 million yen) than for open surgery (about 0.5–2.5 million yen depending on the procedure).
ADL at discharge and discharge location
The mean BI at discharge was favorable in both types. For type A, the discharge BI was similarly positive (nearly 90) between open surgery and TEVAR. However, there were significant differences in the discharge location. One-third of the patients who underwent open surgery were transferred to other hospitals for continued treatment. In contrast, nearly 90% of the patients receiving TEVAR were able to be discharged directly home. For type B, although the length of hospitalization for TEVAR was much shorter (half as long) than that for open surgery, TEVAR showed a similar home discharge rate (nearly 80%) and positive BI (nearly 90) at discharge. Given these findings, TEVAR may play an important role in maintaining a good functional status among patients who need surgical treatment.
Study limitations
Several limitations associated with the present study warrant mention. First, this was an analysis of nationwide observational data. This database only contains data from the hospitals participating in the JROAD and does not include detailed data, such as the severity of comorbidities, aortic anatomy and extension, existence of intra mural hematoma, onset to arrival, or actual blood pressure at arrival. However, this study contains data on comorbidities already present at admission, types of dissection, consciousness status at arrival, and need for vasopressors as surrogates for low blood pressure. Second, because we had to exclude a large number of patients who were admitted with chronic dissection or whose types of dissection were undetermined, it could result in possible selection bias. Third, because we were unable to identify the reasons for treatment selection or rejecting surgical treatment, this could also result in selection bias in this study. Although the non-operation rate in this study was higher than those in previous registries, this finding seems acceptable when differences in participating hospitals are taken into account. Finally, only in-hospital outcomes were evaluated, and there was no information regarding the longer-term mortality or morbidity, which are important determinants of treatment success.
Conclusions
An analysis of a Japanese nationwide administrative database demonstrated the clinical features, management, and in-hospital outcomes in contemporary patients with AADs in real-world clinical practice in Japan.
The authors declare that there is no conflict of interest.
The authors disclosed receipt of the following financial support for the research, authorship, and/or publication of this article: This research received grants from Japan Agency for Medical Research and Development (Issue number: 17ek0210086h0001).

Comments