


Abstract
Risk stratification of patients with chest pain and a high-sensitivity cardiac troponin T (hs-cTnT) concentration <upper reference limit (URL) is challenging. The aim of this study was to develop and externally validate clinical models for risk prediction of 90-day death or myocardial infarction in patients presenting to the emergency department with chest pain and an initial hs-cTnT concentration <URL.
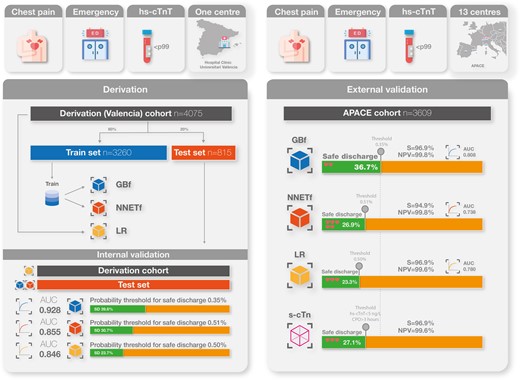
Four machine-learning-based models and one logistic regression (LR) model were trained on 4075 patients (single-centre Spanish cohort) and externally validated on 3609 patients (international prospective Advantageous Predictors of Acute Coronary syndromes Evaluation cohort). Models were compared with GRACE and HEART scores and a single undetectable hs-cTnT-based strategy (u-cTn; hs-cTnT < 5 ng/L and time from symptoms onset >180 min). Probability thresholds for safe discharge were derived in the derivation cohort. The endpoint occurred in 105 (2.6%) patients in the training set and 98 (2.7%) in the external validation set. Gradient boosting full (GBf) showed the best discrimination (area under the curve = 0.808). Calibration was good for the reduced neural network and LR models. Gradient boosting full identified the highest proportion of patients for safe discharge (36.7 vs. 23.4 vs. 27.2%; GBf vs. LR vs. u-cTn, respectively) with similar safety (missed endpoint per 1000 patients: 2.2 vs. 3.5 vs. 3.1, respectively). All derived models were superior to the HEART and GRACE scores (P < 0.001).
Machine-learning and LR prediction models were superior to the HEART, GRACE, and u-cTn for risk stratification of patients with chest pain and a baseline hs-cTnT <URL. Gradient boosting full models best balanced discrimination, calibration, and efficacy, reducing the need for serial hs-cTnT determination by more than one-third.
ClinicalTrials.gov number, NCT00470587, https://clinicaltrials.gov/ct2/show/NCT00470587.
Introduction
Chest pain is a leading cause of visits to the emergency department (ED).1 Up to 75% of patients show a first high-sensitivity cardiac troponin (hs-cTnT) concentration below the upper reference limit (URL) at ED arrival.2 These patients constitute a large and heterogeneous population with an overall low risk.3–5 The immediate discharge after a single hs-cTnT determination below the URL avoiding serial hs-cTnT measurements would substantially reduce the length of stay and costs in the ED. However, 2–4% of patients with a single hs-cTnT below the URL suffer from adverse cardiovascular events at 30–90 days.4–6
In the past, several clinical scores were derived to estimate the prognosis of acute coronary syndromes (GRACE and TIMI scores) or patients presenting to the ED with chest pain (HEART).7–9 More recent algorithms, such as the European Society of Cardiology (ESC) 0/1 h algorithm3,10,11 or myocardial infarction (MI),3,12 take into account assay-specific hs-cTnT/I concentrations13 but do not consider electrocardiogram (ECG).14 On the other hand, the 2 h accelerated diagnostic protocol (ADAPT) and Emergency Department Assessment of Chest Pain Score (EDACS) pathways15,16 combine clinical features, electrocardiographic and hs-cTnT determinations with good performance in a low-risk setting but require serial hs-cTnT determinations.
Traditional clinical risk scores either dichotomized continuous variables or forced them to be linear and failed to explore interactions, thus weakening model performance. Machine-learning (ML) methods may be able to overcome some of the above limitations, capturing high-dimensional, non-linear relationships, thus improving performance.17,18
In this study, we aimed to (i) assess the performance of the HEART and GRACE scores in patients presenting to the ED with chest pain and an initial hs-cTnT concentration below the URL, (ii) derive and internally validate new prediction models for improving risk stratification, and (iii) externally validate the derived models in a large prospective international diagnostic study. The ultimate goal was to identify a subgroup of very-low-risk patients who could be discharged early and safely after a single hs-cTnT determination.
Methods
Study design, setting, and patients
Models were derived in a retrospective cohort involving consecutive patients presenting to the ED of the Hospital Clínico Universitario de València (Spain) with a complaint of chest pain, without persistent ST-segment elevation in the initial ECG and a first hs-cTnT concentration <99th percentile (14 ng/L). The study period was from July 2016 to February 2019. Patients were excluded for the following reasons: (i) ECG evidence of ischaemia (transient ST-segment elevation or dynamic ST segment/T-wave changes), (ii) potential causes of myocardial increased oxygen demand such as tachyarrhythmias (>100 beats/min) or bradyarrhythmias (<50 beats/min), or (iii) evident non-ischaemic causes of chest pain after an initial clinical diagnostic work-up (see Supplementary material online, Figure S1). Preliminary analyses have been previously published.14,19
The Advantageous Predictors of Acute Coronary syndromes Evaluation (APACE) study was used as the external validation cohort. The APACE is an independent prospective international multicentre study, recruiting adult patients presenting to the ED with symptoms suggestive of MI (URL: https://clinicaltrials.gov; unique identifier: NCT00470587).20,21
Reporting is in accordance with the Transparent Reporting of a multivariable prediction model for Individual Prognosis Or Diagnosis statement (TRIPOD)22 (see Supplementary material online, Table S1). Details about data extraction and follow-up are summarized in Supplementary material online, Methods.
Cardiac troponin testing
In both cohorts, cardiac troponin was measured using a hs-cTnT assay (Elecsys 2010 system; Roche Diagnostic, Rotkreuz, Switzerland), with a limit of detection (LoD) of 5 ng/L, an URL cut-off of 14 ng/L, and a coefficient of variation <10% at 13 ng/L.
Endpoint measure
The endpoint was death or MI at 90 days (including index MI). Myocardial infarction was defined and hs-cTnT was interpreted as recommended in current guidelines.23,24 The endpoint adjudication process is described in detail in Supplementary material online, Methods.
Candidate predictors, predictor selection, and sample size calculation
We followed the criteria laid down by Riley et al.25; we calculated a minimum sample size of 2639 patients with 68 events to derivate a model with 20 degrees of freedom (see Supplementary material online, Methods).
Potential candidate predictors to include in the multivariable model were selected based on literature reviews,14,19,26 current guidelines,3 and clinical meaningfulness. Potential predictor selection is explained in Supplementary material online, Methods. After selection, the 15 candidate predictors for constructing the full models are those appearing in Figure 1.
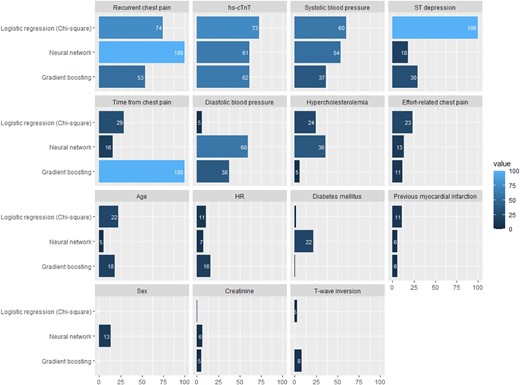
Variable relative importance and rank of importance in the different models. DBP, diastolic blood pressure; GBM, gradient boosting model; hs-cTnT, high-sensitivity cardiac troponin T; HR, heart rate; LR, logistic regression; MI, myocardial infarction; NNET, neural network; SBP, systolic blood pressure.
Derivation and internal validation of machine-learning models
The derivation cohort was randomly split into two data sets: a training (80%) cohort, which was used to train the four ML models and tune their hyperparameters, and an internal validation (20%) cohort (test cohort), which was used to test the derived models on independent (unseen) patients (see Supplementary material online, Methods and Figure S2). The performance of the ML models was assessed in the test cohort.
Two ML algorithms were used to train the models: gradient boosting [full (GBf) and reduced (GBr)] and an artificial neural network [full (NNETf) and reduced (NNETr)]. Details regarding GB and NNET are summarized in Supplementary material online, Methods.
Derivation and internal validation of the logistic regression model
All patients in the derivation cohort were used to fit a logistic regression (LR) model. To account for overfitting (optimism), internal validation was performed with a bootstrapping procedure (see Supplementary material online, Methods).
Thresholds for safe discharge were selected to allow a sensitivity and negative predictive value (NPV) higher than 99.5%, based on an international survey of acceptable27 and previous studies on risk stratification thresholds for chest pain.28 This survey defines safe discharge as the possibility of discharging the patient from the ED with a risk of death or MI in the first 90 days of <0.5%.
GRACE and HEART scores
GRACE and HEART scores were calculated as recommended.7 The safe discharge assignment was performed using recommended cut-offs (GRACE for non-ST segment elevation acute coronary syndrome 6 months death/MI: ≤ 77; HEART ≤ 3).8
Single undetectable high-sensitivity cardiac troponin T determination strategy
Patients were triaged to safe discharge if the hs-cTnT concentration at presentation was undetectable (below the LoD; <5 ng/L) and the time since chest pain onset was >3 h.29
External validation
Models were applied and predicted probabilities were calculated for each patient in the APACE cohort. Sample size calculation for external validation of the multivariable models in the APACE cohort was performed following the recommendations by Riley et al.30 (see Supplementary material online, Methods).
Statistical analyses
Model discrimination was assessed by means of the area under the receiving characteristic curve (AUC). Confidence intervals (CIs) of areas under the curve and P values for comparison of AUCs were calculated according to the DeLong method.
To study the performance of the derived safe discharge cut-offs, safety was assessed as the sensitivity and NPV of ruling out the outcome, and efficacy was quantified by the proportion of patients triaged towards safe discharge. All models were compared with the single undetectable hs-cTnT determination strategy (u-cTn).
Subgroup analyses were performed for sex, age, diabetes mellitus, early presenters (≤3 h), and ST deviation. A sensitivity analysis was performed in all patients (e.g. including patients with arrythmia, structural heart disease, or heart failure) arriving to the ED with chest pain and an admission hs-cTnT ≤14 ng/L in the APACE cohort (see Supplementary material online, Figure S3).
A web-based tool can be found at https://fecia82.shinyapps.io/Troponin to calculate individual endpoint probabilities (see Supplementary material online, Figure S4).
Results
Patient characteristics
The derivation cohort comprised 4075 patients of whom 105 (2.6%) developed the primary endpoint [10 deaths (0.2%), 96 MI (2.4%)]. The external validation cohort comprised 3609 patients, of whom 98 (2.7%) suffered the primary endpoint [13 deaths (0.3%), 85 MI (2.4%)]. Both cohorts were comparable for endpoint prevalence, baseline variables (Table 1) and distribution of linear predictors (see Supplementary material online, Figure S5). Training and test sets in the derivation cohort were similar (Table 1). Differences of patients’ characteristics depending on whether they had suffered the endpoint are shown in Supplementary material online, Table S2).
Baseline characteristics
| Overall derivation | Train (derivation) | Test (internal validation) | APACE (external validation) | |
|---|---|---|---|---|
| N = 4075 | N = 3260 | N = 815 | N = 3609 | |
| Age (years) | 56.0 (44.0–68.0) | 55.0 (44.0–68.0) | 57.0 (44.0–69.0) | 54.0 (44.0–66.0) |
| Sex (women) | 1913 (46.9%) | 1546 (47.4%) | 367 (45.0%) | 1287 (35.6%) |
| Hypertension | 1633 (40.1%) | 1298 (39.8%) | 335 (41.1%) | 1699 (47.1%) |
| Hypercholesterolaemia | 1723 (42.3%) | 1362 (41.8%) | 361 (44.3%) | 1395 (38.6%) |
| Diabetes mellitus | 555 (13.6%) | 432 (13.3%) | 123 (15.1%) | 423 (11.7%) |
| Current smokers | 1045 (25.7%) | 829 (25.4%) | 216 (26.5%) | 1041 (28.8%) |
| Previous myocardial infraction | 466 (11.4%) | 367 (11.3%) | 99 (12.1%) | 595 (16.5%) |
| Previous revascularization | 442 (10.8%) | 350 (10.7%) | 92 (11.3%) | 744 (20.6%) |
| Previous stroke | 129 (3.17%) | 104 (3.19%) | 25 (3.07%) | 117 (3.24%) |
| Effort-related chest pain | 455 (11.2%) | 369 (11.3%) | 86 (10.6%) | 196 (33.1%) |
| Recurrent chest pain | 272 (6.67%) | 218 (6.6%) | 54 (6.63%) | 144 (3.99%) |
| hs-cTnT (ng/L) | 5.60 (4.90–8.40) | 5.60 (4.90–8.40) | 5.60 (4.90–8.40) | 5.0 (4.9–8.0) |
| Time from chest pain onset (min) | 270 (162–652) | 270 (160–645) | 272 (171–660) | 330.0 (120.0–1116.0) |
| Early presenters (≤180 min) | 1835 (33.4%) | 1111 (34.5%) | 274 (33.6%) | 1333 (36.9%) |
| Presentation systolic blood pressure (mmHg) | 138 (124–152) | 137 (124–151) | 140 (125–152) | 139.0 (126.0–154.0) |
| Presentation diastolic blood pressure (mmHg) | 80.0 (70.0–89.0) | 80.0 (71.0–89.0) | 80.0 (70.0–89.0) | 82.0 (73.0–91.0) |
| Admission heart rate (beats/min) | 78.0 (68.0–90.0) | 78.0 (68.0–90.0) | 76.0 (66.0–88.0) | 76.0 (66.0–88.0) |
| ST-segment depression >0.5 mm | 143 (3.51%) | 111 (3.40%) | 32 (3.93%) | 105 (2.90%) |
| T-wave inversion >1 mm | 264 (6.48%) | 210 (6.44%) | 54 (6.63%) | 260 (7.20%) |
| Admission atrial fibrillation | 158 (3.88%) | 124 (3.80%) | 34 (4.17%) | 71 (1.97%) |
| Left bundle branch block | 62 (1.52%) | 54 (1.66%) | 8 (0.98%) | 64 (1.77%) |
| Creatinine (mg/dL) | 0.83 (0.71–0.96) | 0.83 (0.71–0.96) | 0.83 (0.71–0.96) | 0.8 (0.7–1.0) |
| Haemoglobin (g/dL) | 14.2 (13.2–15.2) | 14.2 (13.2–15.2) | 14.1 (13.1–15.1) | 14.5 (13.5–15.4) |
| Death or myocardial infarction (90 days) | 105 (2.6%) | 84 (2.6%) | 21 (2.6%) | 98 (2.7%) |
| Death (90 days) | 10 (0.2%) | 9 (0.2%) | 1 (0.1%) | 13 (0.3%) |
| Myocardial infarction (90 days) | 96 (2.4%) | 76 (2.3%) | 20 (2.4%) | 85 (2.4%) |
hs-cTnT, high-sensitivity cardiac troponin T.
Diagnostic performance of the GRACE and HEART scores and the single undetectable high-sensitivity cardiac troponin T determination strategy
The discrimination ability of the GRACE and HEART scores was low-to-moderate [AUC 0.632 (95% CI 0.578–0.686) and 0.758 (95% CI 0.709–0.806), respectively], and both scores showed poor calibration (see Supplementary material online, Figure S6) in the derivation cohort. Sensitivity and NPV for the GRACE score were 66.6 and 98.4% and for the HEART score, they were 69.5 and 98.9%, respectively. The application of u-cTn enabled safe discharge of 29.1% of patients, with a sensitivity and NPV of 97.1 and 99.7%, respectively (see Supplementary material online, Table S3).
Model derivation and internal validation
Models’ performances in the training and test cohorts are shown in Supplementary material online, Table S3. Gradient boosting models had the best discrimination (GBf AUC = 0.928, 95% CI 0.878–0.977; GBr AUC = 0.922, 95% CI 0.867–0.977), higher than NNET and LR (see Supplementary material online, Table S3 and Figure S7). Gradient boosting and reduced model AUCs were similar (see Supplementary material online, Table S4). Diagnostic accuracy of the LR model was high (AUCoptimism-corrected = 0.846) and presented a good calibration. NNET models presented a better calibration than GB models that tended to underestimate risks, mainly for predicted probabilities >5% (see Supplementary material online, Figure S6). A low proportion of patients had a predicted risk >5% [GBf 0.7% (63/815), GBr 0.7% (59/815), NNETf and NNETr 1.1% (94/815); see Supplementary material online, Figure S8].
Variable importance varied by ML model. Time from chest pain onset was the most important variable in GB models but not in NNET or LR. Recurrent chest pain, hs-cTnT concentrations <URL, and ST-segment depression were important variables in all models (see Supplementary material online, Table S5 and Figure 1).
Safe discharge thresholds
The threshold values from the training cohort that achieved the pre-specified NPV >99.5% are shown in Supplementary material online, Table S3. Gradient boosting full was the model that identified a greater proportion (39.63%) of patients for safe discharge. None of the patients identified for safe discharge developed the endpoint (see Supplementary material online, Table S3).
External validation
The main diagnostic performance findings of the external validation for all five derived models are shown in Table 2. Gradient boosting full presented the highest AUC with no differences with GBr [GBfAUC = 0.808 (95% CI 0.769–0.846) vs. GBrAUC = 0.798 (95% CI 0.754–0.841), P = 0.184] but higher than NNETf (see Supplementary material online, Table S6 and Figure 2). Gradient boosting full showed an AUC higher than LR (LRAUC = 0.781, 95% CI 0.736–0.825, P = 0.06). Calibration remained reasonable for GB models [GBf intercept 0.62 (0.41–0.84), slope 0.76 (0.63–0.90)], good for NNET models [NNETr intercept 0.17 (−0.04 to 0.37), slope 1.11 (0.89–1.32)], and LR [intercept 0.16 (−0.05 to 0.37), slope 0.81 (0.65–0.82)]. Within risks between 0 and 5% LR and NNETr presented a very strong agreement between observed and predicted probabilities (Figure 3).
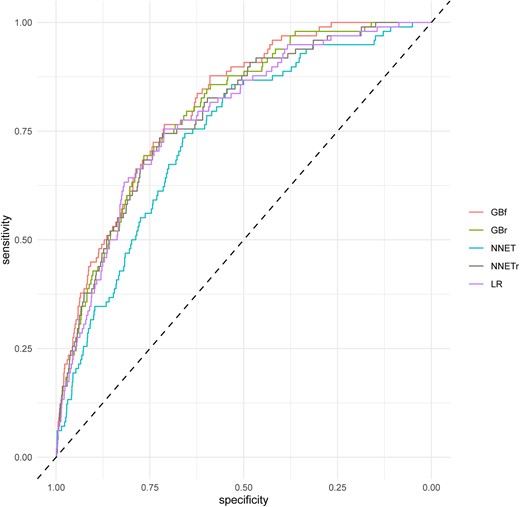
Receiver operating characteristic curves for machine-learning models in the external validation for 90 days death or myocardial infarction. GBf, gradient boosting full; GBr, gradient boosting reduced; NNETf, neural network full; NNETr, neural network reduced; LR, logistic regression.
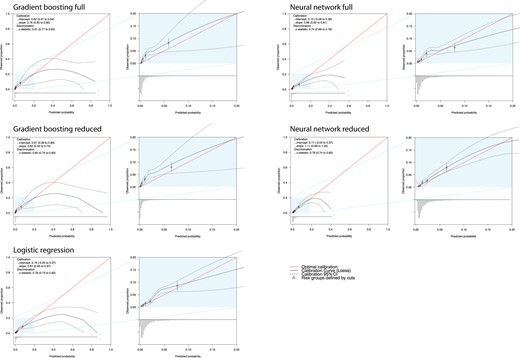
Calibration plots of the developed multivariable prediction models when applied in the external validation set. CI, confidence interval.
The performance of the model in external validation
| HEART score | GRACE score | GBf | GBr | NNETf | NNETr | LR | u-cTn strategy | |
|---|---|---|---|---|---|---|---|---|
| AUC | 0.701 (0.656–0.747) | 0.673 (0.624–0.722) | 0.808 (0.769–0.846) | 0.795 (0.755–0.835) | 0.738 (0.692–0.785) | 0.786 (0.742–0.829) | 0.780 (0.736–0.825) | |
| Safe discharge | 2254 (63.4%) | 2104 (58.3%) | 1324 (36.7%) | 1151 (31.8%) | 970 (26.9%) | 566 (15.7%) | 843 (23.4%) | 890 (27.1%) |
| Death/MI in the safe discharge group | 25 (1.1%) | 38 (1.8%) | 3 (0.22%) | 2 (0.17%) | 5 (0.51%) | 1 (0.17%) | 3 (0.35%) | 3 (0.31%) |
| Sensitivity | 74.5% (64.7–82.8%) | 61.2% (50.8–70.9%) | 96.9% (91.3–99.4%) | 97.9% (92.8–99.7%) | 94.9% (88.5–98.3%) | 98.9% (94.4–99.9%) | 96.9% (91.3–99.4%) | 96.9% (91.3–99.4%) |
| Negative predictive value | 98.9% (98.4–99.3%) | 98.2% (97.5–98.7%) | 99.8% (99.3–99.9%) | 99.8% (99.4–99.9%) | 99.5% (99.3–99.9%) | 99.8% (98.8–99.8%) | 99.64 (99.0–99.9%) | 99.7% (99.1–99.9%) |
| Missed death/MI 90 days/1000 patients | 11 | 38 | 2.2 | 1.7 | 5.1 | 1.7 | 3.5 | 3.1 |
| Calibration intercept | −1.01 | −1.29 | 0.62 | 0.61 | 0.15 | 0.17 | 0.16 | |
| Calibration slope | 0.60 | 1.45 | 0.76 | 0.62 | 0.66 | 1.11 | 0.81 |
AUC, area under the curve; ESC, European Society of Cardiology; GBf, gradient boosting full; GBr, gradient boosting reduced; MI, myocardial infarction; NNETf, neural network full; NNETr, neural network reduced; u-cTn, single hs-cTnT determination strategy.
The diagnostic performance of the safe discharge thresholds calculated in the derivation cohort is summarized in Table 2 and Supplementary material online, Figure S9. Gradient boosting full safely discharged the highest proportion of patients (36.7%, NPV 99.8%, sensitivity 96.9%, missed endpoint occurrences per 1000 patients: 2.2). The application of u-cTn enabled safe discharg of 27.1% of patients, with an NPV and sensitivity of 99.7 and 96.9%, respectively, with a missed endpoint occurrence per 1000 patients of 3.1. Supplementary material online, Table S7 shows patient characteristics of false negatives for each model. The subgroup analysis showed similar NPV and sensitivity performance (see Supplementary material online, Figures S10 and S11).
The sensitivity analysis, externally validating all derived prediction models in an unselected sample, showed a similar performance in comparison (see Supplementary material online, Table S8). Gradient boosting full slightly increased its discrimination performance with an AUC of 0.820, higher than LR (AUC 0.780, P = 0.04).
Discussion
In this study, we developed and externally validated five multivariable models for predicting 90-day all-cause death or MI in patients consulting to the ED with chest pain and a first hs-cTnT concentration in the normal range. We report eight major findings.
First, GRACE and HEART scores had moderate discrimination and poor calibration. All five derived models had better performance. Second, the relative importance of clinical variables in all of our models was high. Clinical assessment in chest pain is paramount to allow a safe discharge,14,19 especially in the context of a first hs-cTnT determination <99th percentile. An outstanding variable was the hs-cTnT at admission, in line with previous studies,19,31 confirming that undetectable concentrations of hs-cTnT19 or detectable but <99th percentile,31 have a significant prognostic value. Third, among the five derived multivariable prediction models, GB models achieved the highest discrimination in the derivation cohort and in the external validation cohort. Although in the derivation cohort GB models had a superior AUC compared with the other models in the external validation cohort, this difference disappears. Fourth, calibration in the external validation was good for the NNETr and LR. For GB models, calibration suggested underestimation and extreme risk predictions. However, agreement between predicted and observed risks was good between 0 and 5%, the range where most of the predicted risks fell in. Fifth, our subgroup analysis presented in Supplementary material online, Figures 10 demonstrated robust performance across a range of patient demographics and clinical scenarios, including variations in sex, age, presence of diabetes mellitus, timing of presentation (≤3 h), and ST deviation. Similarly, sensitivity analysis underscored the stability of our models, even when applied to a broader, non-selected patient population. These findings underscore the generalizable accuracy and safety of our models across diverse conditions and patient profiles. Sixth, all five safe discharge thresholds derived showed a high safety in the external validation cohort. The GBf model achieved the largest proportion of safe discharge (36.7%). Seventh, when compared with the u-cTn, the GBf and GBr models acquired a larger proportion of safe discharge of the patients (27.1 vs. 36.7 vs. 31.8%, respectively), with a comparable safety. This represents an absolute increase of 9.6% in the proportion of patients discharged, which would imply an important reduction in the need for a second hs-cTnT determination and ED resource consumption. Eighth, taking into account discrimination, calibration, and proportion of patients discharged after applying safe discharge thresholds, the GBf model seems to best weight all three performance metrics and provide the best trade-off between safety and efficacy for safe discharge.4
Machine-learning-based models using GB approaches have also been derived for the early diagnosis of NSTEMI among patients presenting to the ED,12 but we are not aware of the derivation of ML models for risk stratification in patients presenting to the ED with a first hs-cTnT concentration <URL. This population have been considered as low risk but around 3% of patients suffer from adverse cardiovascular events at 30 days.4–6 Previous studies have found that measurable hs-cTnT concentrations <URL have important prognostic implications.4,14,32 Therefore, prediction models for this special population are warranted.
The derived models were able to directly discharge up to 37% of patients, with a very high safety. A strategy to safely discharge patients with hs-cTnT < 99th percentile should equilibrate a high proportion of patients to discharge with an optimal safety. Proper safety in this population is not clearly defined. It is generally accepted a sensitivity >99% or NPV >99.5% for 30 days MACE based on a clinical survey.27 We decided to include all-cause death and MI in the endpoint because the objective of this study was to identify patients who can be safely discharged from the ED with a single hs-cTnT determination and not only to rule out MI. Moreover, 90 days is a reasonable time to perform an ischaemia test in case of, despite a very low probability predicted, a high clinical suspicion of ischaemic cause persists.
Reduced GB models (GBr and NNETr) had a good performance in the external validation in terms of discrimination with a similar drop in the AUC than full models and similar calibration. Nevertheless, the proportion of patients for safe rule out was lower (GBf 36.7% vs. GBr 31.8%; NNETf 26.9% vs. NNETr 15.6%). A similar pattern of results was obtained by Than et al.16 when trying to simplify the EDACS. Simplification of clinical prediction models is an attractive approach because it makes the model easier to understand and apply, so more patients can benefit. The need to calculate by hand was one of the major barriers to using models with many variables. This barrier has virtually disappeared, so we think that the application of a more parsimonious approach (changing from 15 to 8 variables) is not worth the drop in the proportion of safe rule out. Nevertheless, both models (GBf and GBr) are available in the web application and risks can be calculated with 8 or 15 variables, depending on the physician’s preferences.
One of the reasons why our model performed better than other scores might be the difference in the derivation of the models in terms of both endpoint and time point. TIMI and GRACE were derived in unstable angina and NSTEMI patients for predicting death or MI in different time points (14 days and 6 months) and the ESC 0–1 h was intended to detect MI at presentation. The HEART score is the most comparable one, in terms of endpoint (death or MI) and time point (30 days) to our models, and therefore had a better performance for the 90-day MACE endpoint. High-sensitivity cardiac troponin T concentrations, even below URL, are known to be associated with poorer outcomes4,32; hence, models for longer term outcome that incorporate hs-cTnT in a continuous manner will perform better. HEART and GRACE do incorporate cTn but categorizing it at the 99th percentile worsens prediction performance. From a methodological/statistical perspective, the comparison is not completely appropriate, as the endpoint and time point differ considerably, hence favouring our newly developed model but GRACE/HEART/u-cTn strategies are being used in current practice for triaging patients arriving to the ED with chest pain.33 Therefore, the comparison has clinical sense because those are the strategies currently used.
The design of these scores with a categorization of continuous variables and rounding odd ratios to get integer points implies a loss of information, and this results in a worsening of the score’s performance.34,35 Internet access and smartphones are widely available and LR or ML algorithms can be easily calculated in a matter of seconds.12 We provide a simple web application (https://fecia82.shinyapps.io/Troponin) that calculates each patient’s risk estimation and returns a recommendation for discharge. It also shows the estimated risk, NPV, and, graphically, the number of patients in each 1000 in which death/MI could occur at 90 days (see Supplementary material online, Figure S4). We opine that showing both clear and unequivocal recommendations for discharge or non-discharge and easily comprehensible risk metrics helps the ED clinician to take rapid and reliable decisions on patients with very low risk.
Despite ML models being considered ‘blackbox’ because they provide a result or reach a decision without explaining or showing how they did so, their utility in healthcare should not be undermined. If a derived ML model consistently proves to be accurate and safe, as shown in our study, it may be embraced despite its inner workings remaining largely unknown. Future advancements in ML and artificial intelligence may benefit from expanding data types to include raw ECG wave data, chest X-ray images, and natural language analysis of clinical notes. However, harnessing such diverse and complex data would require larger sample sizes, emphasizing the importance of hospital information systems as both management and research tools.
Some limitations should be taken into account. First, the retrospective and single-centre nature of the Valencia cohort may introduce selection bias. Nevertheless, baseline characteristics and outcome prevalence in the derivation cohort were comparable with the external validation cohort. Second, a significant number of patients were excluded due to evident non-ischaemic causes of chest pain that could co-exist in patients with MI. Our aim was to assess the risk of chest pain patients with an hs-cTnT <URL to guide a safe discharge from the ED. While waiting for the hs-cTnT determination (turnaround time of 60 min), some diagnosis could arise as evident to the physician. It would make no sense to apply our models to those patients in whom a decision, due to evident and obvious clinical reasons (e.g. more tests, admission), has already been taken. To check for a possible selection bias, a sensitivity analysis was done including all patients with chest pain, which resulted in a good performance of all the models. Third, our endpoint solely incorporated MI and death; therefore, other non-cardiac diagnoses might be overlooked in the process of early ruling out of ACS. These could include acute conditions such as aortic dissection and pulmonary embolism and surgical circumstances such as cholelithiasis or ureteric stone, which might necessitate readmission. Therefore, when applying these algorithms to facilitate safe discharge, both clinicians and patients should be duly counselled, and other important aetiologies should be considered before deciding on patient disposition. It is essential to understand that, while these models confidently rule out death and MI, they cannot offer the same assurance for other potential diseases. This underlines the importance of comprehensive clinical judgement in conjunction with algorithmic assistance. Further studies with big data and ML approaches should take into account multiple diagnoses at complex endpoints. Fourth, all models use two subjective variables (effort-related and recurrent chest pain) that could present a recall bias but were obtained from medical records in the derivation cohort and collected in the ED in the APACE cohort, with a lower risk of recall bias. Nevertheless, clinical variables are extremely important in risk assessment of patients with chest pain and first hs-cTnT <URL,4,6,14,19 and are therefore widely represented in the most used score. Furthermore, those variables presented a high importance (Figure 1) in all our models.
Conclusions
GRACE and HEART scores showed poor performance in patients presenting to the ED with chest pain and a first hs-cTnT concentration <99th percentile. Gradient boosting full could be implemented as a valuable model for decision-making with a single hs-cTnT concentration below URL, achieving a direct discharge triage decision in ∼37% of patients, with a very high safety for death or MI at 90 days.
Supplementary material
Supplementary material is available at European Heart Journal: Acute Cardiovascular Care.
Acknowledgements
The authors are indebted to the patients who participated in the study and to the emergency department staff as well as the laboratory technicians of all participating sites for their most valuable efforts.
Funding
This work was supported by grants from the Ministerio de Economía y Competitividad through the Instituto de Salud Carlos III: CIBERCV 16/11/00420, Madrid, Spain. The APACE was supported by research grants from the Schweizerischer Nationalfonds zur Förderung der Wissenschaftlichen Forschung, the Schweizerische Herzstiftung, the European Union, the Foundation for Cardiovascular Research, the Universitätsspital Basel, the Universität Basel, Abbott Laboratories, Beckman Coulter Foundation, Roche, Ortho Clinical Diagnostics, Quidel, Siemens, and Singulex.
Data availability
The data that support the findings of this study are available from the corresponding author (J.S.) upon reasonable request.
References
Author notes
The first two authors contributed equally to the study and should be considered as first authors.
Conflict of interest: P.L.-A. received research grants from the Swiss Heart Foundation (FF20079 and FF21103) and speaker honoraria from Quidel, paid to the institution, outside the submitted work. L.K. received a research grant from the Swiss Heart Foundation, the University of Basel, the Swiss Academy of Medical Sciences, and the Gottfried and Julia Bangerter-Rhyner Foundation, as well as the ‘Freiwillige Akademische Gesellschaft Basel’, and speaker honoraria from Roche Diagnostics. J.B. received research grants from the University of Basel, the University Hospital of Basel, the Division of Internal Medicine, the Swiss Academy of Medical Sciences, the Gottfried and Julia Bangerter-Rhyner Foundation, and the Swiss National Science Foundation (P500PM_206636), and speaker honoraria from Siemens, Roche Diagnostics, Ortho Clinical Diagnostics, and Quidel Corporation. C.M. received research grants from the Swiss National Science Foundation, the Swiss Heart Foundation, the KTI, the European Union, the University Basel, the University Hospital Basel, Abbott, Astra Zeneca, Beckman Coulter, BRAHMS, Idorsia, Novartis, Ortho Clinical Diagnostics, Quidel, Roche, Siemens, Singulex, and Sphingotec, as well as speaker/consulting honoraria from Astra Zeneca, Bayer, Boehringer Ingelheim, BMS, Daiichi Sankyo, Idorsia, Osler, Novartis, Roche, Sanofi, Siemens, and Singulex, all paid to the institution. The remaining authors have nothing to disclose.

Comments