


Abstract
Pulmonary hypertension (PH) has been consistently associated with adverse outcomes in hospitalized patients. Limited epidemiologic data exist regarding PH in the cardiac intensive care unit (CICU) population. Here, we describe the prevalence, aetiology, and outcomes of PH in the CICU.
Cardiac intensive care unit patients admitted from 2007 to 2018 who had right ventricular systolic pressure (RVSP) measured via transthoracic echocardiography near CICU admission were included. PH was defined as RVSP >35 mmHg, and moderate-to-severe PH as RVSP ≥50 mmHg. Predictors of in-hospital mortality were determined using multivariable logistic regression. Among 5042 patients (mean age 69.4 ± 14.8 years; 41% females), PH was present in 3085 (61%). The majority (68%) of patients with PH had left heart failure, and 29% had lung disease. In-hospital mortality occurred in 8.3% and was more frequent in patients with PH [10.9% vs. 4.2%, adjusted odds ratio (OR) 1.40, 95% confidence interval (CI) 1.03–1.92, P = 0.03], particularly patients with moderate-to-severe PH (14.4% vs. 6.2%, adjusted OR 1.65, 95% CI 1.27–2.14, P < 0.001). In-hospital mortality increased incrementally as a function of higher RVSP (adjusted 1.18 per 10 mmHg increase, 95% CI 1.09–1.28, P < 0.001). Patients with higher RVSP or moderate-to-severe PH had increased in-hospital mortality across admission diagnoses (all P < 0.05).
Pulmonary hypertension is very common in the CICU population and appears to be independently associated with a higher risk of death during hospitalization, although the strength of this association varies according to the underlying admission diagnosis. These data highlight the importance of PH in patients with cardiac critical illness.

Introduction
Pulmonary hypertension (PH), defined by an elevated mean pulmonary artery (PA) pressure, develops as the consequence of a multitude of acute and chronic disease processes.1 Pulmonary hypertension is categorized according to the causative disease process, which forms the basis of the World Health Organization (WHO) classifications, with the most common groups being WHO Group 2 PH resulting from left heart failure (HF) and WHO Group 3 PH from lung diseases and/or hypoxia.1–4 Although disease severity and outcomes differ based on the cause, PH from any aetiology produces adverse effects on the right ventricle (RV) with ultimate development of right HF and death.1,5 While invasive haemodynamic assessment of PA pressures with right heart catheterization remains the gold standard for the diagnosis of PH, PA pressure is most commonly and easily estimated using the right ventricular systolic pressure (RVSP) by Doppler transthoracic echocardiography (TTE) to define PH in clinical practice.1,2,6–8
Studies have found a high prevalence of PH in patients with chronic left heart or lung disease, but PH may be even more common in acutely ill hospitalized patients.4,5,9–17 The presence and severity of PH have been consistently associated with an increased risk of adverse outcomes regardless of the population.4,9–27 The few studies evaluating PH in critically ill populations have shown a substantial prevalence of PH in mixed medical intensive care unit (ICU) patients12 and patients with sepsis.13 No prior studies have systematically examined PH in cardiac ICU (CICU) patients, so we sought to determine the epidemiology of PH as defined using Doppler TTE in CICU patients and to determine the association between elevated RVSP by Doppler TTE and in-hospital mortality across the spectrum of CICU patients.
Methods
Study population
This study was approved by the Institutional Review Board of Mayo Clinic (IRB # 16-000722) as posing minimal risk to patients and was performed under a waiver of informed consent. We retrospectively analysed a database of consecutive unique adult patients aged ≥18 years admitted to the CICU at Mayo Clinic Hospital St. Mary’s Campus between 1 January 2007 and 30 April 2018 to identify patients with a measured RVSP on a clinically indicated TTE performed within 1 day before or after CICU admission.28–30 Patients were excluded if they did not have available TTE data to calculate the RVSP.
Data sources
We electronically extracted demographic, vital sign, laboratory, clinical, and outcome data from the medical record, along with procedures and therapies performed during the CICU and hospital stay.28–37 Invasive haemodynamic data, physical examination, symptoms, imaging, and electrocardiogram data were not available. The admission value of all vital signs, clinical measurements, and laboratory values was defined as either the first value recorded after CICU admission or the value recorded closest to CICU admission.29,30,32,34–37 Admission diagnoses were defined as all International Classification of Diseases (ICD)-9/10 diagnostic codes within one day of CICU admission.28,34,36
Severity of illness scores
The Acute Physiology and Chronic Health Evaluation (APACHE)-III score and Sequential Organ Failure Assessment (SOFA) score were automatically calculated for all patients using data from the first 24 h of CICU admission using previously validated electronic algorithms, with missing data imputed as normal as the standard.28,31–33,36 The Charlson Comorbidity Index (CCI) and individual comorbidities were extracted from the medical record using a previously validated electronic algorithm.29
Echocardiographic data
The Mayo Clinic Echocardiography Database was queried and the TTE performed closest to the day of CICU admission (either before or after) was identified.30,37 Numeric variables were extracted from the database, as listed in Supplementary material online, Table S1. One left ventricular ejection fraction (LVEF) value for each patient was determined using a guideline-recommended hierarchical approach: volumetric LVEF calculated using Simpson’s biplane method was preferred, followed by 2D and linear calculated LVEF, followed by visual estimation if these quantitative methods could be accurately performed.37,38 The presence and severity of left ventricular systolic dysfunction were defined using current American Society for Echocardiography (ASE) criteria.37,38 The right atrial pressure (RAP) was estimated based on the size and collapsibility of the inferior vena cava; however, if an invasive measurement of RAP was available at the time of TTE, this was substituted.8,30 The RVSP was calculated using the RAP and the peak tricuspid regurgitation (TR) velocity measured by continuous wave Doppler using the simplified Bernoulli equation RVSP = RAP + (4 * [peak TR velocity]2) (Supplementary material online, Table S2).8,30 The severity of right ventricular systolic dysfunction (RVD) was graded on a 4-point scale according to ASE guidelines using a multi-parametric approach based on the overall global assessment of function: normal, 0; borderline reduced, 1; mild or mild–moderate dysfunction, 2; moderate or moderate–severe dysfunction, 3; and severe dysfunction, 4.8,38
Definitions of pulmonary hypertension
To define the prevalence of PH in our cohort, we used the 6th World Symposium on Pulmonary Hypertension (WSPH) definition of an estimated RVSP >35 mmHg by TTE to define PH, corresponding to a mean PA pressure >20 mmHg.2 Moderate-to-severe PH was defined as an estimated RVSP ≥50 mmHg, corresponding to a mean PA pressure >30 mmHg.39 To define the aetiology of PH, we attempted to classify patients into WHO Group 2 (PH due to left heart disease), WHO Group 3 (PH due to lung disease and/or hypoxia), concomitant WHO Groups 2 + 3, and other aetiologies (absence of either WHO Group 2 or 3 criteria).2,3 WHO Group 2 included patients with a prior or current diagnosis of HF based on ICD-9/10 codes, an elevated medial mitral E/e′ ratio >15 or an abnormally reduced LVEF per ASE criteria. WHO Group 3 included patients with a prior or current diagnosis of lung disease or a current diagnosis of sleep-disordered breathing based on ICD-9/10 codes. We did not have a satisfactory mechanism to clearly define the presence of Group 1 or Group 4 PH using our available data.2
Statistical analysis
The primary outcome of interest was all-cause in-hospital mortality and the secondary outcome of interest was CICU mortality. To evaluate mortality, patients were separated into three groups: no PH (RVSP <36 mmHg), mild PH (RVSP 36–49 mmHg), and moderate-to-severe PH (RVSP ≥50 mmHg).2,39 Categorical variables are reported as number (percentage) and the Pearson χ2 test was used to compare groups. Continuous variables are reported as mean (±standard deviation) and either Student’s t-test or analysis of variance was used to compare groups, as appropriate. Trends across RVSP groups were analysed using linear regression, treating RVSP group as a continuous variable. Logistic regression was used to estimated odds ratio (OR) and 95% confidence interval (CI) values for variable of interest as predictors of in-hospital mortality, before and after multivariable adjustment. To determine which clinical variables to include in the adjusted regression models, stepwise backward regression was performed to minimize the value of the Akaike Information Criterion (AICc, a measure of deviation from ideal model fit), identifying clinical variables for inclusion in subsequent multivariable regression models (Supplementary material online, Table S3). Receiver-operator characteristic (ROC) curves were constructed to determine area under the ROC curve (AUC, C-statistic) values for discrimination of in-hospital mortality, with AUC values compared using the De Long test. The optimal cut-off for predicting in-hospital mortality was defined as the highest value of Youden’s J index (sensitivity + specificity − 1). All reported P-values are two-tailed. Statistical analyses were performed using JMP Pro version 14.1.0 (SAS Institute, Cary, NC, USA).
Results
Study population
Out of 12 428 potentially eligible unique CICU patient admissions, 3607 were excluded due to lack of an appropriately timed TTE and 3779 more were excluded due to missing data for RVSP, leaving 5042 patients with available RVSP data in the final study population (Figure 1A). Included patients differed from excluded patients (Supplementary material online, Table S4), with older age, more females, slightly higher APACHE-III and SOFA scores and a different distribution of admission diagnoses and use of critical care therapies. The final study population had a mean age of 69.4 ± 14.8 years, of which 2067 (41.0%) were females. Admission diagnoses (not mutually exclusive) included acute coronary syndrome (ACS) in 53.1%, HF in 53.0%, respiratory failure in 27.8%, cardiac arrest in 17.2%, cardiogenic shock in 14.4%, and sepsis in 7.2% (Table 1).
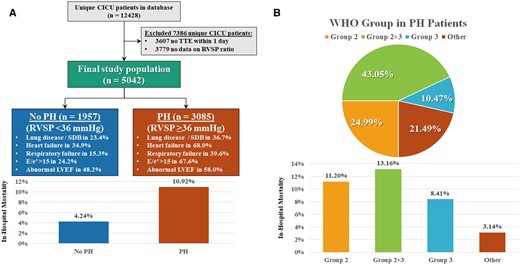
Flow diagram demonstrating study inclusion and exclusion criteria (A), with the prevalence of pulmonary hypertension per World Symposium on Pulmonary Hypertension criteria (estimated right ventricular systolic pressure >35 mmHg), associated in-hospital mortality in the right ventricular systolic pressure groups (P < 0.0001 between groups), and the World Health Organization classification of pulmonary hypertension aetiology among patients with pulmonary hypertension (B), with associated in-hospital mortality in the World Health Organization groups (P < 0.0001 between groups).
Baseline characteristics, comorbidities, admission diagnoses, and therapies of the overall cohort and for patients according to the presence and severity of PH defined by RVSP
| All patients | No PH | Mild PH | Moderate PH | P-value | |
|---|---|---|---|---|---|
| (n = 5042) | (n = 1957) | (n = 1771) | (n = 1314) | ||
| Demographics and outcomes | |||||
| Age | 69.4 ± 14.8 | 65.7 ± 14.9 | 71.0 ± 13.9 | 72.7 ± 14.6 | <0.001 |
| Female sex | 2067 (41.0) | 724 (37.0) | 746 (42.1) | 597 (45.5) | <0.001 |
| White race | 4674 (92.7) | 1819 (93.0) | 1651 (93.2) | 1204 (91.6) | 0.20 |
| Body mass index (kg/m2) | 29.5 ± 7.3 | 29.0 ± 6.1 | 29.7 ± 8.1 | 29.8 ± 7.7 | 0.002 |
| CICU length of stay | 2.6 ± 4.1 | 2.1 ± 2.0 | 2.8 ± 6.0 | 3.1 ± 3.2 | <0.001 |
| Hospital length of stay | 7.6 ± 11.2 | 5.5 ± 6.7 | 8.2 ± 11.9 | 10.0 ± 14.6 | <0.001 |
| CICU mortality | 264 (5.2) | 45 (2.3) | 93 (5.2) | 126 (9.6) | <0.001 |
| Hospital mortality | 420 (8.3) | 83 (4.2) | 148 (8.4) | 189 (14.4) | <0.001 |
| Comorbidities | |||||
| Charlson Comorbidity Index | 2.3 ± 2.6 | 1.7 ± 2.3 | 2.5 ± 2.6 | 3.0 ± 2.7 | <0.001 |
| History of MI | 916 (18.2) | 326 (16.7) | 322 (18.2) | 268 (20.4) | 0.007 |
| History of HF | 922 (18.3) | 192 (9.8) | 336 (19.0) | 394 (30.0) | <0.001 |
| History of stroke | 603 (12.0) | 172 (8.8) | 233 (13.2) | 198 (15.1) | <0.001 |
| History of PVD | 362 (7.2) | 91 (4.7) | 143 (8.1) | 128 (9.7) | <0.001 |
| History of diabetes mellitus | 1423 (28.2) | 426 (21.8) | 520 (29.4) | 477 (36.3) | <0.001 |
| History of liver disease | 77 (1.5) | 22 (1.1) | 29 (1.6) | 26 (2.0) | 0.05 |
| History of cancer | 1108 (22.0) | 360 (18.4) | 439 (24.8) | 309 (23.5) | <0.001 |
| History of COPD | 601 (11.9) | 156 (8.0) | 229 (12.9) | 216 (16.5) | <0.001 |
| History of CKD | 970 (19.3) | 228 (11.7) | 370 (20.9) | 372 (28.3) | <0.001 |
| Prior dialysis | 238 (4.7) | 43 (2.2) | 102 (5.8) | 93 (7.1) | <0.001 |
| Discharge ICD-9/10 for PH | 834 (16.5) | 84 (4.3) | 252 (14.2) | 498 (37.9) | <0.001 |
| Discharge ICD-9/10 for CAD | 3469 (68.8) | 1423 (72.7) | 1237 (69.8) | 809 (61.6) | <0.001 |
| Discharge ICD-9/10 for AF | 1727 (34.3) | 452 (23.1) | 677 (38.2) | 598 (45.5) | <0.001 |
| Discharge ICD-9/10 for valve disease | 1696 (33.6) | 398 (20.3) | 616 (34.8) | 682 (51.9) | <0.001 |
| Sleep disordered breathing | 547 (10.8) | 160 (8.2) | 194 (11.0) | 193 (14.7) | <0.001 |
| Any chronic lung disease | 1234 (24.5) | 348 (17.8) | 449 (25.4) | 437 (33.3) | <0.001 |
| Admission diagnosesa | |||||
| ACS | 2656 (53.1) | 1193 (61.8) | 930 (52.9) | 533 (40.7) | <0.001 |
| HF | 2651 (53.0) | 637 (33.0) | 1021 (58.0) | 993 (75.9) | <0.001 |
| Cardiac arrest | 628 (12.6) | 210 (10.9) | 241 (13.7) | 177 (13.5) | 0.02 |
| Shock | 862 (17.2) | 216 (11.2) | 358 (20.5) | 288 (22.0) | <0.001 |
| Cardiogenic shock | 718 (14.4) | 176 (9.1) | 299 (17.0) | 243 (18.6) | <0.001 |
| Respiratory failure | 1338 (26.8) | 296 (15.3) | 524 (29.8) | 518 (39.6) | <0.001 |
| Sepsis | 360 (7.2) | 79 (4.1) | 159 (9.0) | 122 (9.3) | <0.001 |
| Procedures and therapies | |||||
| Any vasoactive infusions | 1189 (23.6) | 314 (16.0) | 469 (26.5) | 406 (30.9) | <0.001 |
| Vasopressor infusion | 1072 (21.3) | 298 (15.2) | 424 (23.9) | 350 (26.6) | <0.001 |
| Inotrope infusion | 392 (7.8) | 66 (3.4) | 155 (8.8) | 171 (13.0) | <0.001 |
| Any ventilator | 1461 (29.0) | 344 (17.6) | 585 (33.0) | 532 (40.5) | <0.001 |
| Invasive ventilator | 828 (16.4) | 211 (10.8) | 344 (19.4) | 273 (20.8) | <0.001 |
| Within 24 h of admit | 711 (14.1) | 188 (9.6) | 294 (16.6) | 229 (17.4) | <0.001 |
| Non-invasive ventilator | 867 (17.2) | 182 (9.3) | 336 (19.0) | 349 (26.6) | <0.001 |
| Intubation in CICU | 196 (3.9) | 41 (2.1) | 82 (4.6) | 73 (5.6) | <0.001 |
| Dialysis in CICU | 220 (4.4) | 35 (1.8) | 86 (4.9) | 99 (7.5) | <0.001 |
| CRRT | 99 (2.0) | 13 (0.7) | 40 (2.3) | 46 (3.5) | <0.001 |
| IABP in CICU | 469 (9.3) | 158 (8.1) | 191 (10.8) | 120 (9.1) | 0.18 |
| PAC in CICU | 445 (8.8) | 99 (5.1) | 165 (9.3) | 181 (13.8) | <0.001 |
| Coronary angiogram | 3074 (61.0) | 1353 (69.1) | 1061 (59.9) | 660 (50.2) | <0.001 |
| PCI | 1944 (38.6) | 954 (48.8) | 675 (38.1) | 315 (24.0) | <0.001 |
| RBC transfusion | 573 (11.4) | 150 (7.7) | 227 (12.8) | 203 (15.5) | <0.001 |
| In-hospital CPR | 122 (2.4) | 41 (2.1) | 44 (2.5) | 37 (2.8) | 0.19 |
| Severity of illness | |||||
| APACHE-III score | 62.6 ± 24.8 | 54.2 ± 23.4 | 66.0 ± 24.3 | 70.4 ± 24.1 | <0.001 |
| Day 1 SOFA score | 3.6 ± 3.3 | 2.6 ± 2.7 | 3.9 ± 3.3 | 4.7 ± 3.5 | <0.001 |
| Admission Braden score | 17.6 ± 3.4 | 18.4 ± 3.1 | 17.2 ± 3.4 | 16.8 ± 3.3 | <0.001 |
| Admission haemoglobin | 12.1 ± 2.1 | 12.8 ± 1.9 | 11.9 ± 2.2 | 11.4 ± 2.1 | <0.001 |
| Admission eGFR | 64.5 ± 31.5 | 73.5 ± 28.9 | 61.6 ± 30.6 | 54.6 ± 32.7 | <0.001 |
| Admission platelet count | 214.5 ± 85.9 | 218.1 ± 78.5 | 214.2 ± 86.7 | 209.6 ± 94.4 | 0.006 |
No PH was defined as RVSP <36 mmHg, mild PH was defined as RVSP 36–49 mmHg, and moderate PH was defined as RVSP ≥50 mmHg. Data reported as mean ± standard deviation (SD) for continuous variables and number (percent) for categorical variables. P-value is for linear regression (continuous variables) or Cochran–Armitage trend test (categorical variables) across PH groups.
ACS, acute coronary syndrome; AF, atrial fibrillation; APACHE, Acute Physiology and Chronic Health Evaluation; CAD, coronary artery disease; CICU, cardiac intensive care unit; CKD, chronic kidney disease; COPD, chronic obstructive pulmonary disease; CPR, cardiopulmonary resuscitation; CRRT, continuous renal-replacement therapy; eGFR, estimated glomerular filtration rate; HF, heart failure; IABP, intra-aortic balloon pump; MI, myocardial infarction; PAC, pulmonary artery catheter; PCI, percutaneous coronary intervention; PH, pulmonary hypertension; PVD, peripheral vascular disease; RBC, red blood cell; SOFA, Sequential Organ Failure Assessment.
Admission diagnoses are not mutually exclusive and sum to greater than 100%.
Prevalence and aetiology of pulmonary hypertension
A total of 3085 (61.2%) patients had estimated RVSP >35 mmHg and thus met the WSPH definition of PH by TTE (Figure 1A); 1314 (42.6% of patients with PH and 26.1% of all patients) had estimated RVSP ≥50 mmHg and were classified as moderate-to-severe PH, while the remaining 1771 patients (57.4% of patients with PH and 35.1% of all patients) had mild PH. The prevalence and severity of PH varied according to admission diagnosis (Figure 2). Among patients with PH, 28.7% had chronic lung disease, 12.5% had sleep-disordered breathing, and 68.0% had a current or prior diagnosis of HF; 24.3% had a discharge ICD-9/10 diagnosis of PH vs. 4.3% of patients without PH (Table 1). The majority (59.7%) of patients with a discharge ICD-9/10 diagnosis of PH had moderate-to-severe PH. Using the WHO classification, 25.0% of patients with PH had PH due to isolated heart disease (Group 2), 10.5% had PH due to isolated lung disease (Group 3), and 43.0% had both heart disease and lung disease (Group 2 + 3); the remaining 21.5% of patients did not meet criteria for either Group 2 or 3 (Figure 1B).
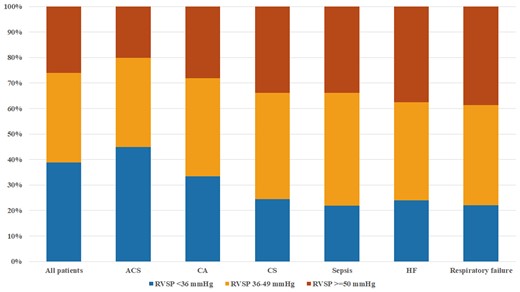
Distribution of right ventricular systolic pressure groups in the final study population, based on admission diagnosis. Note that admission diagnosis groups are not mutually exclusive.
Clinical characteristics of patients with pulmonary hypertension
Patients with PH had greater severity of illness, more comorbidities and greater use of critical care therapies than patients without PH (Supplementary material online, Table S5). As the severity of PH increased (Table 1), patients were older with an increasing prevalence of female sex, higher illness severity scores, greater comorbidity burden (including HF and lung disease), and had greater use of positive-pressure ventilation and vasoactive drugs. In addition, admission diagnoses shifted from predominantly ACS to predominantly HF, with an increasing prevalence of critical care diagnoses and less use of coronary angiography and percutaneous coronary intervention.
Echocardiographic findings
The mean RVSP was 42.2 ± 15.2 mmHg, based on a mean RAP of 10.1 ± 5.3 mmHg and a mean peak TR velocity of 2.8 ± 0.5 m/s. The peak TR velocity was >2.8 m/s in 2035 (40.4%) of patients, including 1660 (32.9%) with a peak TR velocity ≥3 m/s and 136 (2.7%) with a peak TR velocity ≥4 m/s. Among the 3238 (64.2%) patients who had qualitative right ventricular systolic function reported 39.1% had normal or borderline right ventricular systolic function, 29.9% had mild RVD, and 31.0% had moderate or severe RVD. The prevalence of RVD increased with the severity of PH (Table 2). Among patients with PH, 59.5% had abnormal LVEF by ASE criteria and 56.3% of patients with a reported medial mitral E/e′ ratio (n = 3839, 76.1%) had an abnormally elevated value >15. The severity of PH, RVD, and RV-PA uncoupling varied according to WHO PH group, being worst in patients with concomitant WHO Group 2 + 3 PH followed by WHO Group 2 PH and best in unclassified PH (data not shown). Left ventricular systolic and diastolic function worsened (e.g. lower LVEF, higher E/e′ ratio), as did markers of right ventricular function, pulmonary haemodynamics and systemic haemodynamics, with increasing severity of PH (Table 2).
Echocardiographic findings of patients overall and according to the presence and severity of PH defined by RVSP
| n with data | All patients | No PH | Mild PH | Moderate PH | P-value | |
|---|---|---|---|---|---|---|
| (n = 5042) | (n = 1957) | (n = 1771) | (n = 1314) | |||
| Vitals signs at time of TTE | ||||||
| TTE on day of CICU admission | 5042 | 2383 (47.3) | 870 (44.5) | 848 (47.9) | 665 (50.6) | <0.001 |
| Systolic BP (mmHg) | 4939 | 116.9 ± 21.7 | 116.3 ± 20.5 | 116.2 ± 21.9 | 118.8 ± 23.2 | 0.003 |
| Diastolic BP (mmHg) | 4935 | 64.5 ± 14.2 | 66.0 ± 13.6 | 63.5 ± 14.4 | 63.7 ± 14.7 | <0.001 |
| Mean BP (mmHg) | 4935 | 82.0 ± 14.4 | 82.7 ± 13.9 | 81.1 ± 14.5 | 82.1 ± 14.9 | 0.10 |
| Heart rate | 4815 | 76.3 ± 19.1 | 72.6 ± 16.8 | 77.6 ± 19.8 | 80.0 ± 20.6 | <0.001 |
| Shock index | 4765 | 0.7 ± 0.3 | 0.7 ± 0.3 | 0.7 ± 0.3 | 0.7 ± 0.2 | <0.001 |
| Atrial fibrillation | 4610 | 737 (16.0) | 165 (9.0) | 281 (17.5) | 291 (24.8) | <0.001 |
| Left ventricular structure and systolic function | ||||||
| LVIDd (mm) | 4687 | 51.7 ± 8.7 | 50.4 ± 7.1 | 52.3 ± 8.7 | 53.0 ± 10.5 | <0.001 |
| Relative wall thickness | 4116 | 0.43 ± 0.11 | 0.43 ± 0.09 | 0.43 ± 0.11 | 0.43 ± 0.13 | 0.44 |
| LV mass index (g/m2) | 4074 | 111.6 ± 35.9 | 103.5 ± 29.0 | 113.7 ± 35.6 | 122.0 ± 42.9 | <0.001 |
| LVEF (%) | 4971 | 47.1 ± 16.6 | 50.2 ± 14.6 | 45.0 ± 16.9 | 45.5 ± 18.2 | <0.001 |
| Reduced LVEFa | 4971 | 2739 (55.1) | 933 (48.2) | 1062 (60.6) | 744 (58.0) | <0.001 |
| Mild | 970 (19.5) | 436 (22.5) | 329 (18.8) | 205 (16.0) | <0.001 | |
| Moderate | 901 (18.1) | 297 (15.3) | 356 (20.3) | 248 (19.3) | ||
| Severe | 868 (17.5) | 200 (10.3) | 377 (21.5) | 291 (22.7) | ||
| Wall motion score index | 3098 | 1.8 ± 0.5 | 1.7 ± 0.5 | 1.9 ± 0.5 | 2.0 ± 0.5 | <0.001 |
| Systemic haemodynamics | ||||||
| LVOT VTI (cm) | 4541 | 19.5 ± 5.3 | 20.1 ± 4.6 | 19.3 ± 5.5 | 18.8 ± 6.0 | <0.001 |
| SVI (mL/m2) | 4465 | 39.6 ± 11.6 | 41.2 ± 10.2 | 38.8 ± 11.9 | 38.0 ± 12.7 | <0.001 |
| LVSWI (g*min/m2) | 3577 | 37.0 ± 13.9 | 39.9 ± 13.0 | 35.4 ± 14.1 | 33.9 ± 14.3 | <0.001 |
| MCF | 3863 | 0.41 ± 0.16 | 0.45 ± 0.15 | 0.39 ± 0.16 | 0.36 ± 0.16 | <0.001 |
| CI (L/min/m2) | 4427 | 2.9 ± 0.8 | 2.9 ± 0.7 | 2.8 ± 0.8 | 2.9 ± 0.9 | 0.59 |
| Pressure-adjusted heart rate | 4762 | 10.0 ± 7.0 | 6.1 ± 4.2 | 11.1 ± 7.1 | 14.4 ± 7.1 | <0.001 |
| Left ventricular diastolic function | ||||||
| Mitral E velocity (m/s) | 4037 | 0.9 ± 0.3 | 0.7 ± 0.2 | 0.9 ± 0.3 | 1.0 ± 0.4 | <0.001 |
| Mitral E/A ratio | 3216 | 1.2 ± 0.7 | 1.1 ± 0.5 | 1.3 ± 0.7 | 1.6 ± 1.0 | <0.001 |
| Medial mitral e′ (cm/s) | 4036 | 5.9 ± 2.4 | 6.4 ± 2.3 | 5.8 ± 2.4 | 5.4 ± 2.4 | <0.001 |
| Medial mitral E/e′ ratio | 3839 | 16.5 ± 9.3 | 13.0 ± 6.3 | 17.4 ± 9.1 | 21.9 ± 11.2 | <0.001 |
| Deceleration time (ms) | 3500 | 189.9 ± 55.0 | 203.0 ± 53.1 | 186.0 ± 55.5 | 170.7 ± 51.2 | <0.001 |
| Right ventricular function | ||||||
| RV dysfunction | 3238 | 1973 (60.9) | 500 (46.0) | 732 (62.8) | 741 (75.2) | <0.001 |
| Mild | 969 (29.9) | 305 (28.1) | 362 (31.0) | 302 (30.7) | ||
| Moderate | 812 (25.1) | 161 (14.8) | 309 (26.5) | 342 (34.7) | ||
| Severe | 192 (5.9) | 34 (3.1) | 61 (5.2) | 97 (9.8) | ||
| Estimated RAP (mmHg) | 5042 | 10.1 ± 5.3 | 6.6 ± 3.1 | 10.9 ± 5.1 | 14.1 ± 4.6 | <0.001 |
| Peak TR velocity (m/s) | 5042 | 2.8 ± 0.5 | 2.3 ± 0.2 | 2.8 ± 0.3 | 3.4 ± 0.4 | <0.001 |
| >2.8 m/s | 2035 (40.4) | 0 (0) | 763 (43.1) | 1272 (96.8) | ||
| ≥3 m/s | 1660 (32.9) | 0 (0) | 439 (24.8) | 1221 (92.9) | ||
| ≥4 m/s | 136 (2.7) | 0 (0) | 0 (0) | 136 (10.4%) | ||
| Estimated RVSP (mmHg) | 5042 | 42.2 ± 15.2 | 28.8 ± 4.1 | 42.0 ± 4.0 | 62.2 ± 12.9 | <0.001 |
| RVSP/SBP | 4939 | 0.37 ± 0.17 | 0.26 ± 0.10 | 0.38 ± 0.12 | 0.54 ± 0.15 | <0.001 |
| PA elastance | 4508 | 0.62 ± 0.37 | 0.39 ± 0.16 | 0.63 ± 0.25 | 0.97 ± 0.46 | <0.001 |
| Tricuspid annulus velocity (cm/s) | 3498 | 11.3 ± 3.5 | 11.8 ± 3.2 | 11.2 ± 3.6 | 10.7 ± 3.7 | <0.001 |
| TAPSE (mm) | 1054 | 17.4 ± 5.4 | 18.7 ± 5.3 | 16.9 ± 5.4 | 16.4 ± 5.2 | <0.001 |
| TASV/TRV | 3498 | 4.2 ± 1.5 | 5.0 ± 1.3 | 4.0 ± 1.2 | 3.1 ± 1.1 | <0.001 |
| TASV/RVSP | 3498 | 0.31 ± 0.14 | 0.42 ± 0.13 | 0.27 ± 0.09 | 0.18 ± 0.07 | <0.001 |
| TAPSE/RVSP | 1054 | 0.45 ± 0.23 | 0.67 ± 0.21 | 0.40 ± 0.13 | 0.26 ± 0.10 | <0.001 |
No PH was defined as RVSP <36 mmHg, mild PH was defined as RVSP 36–49 mmHg, and moderate PH was defined as RVSP ≥50 mmHg. Data reported as mean ± standard deviation (SD) for continuous variables and number (percent) for categorical variables. P-value is for linear regression (continuous variables) or Cochran–Armitage trend test (categorical variables) across RVSP groups.
BMI, body mass index; BP, blood pressure; CO, cardiac output; CI, cardiac index, CPO, cardiac power output; LVEF, left ventricular ejection fraction; LVOT, left ventricular outflow tract; LVSW, left ventricular stroke work; LVSWI, left ventricular stroke work index; PA, pulmonary artery; RAP, right atrial pressure; RVSP, right ventricular systolic pressure; SV, stroke volume; SVI, stroke volume index; TAPSE, tricuspid annular plane systolic excursion; TASV, tricuspid annulus systolic s’ tissue Doppler velocity; TR, tricuspid regurgitation; TTE, transthoracic echocardiogram; VTI, velocity-time integral.
Cut-offs for reduced LVEF are based on ASE guidelines.
In-hospital mortality—unadjusted analyses
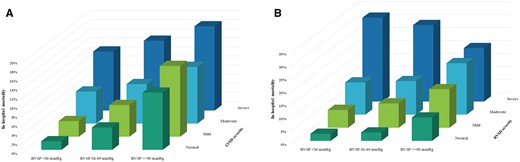
A total of 420 (8.3%) patients died during hospitalization. Patients with PH had higher observed in-hospital mortality (10.9% vs. 4.2%, unadjusted OR 2.77, 95% CI 2.16–3.55, P < 0.001; Figure 1A), as did patients with moderate-to-severe PH (14.4% vs. 6.2%, unadjusted OR 2.54, 95% CI 2.07–3.12, P < 0.0001). In-hospital mortality varied according to the PH aetiology group classification (Figure 1B). In-hospital mortality also varied according to admission diagnosis and the presence (Figure 3A) and severity (Figure 3B) of PH. In-hospital mortality increased progressively with a higher RVSP (Figure 4). Each 10 mmHg increase in RVSP was associated with a 33% higher risk of in-hospital mortality (unadjusted OR 1.325, 95% CI 1.253–1.401, P < 0.001; discrimination C-statistic 0.65). The strength of association between any PH, moderate-to-severe PH and estimated RVSP with in-hospital mortality varied by admission diagnosis, being strongest among patients with ACS (Table 3). A gradient of in-hospital mortality was observed as a function of PH group and either the LVEF (Figure 5A) or the severity of RVD (Figure 5B); in-hospital mortality decreased with rising RVSP among patients with severe RVD.
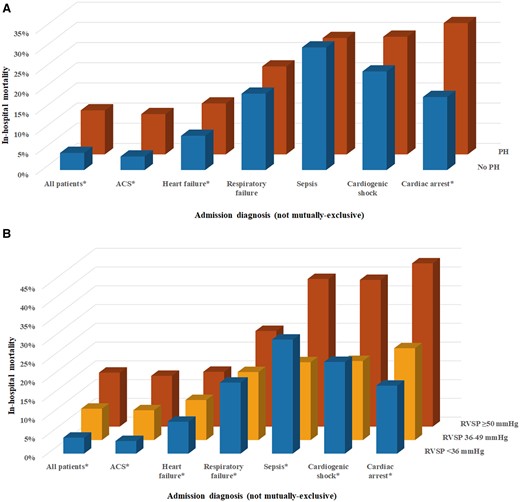
In-hospital mortality in patients with and without pulmonary hypertension (A) and as a function of pulmonary hypertension severity based on estimated right ventricular systolic pressure (B) in patients with each admission diagnosis. Note that admission diagnosis groups are not mutually exclusive. *P < 0.01 for between-groups comparison. ACS, acute coronary syndrome.
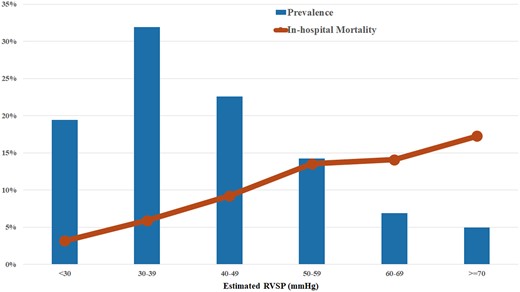
In-hospital mortality as a function of estimated right ventricular systolic pressure (line), with the associated prevalence of each right ventricular systolic pressure group (bars).
In-hospital mortality as a function of right ventricular systolic pressure group and the severity of left ventricular systolic dysfunction based on left ventricular ejection fraction per American Society for Echocardiography guidelines (A) and semi-quantitative right ventricular systolic dysfunction based on overall global assessment (B).
Unadjusted associations between PH (defined as RVSP >35 mmHg), moderate-to-severe PH (defined as RVSP ≥50 mmHg), and RVSP (per 10 mmHg) with in-hospital mortality as a function of admission diagnosis
| Any PH | Moderate-to-severe PH | Estimated RVSP | ||||
|---|---|---|---|---|---|---|
| (RVSP >35 mmHg) | (RVSP ≥50 mmHg) | (per 10 mmHg) | ||||
| Admission diagnosis | OR (95% CI) | P-value | OR (95% CI) | P-value | OR (95% CI) | P-value |
| All patients | 2.77 (2.16–3.55) | <0.0001 | 2.54 (2.07–3.12) | <0.0001 | 1.32 (1.25–1.40) | <0.0001 |
| ACS | 3.20 (2.23–4.57) | <0.0001 | 2.75 (2.01–3.76) | <0.0001 | 1.48 (1.34–1.64) | <0.0001 |
| HF | 1.56 (1.14–2.12) | 0.0048 | 1.57 (1.23–1.99) | 0.0002 | 1.14 (1.06–1.22) | 0.0003 |
| Respiratory failure | 1.19 (0.86–1.65) | 0.2819 | 1.52 (1.16–1.97) | 0.0021 | 1.12 (1.03–1.22) | 0.0082 |
| Sepsis | 0.93 (0.54–1.60) | 0.7889 | 2.06 (1.29–3.29) | 0.0026 | 1.18 (1.00–1.39) | 0.0443 |
| Cardiogenic shock | 1.27 (0.86–1.88) | 0.2212 | 2.23 (1.60–3.13) | <0.0001 | 1.22 (1.09–1.35) | 0.0005 |
| Cardiac arrest | 2.18 (1.45–3.28) | 0.0002 | 2.81 (1.94–4.08) | <0.0001 | 1.41 (1.25–1.58) | <0.0001 |
Data displayed as unadjusted odds ratio (OR) and 95% confidence interval (CI) values for prediction of in-hospital mortality by logistic regression. Note that admission diagnoses are not mutually exclusive.
In-hospital mortality—multivariable-adjusted analysis
After multivariable adjustment, patients with PH (estimated RVSP >35 mmHg) had a higher risk of in-hospital death (adjusted OR 1.405, 95% CI 1.029–1.918, P = 0.03), particularly patients with moderate-to-severe PH (14.4% vs. 6.2%, adjusted OR 1.65, 95% CI 1.27–2.14, P < 0.001). Likewise, a higher RVSP remained associated with an increased risk of in-hospital mortality (adjusted OR per 10 mmHg higher 1.184, 95% CI 1.094–1.283, P < 0.001). Patients with moderate-to-severe PH had higher in-hospital mortality than patients with either mild PH (adjusted OR 1.58, 95% CI 1.19–2.09, P = 0.002) or no PH (adjusted OR 1.80, 95% CI 1.27–2.54, P < 0.001), but there was no difference between patients with mild PH and no PH (adjusted OR 1.140, 95% CI 0.810–1.605, P = 0.45). After adjustment, greater severity of RVD was associated with higher risk of in-hospital mortality (adjusted OR per grade 1.288, 95% CI 1.139–1.457, P < 0.0001).
Discussion
Using Doppler TTE, we identified PH (predominantly due to left heart disease) in more than half of our cohort of more than 5000 CICU patients, with more than one-quarter of these patients having moderate-to-severe PH, defined by an estimated RVSP ≥50 mmHg. Patients with more severe PH and RVD displayed a higher risk of dying during hospitalization, even after adjustment for illness severity. Although the more inclusive WSPH echocardiographic definition of PH (i.e. RVSP >35 mmHg, a threshold designed for screening to identify patients who may warrant further testing) was not associated with higher mortality across all admission diagnoses, patients meeting criteria for moderate-to-severe PH were uniformly at elevated risk. This study emphasizes the importance of TTE-defined PH as a predictor of outcome in CICU patients and highlights the usefulness of performing haemodynamic-focused Doppler TTE for mortality risk stratification beyond the simple visual assessment of RVD.
Epidemiology of pulmonary hypertension in critically ill patients
Epidemiologic studies of PH in the ICU are sparse, with predictors of PH in critically ill patients including reduced LVEF, pulmonary embolism, and respiratory failure.5,12,13 Our CICU patients with PH were sicker than those with normal RVSP, with more acute presentations, more extensive comorbidities, greater illness severity, and higher utilization of critical care therapies. Using a simplified approach to classification of PH aetiology, we found that approximately two-thirds of CICU patients with PH had left HF (with or without hypoxaemia or lung disease) as the mechanism, and these patients had worse PH, RVD, and RV-PA coupling associated with higher mortality. About one-third of remaining patients had hypoxaemia or lung disease, and about one-quarter of patients with PH did not have documented evidence of either left heart disease or lung disease; this latter group had low in-hospital mortality, reflecting their less severe PH and RVD with better RV-PA coupling. We could not determine with certainty the proportion of patients with pulmonary arterial hypertension (WHO Group 1) or PH due to pulmonary thromboembolic disease (WHO Group 4). While it is tempting to speculate how identification of PH by TTE could influence clinical decision-making in CICU patients, the heterogeneity of the CICU PH cohort necessitates further diagnostic testing to identify the underlying cause(s) before treatments (particularly PH-specific therapies) can be instituted.
Mortality associated with pulmonary hypertension in hospitalized patients
An elevated RVSP by Doppler TTE has been consistently associated with adverse outcomes in the vast majority of studied cohorts, and even minimal elevations in PA pressures may be associated with elevated risk.19,24 The presence of PH in ICU patients with sepsis, acute respiratory distress infection, or coronavirus disease-19 infection is associated with poor outcomes.9,12,13,23 In mixed medical ICU patients, 42% had PH by Doppler TTE and this was associated with a higher risk of short-term mortality.12 Among ICU patients with sepsis, 34% had PH by Doppler TTE and these patients had higher short-term and long-term mortality.13 Among patients with acute and chronic HF, both PH and RVD are associated with a higher risk of adverse outcomes including death and hospitalization.10,11,14–16,18,20–22,40–42 The association between PH and mortality varied according to admission diagnosis in our study, suggesting that the optimal cut-off for defining prognostically important PH may differ across patient groups; ACS patients had the greatest adverse prognostic impact of PH, while only more severe PH appeared prognostically relevant in critical illnesses such as cardiogenic shock or sepsis. Prior studies have shown a higher risk of death, kidney injury, and HF among ACS patients with elevated PA pressures.17,25–27 Although RVSP remained associated with in-hospital mortality when added to the APACHE-III score and other clinical variables, its stand-alone discrimination is inferior to the APACHE-III or SOFA scores.28,31,32,36
Mortality associated with right ventricular systolic dysfunction in hospitalized patients
The association between RVD and clinical outcomes in CICU patients with and without PH is complex. In severe right ventricular failure including end-stage HF, an elevated RVSP may lose its predictive values because the failing RV cannot generate an adequate stroke volume to produce an elevated RVSP, such that patients with higher RVSP paradoxically display better outcomes; we observed a similar phenomenon among our patients with severe RVD.43 We have recently observed that RVD (with or without reduced LVEF) is associated with worse outcomes in CICU patients and patients with cardiogenic shock independent of shock severity.44,45 Our prior work has demonstrated that indexing the RVSP to the longitudinal motion of the RV, as quantified using the tricuspid annulus systolic (s′) tissue Doppler velocity (TASV), creates an important TTE predictor of mortality in CICU patients reflecting RV-PA coupling.30 Because we did not have data on TTE measures of RVD, this limited our ability to disentangle the prognostic effects of RVD and PH per se.
Limitations of right ventricular systolic pressure estimation by transthoracic echocardiography
The use of Doppler TTE to diagnose PH in the ICU carries a number of important caveats, and correlations between invasively measured and TTE-estimated PA pressures are imperfect.7 Right ventricular systolic pressure can only be estimated in patients with an adequate TR Doppler envelope and may be underestimated in patients without TR and among those with torrential TR.8 Inaccurate estimation of RAP could lead to misclassification of PH, particularly among patients with very high RAP or for patients receiving positive-pressure ventilation; we could not determine which patients had an invasive RAP measurement versus TTE-estimated RAP.8 The presence of elevated RVSP during acute illness does not necessarily reflect the presence of true underlying chronic PH or pulmonary vascular disease because PA pressures are flow dependent and can be influenced by a variety of clinical factors including left heart pressures, anaemia, acidaemia, hypoxaemia, hypercarbia, positive-pressure ventilation, atrial fibrillation, and the effects of vasoactive drugs, all of which varied across our RVSP groups. We could not distinguish acute and potentially transient elevations in RVSP occurring during hospitalization from chronic and potentially longstanding elevations in RVSP resulting from pre-existing conditions; as such, we combined patients with both acute and chronic RVSP elevations, and it is probable that their prognosis differs. More than one-third of PH patients received positive-pressure ventilation, but we could not determine which patients were mechanically ventilated at the time of TTE. Given the absence of invasive haemodynamic data, we cannot confirm the accuracy of our non-invasive RVSP estimates or determine how many of our patients had pre-capillary vs. post-capillary PH.2
Limitations of this study
As with all single-centre retrospective cohort studies, we cannot be sure that the results of this analysis are applicable to other dissimilar populations. We cannot exclude the possibility that residual confounding contributed to the observed association between PH and mortality, precluding assessment of causality. The TTE data analysed in this study were clinically indicated rather than performed as part of a research protocol, thus analysis is limited to the data that were measured and reported for clinical purposes. Many patients were excluded due to lack of available data, which was probably determined by factors including illness severity and clinical stability that may have influenced the ability to assess other TTE variables including markers of right ventricular function; we observed systematic differences between included and excluded patients, which could have resulted in selection bias.
Conclusions
Pulmonary hypertension frequently complicates the course of cardiovascular critical illness and impacts CICU outcomes and resource utilization across common admission diagnoses (particularly for patients with ACS). This study reveals a high prevalence of PH due to left heart disease in the CICU population and both higher RVSP and worse RVD strongly predict mortality. Further study is required to determine the optimal approach to diagnostic testing and treatment for PH and RVD identified by TTE in the CICU setting.
Supplementary material
Supplementary material is available at European Heart Journal: Acute Cardiovascular Care online.
Data availability statement
The data underlying this article are available in the article and in its online supplementary material.
Acknowledgement
The views expressed in this manuscript are the authors’ own, and do not represent the National Institutes of Health or the United States Federal Government in any way.
Funding
No extramural funding source was involved in the conduct of this research. M.A.S. receives research support from the National Institutes of Health Clinical Center intramural research funds.
Conflict of interest: None of the authors has a significant conflict of interest related to this research.

Comments