


Abstract
This study tested the hypothesis that combining stress-induced biomarkers (copeptin or glucose) with high-sensitivity cardiac troponin (hs-cTn) increases diagnostic accuracy for non-ST-elevation myocardial infarction (NSTEMI) in patients presenting to the emergency department.
The ability to rule-out NSTEMI for combinations of baseline hs-cTnT or hs-cTnI with copeptin or glucose was compared with the European Society of Cardiology (ESC) hs-cTnT/I-only rule-out algorithms in two independent (one Norwegian and one international multicentre) diagnostic studies. Among 959 patients (median age 64 years, 60.5% male) with suspected NSTEMI in the Norwegian cohort, 13% had NSTEMI. Adding copeptin or glucose to hs-cTnT/I as a continuous variable did not improve discrimination as quantified by the area under the curve {e.g. hs-cTnT/copeptin 0.91 [95% confidence interval (CI) 0.89–0.93] vs. hs-cTnT alone 0.91 (95% CI 0.89–0.93); hs-cTnI/copeptin 0.85 (95% CI 0.82–0.87) vs. hs-cTnI alone 0.93 (95% CI 0.91–0.95)}, nor did adding copeptin <9 mmol/L or glucose <5.6 mmol/L increase the sensitivity of the rule-out provided by hs-cTnT <5 ng/L or hs-cTnI <4 ng/L in patients presenting more than 3 h after chest pain onset (target population in the ESC-0 h-algorithm). The combination decreased rule-out efficacy significantly (both P < 0.01). These findings were confirmed among 1272 patients (median age 62 years, 69.3% male) with suspected NSTEMI in the international validation cohort, of which 20.7% had NSTEMI. A trend towards increased sensitivity for the hs-cTnT/I/copeptin combinations (97–100% vs. 91–97% for the ESC-0 h-rule-out cut-offs) was observed in the Norwegian cohort.
Adding copeptin or glucose to hs-cTnT/I did not increase diagnostic performance when compared with current ESC guideline hs-cTnT/I-only 0 h-algorithms.

Introduction
Patients being evaluated for suspected acute coronary heart disease comprise ∼10% of emergency department (ED) admissions,1,2 but only a proportion of patients (10–30%) are eventually diagnosed with an acute coronary syndrome (ACS).3–5
The European Society of Cardiology (ESC) has published guidelines for the rapid evaluation of possible non-ST-elevation myocardial infarction (NSTEMI).5 The 2020 guidelines suggest that patients presenting >3 h after the onset of symptoms with very low levels of cardiac troponins measured with high-sensitivity assays (hs-cTn) on admission could be eligible for early rule-out if the clinical suspicion of NSTEMI is low.
Up to 40% of patients are early presenters who require evaluation based on both baseline and follow-up blood draws after 1 or 2 h.5 This implies that these patients are diagnostically undefined for up to 2–3 h after admission, which is a logistical challenge in often overcrowded EDs. Improving the current ESC algorithms by increasing the number of patients in whom NSTEMI is quickly ruled out with the presentation sample would be beneficial both diagnostically and economically. Earlier studies have suggested that combining cTn measured with contemporary (i.e. not high-sensitivity) assays and stress biomarkers like copeptin or glucose could have the potential to provide a rule-out for NSTEMI based on a single admission sample.6,7 Copeptin itself is a non-specific marker, influenced by e.g. hydration levels, blood pressure, and kidney function.8 It is not released from the myocardium during ischaemia,9,10 but has still been proposed as a surrogate marker of ischaemia due to its rapid increase during high-level endogenous stress.11,12 The ESC guidelines suggest that copeptin may be measured in combination with contemporary cTn assays to rule-out NSTEMI, but state that studies thus far have shown conflicting evidence regarding the benefit of adding copeptin to hs-cTn in rule-out algorithms. Thus, the latest ESC 2020 guidelines do not recommend their routine measure in addition to hs-cTn.5,7,13
Similarly, increased glucose concentrations are common during NSTEMI, although the mechanism is unclear.14 Studies by Shortt et al.15 and Greenslade et al.16 have recently suggested that glucose in combination with hs-cTn could provide sensitive rule-out algorithms based on a single measurement. As glucose measurements are much more widely and more rapidly available, as well as less costly than copeptin, using glucose as a stress marker has particular appeal. However, the performance of glucose measurements relative to copeptin measurements remains unclear.
The aim of this study was therefore to test the hypothesis that admission measurements of hs-cTnT/I in combination with copeptin or glucose could enhance accuracy for the rule-out of NSTEMI.
Methods
Study design
The WESTCOR study (Clinical Trials number NCT02620202) is a two-centre, cross-sectional, prospective observational study described in detail earlier.17 The current paper reports data from the WESTCOR derivation cohort (WESTCOR-D) including patients admitted to Haukeland University Hospital (Bergen, Norway), with suspected NSTE-ACS in the period from 2015 to 2017. The study and biobank were approved by the Regional Committees for Medical and Health Research Ethics (2014/1365 REK West and 2014/1905 REK West).
Study enrolment
Patients were eligible for inclusion if they were ≥18 years, referred with chest pain or symptoms suggestive of NSTE-ACS, did not have a shortened life expectancy due to a coexisting condition (e.g. advanced cancer), and could provide informed consent.17 In total, 959 consenting patients fulfilled all criteria and had sufficient biomaterial for analysis.
Biochemical analyses
Blood samples were drawn shortly after arrival at the ED; and after 1, 3, and 8–12 h. The samples were processed and stored at −80°C. Hs-cTnT was measured in fresh admission serum samples using the Roche Diagnostics hs-cTnT assay, while hs-cTnI was measured in biobanked samples using the Abbott Diagnostics hs-cTnI assay.18 Copeptin was measured in biobanked serum samples using the ThermoFisher assay Copeptin proAVP on Kryptor Compact Plus. Glucose was measured using the glucose oxidation method on Cobas 8000 from Roche Diagnostics. The glomerular filtration rate was estimated using the CKD-EPI (Chronic Kidney Disease Epidemiology Collaboration) formula. Further details are provided in Supplementary material online, Data.
Diagnosis
The diagnostic endpoint was NSTEMI during the index hospitalization. The adjudicating process has been described earlier.17 Briefly, two independent cardiologists classified the final diagnosis, while a third cardiologist adjudicated disagreements. NSTEMI was defined according to the third universal definition for myocardial infarction (MI), including a significant rise or fall of hs-cTn with at least one value above the 99th percentile combined with symptoms of ischaemia, electrocardiogram changes, and image evidence of loss of viable myocardium or intracoronary thrombus.19
High-sensitivity cTnT was the only troponin assay used during adjudication. As suggested by the ESC in 2012, delta values of 20% (baseline hs-cTnT concentration >14 ng/L) or 50% (baseline hs-cTnT concentration ≤14 ng/L) in serial hs-cTnT measurements were regarded as significant.19 Further information on the diagnostic process is presented in the Supplementary material online, Data.
Comparator algorithms
The ESC algorithms encompass an initial review of the admission hs-cTn level in patients who are present more than 3 h after symptom onset.5 If the concentration of hs-cTn is considered ‘very low’ the patient could be eligible for ‘rule-out’ and may be discharged if the ECG and/or clinical symptoms suggest a low likelihood of ACS.5 Based on the data available in 2015, the ESC defined ‘very low’ as equivalent to hs-cTnT <5 ng/L and hs-cTnI-Abbott <2 ng/L.20 Based on new data available in 2020, the rule-out option for hs-cTnI-Abbott was extended to <4 ng/L in the 2020 ESC guidelines.5,21,22
We compared the ESC recommendations (hs-cTnT < 5 ng/L and hs-cTnI < 4 ng/L) to different algorithms including copeptin or glucose. An earlier meta-analysis showed weighted average copeptin concentrations of 22.8 pmol/L in patients with acute myocardial infarction (AMI) compared to 8.3 pmol/L in patients without AMI.12 A majority of earlier studies suggest a cut-off ranging from 9 to 20 pmol/L.6,7,12,23–26 To optimize sensitivity and negative predictive value (NPV) we chose to use a low cut-off of 9 pmol/L. Few studies have evaluated the rule-out of NSTEMI based on the combination of hs-cTn and glucose.15,16 In the study by Greenslade et al.,16 a cut-off for glucose of 5.6 mmol/L was used, whereas Shortt et al.15 explored different cut-offs, including 5.6 mmol/L, corresponding to the American Diabetes Association (ADA) criteria for normal glucose concentration. We chose the same cut-off, 5.6 mmol/L, to optimize sensitivity and NPV. For hs-cTnT concentrations, we used 5 ng/L, the upper reference level (URL), the URL divided by two (URL/2), and for hs-cTnI also the URL divided by four (URL/4) and 4 ng/L as cut-offs for the algorithms.
Endpoints
The primary diagnostic endpoint was NSTEMI during the index hospitalization. The primary analysis was performed on patients who presented to the ED more than 3 h after onset of symptoms. The secondary analysis was performed on all patients. Two subgroup analyses were predefined: early presenters (defined as chest pain onset ≤3 h before first blood draw) and patients without pre-existing diabetes.
External validation
External validation of the algorithms was performed in the APACE (Advantageous Predictors of Acute Coronary Syndrome Evaluation) cohort study. This is a prospective multicentre international diagnostic study (ClinicalTrials.gov identifier: NCT00470587)27–29 recruiting adult patients presenting to the ED with symptoms suggestive of AMI. The methodology of the APACE Study is described in detail in the Supplementary material online, Data.
For this analysis, patients were excluded if (i) they presented with ST-elevation myocardial infarction (STEMI), (ii) the final diagnosis remained unclear after central adjudication and possibly included NSTEMI, (iii) chest pain onset or pain maximum was >12 h upon admission, and (iv) they had missing hs-cTnT/I, glucose, or copeptin measurements at presentation (Supplementary material online, Figure S1).
Final diagnosis was adjudicated by two independent cardiologists applying the fourth universal definition of MI30 based on complete cardiac work-up including cardiac imaging and cardiac troponin sampling. For algorithms using hs-cTnT, an adjudicated final diagnosis based on hs-cTnT was used; while for hs-cTnI algorithms, an adjudicated final diagnosis based on hs-cTnI was used.
Statistical analysis
The baseline characteristics are reported as median levels with interquartile ranges for continuous data and percentages for categorical data. Comparison between groups were made using the non-parametric Kruskal–Wallis test for continuous variables and the χ2 and Fisher’s exact tests for categorical variables, as appropriate. Confidence intervals (CIs) of proportions were computed using the binomial exact method (Clopper–Pearson). Diagnostic accuracy of continuous concentrations of hs-cTnT/I alone and combined with copeptin or glucose, respectively, was quantified by using the area under the receiver operating characteristic curve (AUC) in all patients, through the use of binary logistic regression. Confidence intervals of AUCs and P-values for comparisons of AUCs were evaluated using the DeLong test.31 Statistical analyses further included calculations of sensitivity, specificity, NPV, and positive predictive value (PPV) for the respective algorithms in patients presenting >3 h from onset of symptoms (as recommended for the use of the 0 h-sample only hs-cTnT/I rule-out option in the ESC-algorithm),5 early presenters (sampled ≤3 h from symptom onset) and the total cohort. Sensitivity and specificity were compared by means of the McNemar test for paired proportions, NPV and PPV were tested using a weighted generalized score statistic.32 The relative changes in true negative rates were calculated for all algorithms. A further subgroup analysis of the glucose-dependent algorithms was undertaken after excluding patients with diabetes. All hypothesis testing was two-sided and a P-value <0.05 was regarded as significant. We used SPSS Statistics 26 (IBM Corporation), MedCalc (MedCalc Software Ltd), and R, Version 3.6.3 (The R Foundation) for the statistical analyses.
Results
Characteristics of patients
In the Norwegian cohort, the median age was 64 years and 60.5% were male. One hundred and twenty-five patients (13%) were diagnosed with NSTEMI (94% Type 1 NSTEMI), 110 (11%) with UAP, 151 (16%) with other cardiac conditions, and 573 (60%) with non-cardiac chest pain (NCCP) (see Table 1). The patients with NCCP were significantly younger than the three other groups, while the patients with NSTEMI and UAP were significantly more likely to be male and had higher prevalence of established risk factors than the patients in the other two groups. There were no significant between-group differences in the time from symptom onset to first presentation, nor in the rate of early presenters. Patient characteristics (median age 62 years, 69.3% male) for the 1272 patients from the international validation cohort are shown in Supplementary material online, Table S1. Admission concentrations of hs-TnT, hs-TnI, copeptin, and glucose were all significantly higher in patients with NSTEMI vs. patients with other adjudicated diagnosis (Figure 1, international validation cohort Supplementary material online, Figure S2).
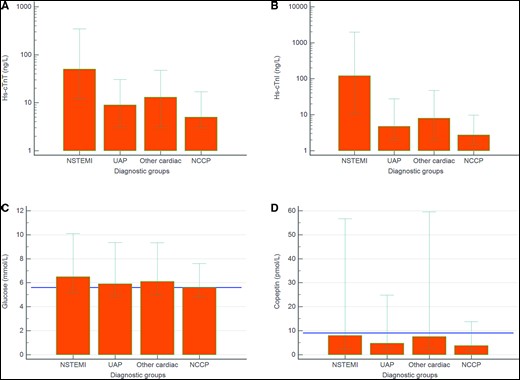
Admission concentrations (median, 10th and 90th percentile) of high-sensitivity cardiac troponin T (A), high-sensitivity cardiac troponin I (B), glucose (C), and copeptin (D) in the different patient groups. The horizontal lines in C and D denote the cut-offs of copeptin (9 pmol/L) and glucose (5.6 mmol/L), respectively.
Baseline characteristics
| Total | NSTEMI | UAP | Other cardiac | NCCP | P-value | |
|---|---|---|---|---|---|---|
| Descriptive factors | ||||||
| Patient count (%) | 959 (100%) | 125 (13.0%) | 110 (11.5%) | 151 (15.7%) | 573 (59.7%) | |
| Age, median years | 64 (52–74) | 70 (60–78) | 70 (62–77) | 71 (58–80) | 59 (49–70) | <0.001 |
| Male, % | 60.5 | 68.8 | 74.5 | 58.9 | 56.4 | <0.01 |
| BMI, median, kg/m2 | 26 (24–30) | 26 (24–29) | 26 (25–30) | 27 (24–30) | 26 (24–30) | 0.67 |
| eGFR, median, mL/min/1.73 m2 | 85 (70–97) | 80 (63–92) | 78 (65–91) | 74 (58–91) | 88 (75–100) | <0.001 |
| Symptom to arrival time, median hours | 8.1 (3.4–47) | 5.2 (2.8–25) | 14.7 (5.5–86) | 8.50 (3.5–47) | 8.0 (3.4–47) | 0.25 |
| Early presenters ≤3 h, % | 21.8 | 28.0 | 14.5 | 19.2 | 22.5 | 0.07 |
| Late presenters >12 h, % | 41.1 | 31.2 | 53.6 | 43.7 | 40.7 | <0.01 |
| Hospital stay, median hours | 29 (21–69) | 74 (63–114) | 72 (44–118) | 43 (24–79) | 24 (19–35) | <0.001 |
| Risk factors | ||||||
| Hypertension, % | 41.7 | 49.6 | 53.6 | 42.4 | 37.5 | <0.01 |
| Hyperlipidaemia, known, % | 20.2 | 19.2 | 33.6 | 20.5 | 17.8 | <0.01 |
| Hyperlipidaemia, new, % | 0.8 | 0 | 1.8 | 0.7 | 0.9 | 0.49 |
| Diabetes mellitus, % | 12.4 | 17.6 | 25.5 | 9.9 | 9.4 | <0.001 |
| Insulin treatment, % | 3.9 | 4.0 | 9.1 | 4.0 | 2.8 | 0.02 |
| Family history, % | 19.3 | 16.8 | 20.0 | 15.2 | 20.8 | 0.54 |
| Unknown family history | 12.6 | 12.0 | 16.4 | 11.3 | 12.4 | 0.63 |
| Current smoker, % | 20.6 | 18.4 | 18.2 | 21.2 | 21.5 | 0.79 |
| Previous smoker, % | 41.6 | 52.8 | 52.7 | 38.4 | 37.9 | <0.01 |
| Medical history | ||||||
| Prior MI, % | 21.1 | 25.6 | 39.1 | 20.5 | 16.8 | <0.001 |
| Prior PCI, % | 21.3 | 23.2 | 47.3 | 17.2 | 16.9 | <0.001 |
| Prior CABG, % | 8.3 | 13.6 | 25.5 | 6.6 | 4.4 | <0.001 |
| Heart failure, % | 4.8 | 6.4 | 5.5 | 9.3 | 3.1 | 0.01 |
| Stroke, % | 3.0 | 4.0 | 3.6 | 4.0 | 2.4 | 0.644 |
| Peripheral vascular disease, % | 2.3 | 4.0 | 6.4 | 1.3 | 1.4 | 0.006 |
| Vital signs on admission | ||||||
| Systolic BP, median mmHg | 143 (129–158) | 147 (134–161) | 148 (134–159) | 134 (124–155) | 142 (129–158) | 0.009 |
| Diastolic BP, median mmHg | 82 (74–90) | 84 (75–92) | 80 (72–90) | 80 (72–90) | 82 (74–90) | 0.157 |
| Heart rate, median b.p.m. | 72 (74–83) | 75 (64–89) | 70 (64–80) | 82 (67–100) | 70 (64–80) | <0.001 |
| Electrocardiography | ||||||
| ST-segment depression, % | 3.4 | 13.6 | 2.7 | 4.6 | 1.0 | <0.001 |
| T-wave inversion, % | 3.0 | 8.0 | 5.5 | 2.6 | 1.6 | 0.001 |
| Biomarker concentration | ||||||
| Troponin T, median ng/L | 7 (3–18) | 50 (24–176) | 9 (5–18) | 13 (5–24) | 5 (3–9) | <0.001 |
| Troponin I, median ng/L | 4 (2–11) | 120 (26–587) | 5 (3–10) | 8 (3–17) | 3 (2–5) | <0.001 |
| Copeptin, median pmol/L | 4.5 (2.8–9.8) | 7.9 (4.1–17.6) | 4.7 (2.9–10.9) | 7.5 (3.7–19.7) | 3.8 (2.5–6.8) | <0.001 |
| Glucose, median mmol/L | 5.8 (5.3–6.7) | 6.5 (5.8–7.9) | 5.9 (5.4–6.7) | 6.1 (5.5–7.3) | 5.6 (5.2–6.4) | <0.001 |
Baseline characteristics of the included patients. Numbers in parenthesis for continuous data are the 25th and 75th percentile. Data from WESTCOR.
In patients with NSTEMI, higher copeptin concentrations were seen in those who had a short time frame between the onset of symptoms and blood sampling, with a falling trend in copeptin concentrations in patients that presented after 6 h (Figure 2, international validation cohort Supplementary material online, Figure S3).
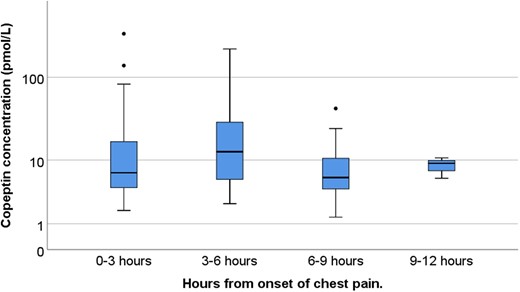
Box plot showing logarithmic copeptin concentrations for patients diagnosed with non-ST-elevation myocardial infarction, grouped by time from symptom start until first blood draw.
Receiver operating characteristics analyses
Figure 3A and B shows the receiver operating characteristics (ROC) analyses for the individual biomarker concentrations and different combinations in patients with symptoms >3 h. Adding copeptin or glucose to hs-cTnT/I as a continuous variable did not improve discrimination as quantified by the area under the curve [e.g. hs-cTnT/copeptin 0.91 (95% CI 0.89–0.93) vs. hs-cTnT alone 0.91 (95% CI 0.89–0.93); hs-cTnI/copeptin 0.85 (95% CI 0.82–0.87) vs. hs-cTnI alone 0.93 (95% CI 0.91–0.95)]. The combinations with glucose showed even smaller AUCs (see Supplementary material online, Table S2A). These findings were confirmed in the international cohort (see Supplementary material online, Figure S4 and Table S2B).
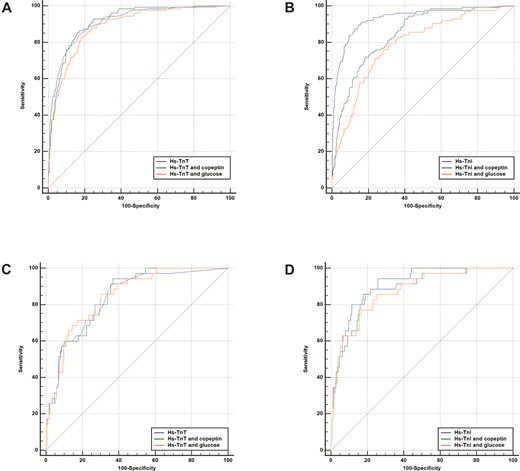
Receiver operating characteristic curves for the individual hs-cTn concentrations and combinations with copeptin and glucose. Hs-cTnT and combined algorithms for all patients (A), hs-cTnI and combined algorithms for all patients (B), hs-cTnT and combined algorithms in early presenters (C), and hs-cTnI and combined algorithms in early presenters (D).
Algorithm performance for NSTEMI in patients presenting more than 3 h from symptom onset
Adding copeptin <9 mmol/L or glucose <5.6 mmol/L did not increase the sensitivity of the rule-out provided by hs-cTnT <5 ng/L or hs-cTnI <4 ng/L in patients presenting more than 3 h after chest pain onset, the target population in the ESC-0h-algorithm (Table 2 and Supplementary material online, Tables S3A and B). In contrast, the combination decreased rule-out efficacy significantly (both P < 0.01). The actual number of NSTEMI patients that distinguishes the sensitivity of the different algorithms was low, and a brief review of the relevant patient characteristics is available in the Supplementary material online, Data. Alternative algorithms combining low admission concentrations (<7 ng/L) of hs-cTnT and copeptin (<9 pmol/L) in the Norwegian cohort showed equivalent sensitivity for NSTEMI compared to the cut-offs recommended by the ESC 0 h-rule-out algorithms [98.9 (95% CI: 94–100) vs. 98.9 (95% CI: 94–100); P value = 1.0], but increased the number of true negative patients from 225 with hs-cTnT <5 ng/L to 319 for hs-cTnT <7 ng/L and copeptin <9 pmol/L (Table 3). However, a similar pattern and even larger increase in true negative patients were seen, when a sole cut-off for hs-cTnT of <7 ng/L was applied, indicating that also for alternative hs-cTnT/I cut-offs the addition of copeptin did not increase the overall rule-out performance. These findings were again confirmed in the international cohort (Supplementary material online, Tables S4A and B).
Diagnostic performance (percentages with 95% CI) for early identification of NSTEMI for selected algorithms
| Algorithm | Sensitivity ((P) | NPV ((P) | Specificity (P) | PPV (P) | Patients ‘ruled out’ | False negatives |
|---|---|---|---|---|---|---|
| Patients presenting >3 h from symptom onset | ||||||
| Hs-cTnT < 5 ng/L (comparator WESTCOR) | 98.9 (94.0–100.0) | 99.6 (97.0–99.9) | 34.1 (30.5–37.9) | 17.0 (16.2–17.8) | 226 | 1 |
| Hs-cTnT < 7 ng/L | 98.9 (94.0–100.0) (P = 1.0) | 99.7 (98.1–100.0) (P < 0.001) | 54.2 (48.4–56.3) (P < 0.001) | 22.7 (21.3–24.2) (P < 0.001) | 359 | 1 |
| Hs-cTnT < 7 ng/L and copeptin < 9 pmol/L | 98.9 (94.0–100.0) (P = 1.0) | 99.7 (97.9–100.0) (P < 0.001) | 48.3 (44.5–52.2) (P < 0.001) | 20.7 (19.5–22.0) (P < 0.001) | 320 | 1 |
| Hs-cTnT < 7 ng/L and glucose < 5.6 mmol/L | 98.9 (94.0–100.0) (P = 1.0) | 99.4 (96.2–99.9) (P < 0.001) | 27.0 (23.6–30.5) (P < 0.001) | 15.6 (14.9–16.3) (P < 0.001) | 179 | 1 |
| Hs-cTnT < 5 ng/L (comparator APACE) | 100.0 (97.8–100.0) | 100.0 (97.6–100) | 22.8 (19.7–26.2) | 25.0 (24.3–25.8) | 149 | 0 |
| Hs-cTnT < 7 ng/L | 100.0 (97.8–100.0) (P = 1.0) | 100.0 (98.7–100) (P = 1.0) | 42.7 (38.9–46.6) (P < 0.001) | 31.0 (29.6–32.4) (P < 0.001) | 279 | 0 |
| Hs-cTnT < 7 ng/L and copeptin < 9 pmol/L | 100.0 (97.8–100.0) (P = 1.0) | 100.0 (98.2–100) (P = 1.0) | 30.9 (27.4–34.6) (P < 0.001) | 27.1 (26.1–28.2) (P < 0.001) | 202 | 0 |
| Hs-cTnT < 7 ng/L and glucose < 5.6 mmol/L | 100.0 (97.8–100.0) (P = 1.0) | 100.0 (96.5–100) (P = 1.0) | 16.1 (13.3–19.1) (P < 0.001) | 23.5 (22.9–24.1) (P < 0.001) | 105 | 0 |
| Hs-cTnI < 4 ng/L (comparator WESTCOR) | 97.8 (92.2–99.7) | 99.5 (97.9–99.9) | 56.1 (52.2–59.9) | 23.3 (21.7–25.0) | 372 | 2 |
| Hs-cTnI < 7 ng/L | 95.6 (89.0–98.8) (P = 0.16) | 99.2 (97.9–99.7) (P = 0.41) | 74.2 (70.7–77.5) (P < 0.001) | 33.6 (30.6–36.7) (P < 0.001) | 494 | 4 |
| Hs-cTnI < 7 ng/L and copeptin < 9 pmol/L | 97.8 (92.2–99.7) (P = 1.0) | 99.5 (98.1–99.9) (P < 0.001) | 62.9 (59.1–66.6) (P < 0.001) | 26.4 (24.5–28.5) (P < 0.001) | 417 | 2 |
| Hs-cTnI < 7 ng/L and glucose < 5.6 mmol/L | 98.9 (94.0–100) (P = 0.32) | 99.6 (97.1–99.9) (P = 0.74) | 35.3 (31.7–39.1) (P < 0.001) | 17.3 (16.4–18.1) (P < 0.001) | 234 | 1 |
| Hs-cTnI < 4 ng/L (comparator APACE) | 98.2 (94.7–99.6) | 99.1 (97.4–99.7) | 52.4 (48.5–56.3) | 33.8 (32.0–35.7) | 348 | 3 |
| Hs-cTnI < 7 ng/L | 96.3 (92.2–98.6) (P = 0.08) | 98.7 (97.2–99.4) (P = 0.33) | 70.4 (66.7–73.8) (P < 0.001) | 44.6 (41.6–47.6) (P < 0.001) | 469 | 6 |
| Hs-cTnI < 7 ng/L and copeptin < 9 pmol/L | 98.2 (94.7–99.6) (P = 1.0) | 99.0 (97.0–99.7) (P = 0.85) | 45.0 (41.1–48.9) (P < 0.001) | 30.7 (29.1–32.2) (P < 0.001) | 299 | 3 |
| Hs-cTnI < 7 ng/L and glucose < 5.6 mmol/L | 99.4 (96.6–100) (P = 0.16) | 99.4 (95.7–99.9) (P = 0.71) | 23.7 (20.5–27.2) (P < 0.001) | 24.4 (23.6–25.5) (P < 0.001) | 157 | 1 |
| Patients presenting ≤ 3 h from symptom onset | ||||||
| Hs-cTnT < 5 ng/L (comparator WESTCOR) | 97.1 (85.1–99.9) | 98.5 (90.3–99.8) | 37.4 (30.2–45.0) | 23.8 (21.5–26.2) | 66 | 1 |
| Hs-cTnT < 7 ng/L | 94.3 (80.8–99.3) (P = 0.32) | 97.9 (92.3–99.5) (P = 0.64) | 53.5 (45.8–61.0) (P < 0.001) | 29.0 (25.4–32.8) (P < 0.001) | 95 | 2 |
| Hs-cTnT < 7 ng/L and copeptin < 9 pmol/L | 100 (90.0–100) (P = 0.32) | 100 (P = 0.38) | 42.0 (34.5–49.7) (P < 0.001) | 25.7 (23.4–28.2) (P = 0.03) | 73 | 0 |
| Hs-cTnT < 7 ng/L and glucose < 5.6 mmol/L | 97.1 (85.1–99.9) (P = 1.0) | 97.3 (83.6–99.6) (P = 0.67) | 20.7 (14.9–27.5) (P < 0.001) | 19.8 (18.3–21.3) (P < 0.001) | 37 | 1 |
| Hs-cTnT < 5 ng/L (comparator APACE) | 100.0 (96.2–100) | 100.0 (96.9–100) | 33.3 (28.4–38.6) | 29.1 (27.5–30.6) | 117 | 0 |
| Hs-cTnT < 7 ng/L | 96.8 (91.1–99.3) (P = 0.08) | 98.4 (95.2–99.5) (P = 0.02) | 50.6 (45.2–55.9) (P < 0.001) | 34.3 (31.9–36.9) (P < 0.001) | 183 | 3 |
| Hs-cTnT < 7 ng/L and copeptin < 9 pmol/L | 98.9 (94.3–100) (P = 0.32) | 99.2 (94.4–99.9) (P = 0.32) | 33.4 (28.5–38.6) (P = 0.83) | 28.4 (26.9–30.0) (P = 0.96) | 120 | 1 |
| Hs-cTnT < 7 ng/L and glucose < 5.6 mmol/L | 99.0 (94.3–100) (P = 0.32) | 98.5 (90.3–99.8) (P = 0.18) | 18.5 (14.6–23.0) (P < 0.001) | 24.5 (23.5–25.5) (P < 0.001) | 67 | 1 |
| Hs-cTnI < 4 ng/L (comparator WESTCOR) | 91.4 (76.9–98.2) | 97.1 (91.7–99.0) | 56.9 (49.2–64.4) | 29.9 (25.9–34.2) | 102 | 3 |
| Hs-cTnI < 7 ng/L | 88.6 (73.3–96.8) (P = 0.32) | 96.9 (92.5–98.7) (P = 0.83) | 71.3 (63.9–77.9) (P < 0.001) | 38.3 (32.3–44.6) (P < 0.001) | 128 | 4 |
| Hs-cTnI < 7 ng/L and copeptin < 9 pmol/L | 97.1 (85.1–99.9) (P = 0.32) | 99.0 (93.5–99.9) (P = 0.35) | 54.7 (47.1–62.1) (P = 0.55) | 29.3 (25.9–33.0) (P = 0.78) | 100 | 1 |
| Hs-cTnI < 7 ng/L and glucose < 5.6 mmol/L | 97.1 (85.1–99.9) (P = 0.16) | 97.7 (86.0–99.7) (P = 0.75) | 24.7 (18.5–31.8) (P < 0.001) | 20.6 (19.0–22.3) (P < 0.001) | 44 | 1 |
| Hs-cTnI < 4 ng/L (comparator APACE) | 97.8 (92.3–99.7) | 99.1 (96.6–99.8) | 62.8 (57.6–67.8) | 39.9 (36.7–43.3) | 228 | 2 |
| Hs-cTnI < 7 ng/L | 91.2 (83.4–96.1) (P = 0.01) | 97.4 (95.1–98.6) (P = 0.06) | 82.8 (78.5–86.5) (P < 0.001) | 57.2 (51.4–62.9) (P < 0.001) | 306 | 8 |
| Hs-cTnI < 7 ng/L and copeptin < 9 pmol/L | 98.9 (94.0–100) (P = 0.56) | 99.4 (96.1–99.9) (P = 0.73) | 47.8 (42.5–53.1) (P < 0.001) | 32.4 (30.2–34.6) (P < 0.001) | 173 | 1 |
| Hs-cTnI < 7 ng/L and glucose < 5.6 mmol/L | 98.9 (94.0–100) (P = 0.56) | 99.0 (93.5–99.9) (P = 0.93) | 28.3 (23.7–33.3) (P < 0.001) | 25.9 (24.6–27.2) (P < 0.001) | 103 | 1 |
Sensitivity, specificity, NPV, and PPV were calculated for the different cut-off strategies. Significantly improved performance coloured green. Significantly worsened performance coloured red. WESTCOR data on white background. APACE data on grey background. Comparator algorithms is shown in bold.
True negatives
| Number of patients without NSTEMI as proportion of total | Algorithm | False positive | True negative (change from baseline) | False negative | Relative change in true negative rate |
|---|---|---|---|---|---|
| Patients presenting >3 h from symptom onset 660/750 | Hs-cTnT < 5 ng/L | 435 | 225 (0) | 1 | 1.00 comparator |
| Hs-cTnT < 7 ng/L | 302 | 358 (+133) | 1 | 1.59 | |
| Hs-cTnT < 7 ng/L and copeptin < 9 pmol/L | 341 | 319 (+94) | 1 | 1.42 | |
| Hs-cTnT < 7 ng/L and glucose < 5.6 mmol/L | 482 | 178 (-47) | 1 | 0.79 | |
| Hs-cTnI < 4 ng/L | 290 | 370 (0) | 2 | 1.00 comparator | |
| Hs-cTnI < 7 ng/L | 170 | 490 (+120) | 4 | 1.32 | |
| Hs-cTnI < 7 ng/L and copeptin < 9 pmol/L | 245 | 415 (+45) | 2 | 1.12 | |
| Hs-cTnI < 7 ng/L and glucose < 5.6 mmol/L | 427 | 233 (−137) | 1 | 0.63 | |
| All patients 834/959 | Hs-cTnT < 5 ng/L | 544 | 290 | 2 | 1.00 comparator |
| Hs-cTnT < 7 ng/L | 383 | 451 (+161) | 3 | 1.56 | |
| Hs-cTnT < 7 ng/L and copeptin < 9 pmol/L | 442 | 392 (+102) | 1 | 1.35 | |
| Hs-cTnT < 7 ng/L and glucose < 5.6 mmol/L | 620 | 214 (-76) | 2 | 0.74 | |
| Hs-cTnI < 4 ng/L | 365 | 469 (0) | 5 | 1.00 comparator | |
| Hs-cTnI < 7 ng/L | 220 | 614 (+145) | 8 | 1.31 | |
| Hs-cTnI < 7 ng/L and copeptin < 9 pmol/L | 327 | 507 (+38) | 3 | 1.08 | |
| Hs-cTnI < 7 ng/L and glucose < 5.6 mmol/L | 558 | 276 (−190) | 2 | 0.59 |
Number of false positives, true negatives, and the changes in the true negative rate for selected algorithms in patients presenting >3 h from symptom onset and all patients. Data from the Norwegian cohort.
Compared to the ESC 0 h-rule-out algorithm, the combinations of hs-cTnT/I with glucose showed overall comparable sensitivity, but lower specificity and lower number of patients ruled out (Tables 3 and 4). These findings were again confirmed in the international cohort (Supplementary material online, Tables S3B and S4A–D).
True negatives
| Number of patients without NSTEMI as proportion of total | Algorithm | False positive | True negative (change from baseline) | False negative | Relative change in true negative rate |
|---|---|---|---|---|---|
| Patients presenting >3 h from symptom onset 653/821 | Hs-cTnT < 5 ng/L | 504 | 149 | 0 | 1.00 comparator |
| Hs-cTnT < 7 ng/L | 374 | 279 (+130) | 0 | 1.87 | |
| Hs-cTnT < 7 ng/L and copeptin < 9 pmol/L | 451 | 202 (+53) | 0 | 1.36 | |
| Hs-cTnT < 7 ng/L and glucose < 5.6 mmol/L | 548 | 105 (−44) | 0 | 0.70 | |
| Patients presenting >3 h from symptom onset 658/821 | Hs-cTnI < 4 ng/L | 313 | 345 | 3 | 1.00 comparator |
| Hs-cTnI < 7 ng/L | 195 | 463 (+118) | 6 | 1.34 | |
| Hs-cTnI < 7 ng/L and copeptin < 9 pmol/L | 362 | 296 (−49) | 3 | 0.86 | |
| Hs-cTnI < 7 ng/L and glucose < 5.6 mmol/L | 502 | 156 (−189) | 1 | 0.45 | |
| All patients 1009/1272 | Hs-cTnT < 5 ng/L | 743 | 266 (0) | 0 | 1.00 comparator |
| Hs-cTnT < 7 ng/L | 550 | 459 (+193) | 3 | 1.73 | |
| Hs-cTnT < 7 ng/L and copeptin < 9 pmol/L | 688 | 321 (+55) | 1 | 1.20 | |
| Hs-cTnT < 7 ng/L and glucose < 5.6 mmol/L | 838 | 171 (−95) | 1 | 0.64 | |
| All patients 1018/1272 | Hs-cTnI < 4 ng/L | 447 | 571 (0) | 5 | 1.00 comparator |
| Hs-cTnI < 7 ng/L | 257 | 761 (+190) | 14 | 1.33 | |
| Hs-cTnI < 7 ng/L and copeptin < 9 pmol/L | 550 | 468 (−103) | 4 | 0.82 | |
| Hs-cTnI < 13 ng/L and copeptin < 9 pmol/L | 495 | 523 (−48) | 12 | 0.92 | |
| Hs-cTnI < 7 ng/L and glucose < 5.6 mmol/L | 760 | 258 (−313) | 2 | 0.45 |
Number of false positives, true negatives, and the changes in the true negative rate for selected algorithms in patients presenting > 3 h from symptom onset and all patients. Data from the international cohort. While for algorithms using high-sensitivity Troponin T, patients with and without NSTEMI were identified using our adjudicated final diagnosis based on Troponin T. For algorithms using high-sensitivity Troponin I, an adjudicated final diagnosis based on Troponin I was used.
Diagnostic accuracy for NSTEMI amongst early presenters (<3 h)
In the Norwegian cohort, ∼22% (n = 209) of the patients were classified as early presenters, though this increased to 28% in the patients diagnosed with NSTEMI. Corresponding numbers from the international cohort were 35.5% (all patients) and 36.1% (patients with NSTEMI).
Adding copeptin to either hs-cTnT or hs-cTnI as a continuous variable in early presenters resulted in comparable AUC vs. hs-cTnT/I alone, but possible higher sensitivity for very low concentrations (Figure 3C and D and Supplementary material online, Table S2C). There were no statistically significant differences in the respective AUCs. These findings were confirmed in the international cohort (Supplementary material online, Figure S4C and D).
Regarding the use of specific cut-offs in early presenters, the ESC 0 h-rule-out cut-offs, which are not recommended for early presenters, had a lower sensitivity (91–97%) when applied in early presenters in the Norwegian cohort. The combinations of hs-cTn <7 ng/L and copeptin maintained a sensitivity between 97% and 100%, similar to what was shown for patients presenting >3 h from symptom who were evaluated with the ESC rule-out algorithms. Specificity was significantly increased for the hs-cTnT and copeptin combination compared to the reference in the Norwegian cohort [42.0 (95% CI: 34.5–49.7) vs. 37.4 (95% CI: 30.2–45.0), respectively; P-value < 0.001] and unchanged in the international cohort. The combination with hs-cTnI and copeptin showed decreasing specificity in both cohorts.
Increasing the hs-cTnT/I concentration without adding copeptin reduced the sensitivity for NSTEMI, varying from 96.8% to 88.6% depending on assay and cohort. Adding glucose to hs-cTn <7 ng/L maintained sensitivity, though specificity dropped substantially (P ≤ 0.001) in both cohorts.
Diagnostic accuracy for NSTEMI after excluding patients with diabetes
A secondary analysis of the glucose-dependent algorithms was performed for patients without pre-existing diabetes (88% of the patients, n = 840), in order to validate the results independent of potential diabetes-dependent hyperglycaemia. (Supplementary material online, Table S3A). The results were similar to the total cohort.
Discussion
This study addressed the possibly incremental value of adding copeptin or glucose to the current hs-cTnT/I-only NSTEMI rule-out option recommended by the current ESC guidelines. It adds to the ongoing debate between the current ESC guideline recommendation suggesting copeptin should not routinely be used whenever hs-cTnT/I-based protocols are available,5 and the recently articulated expert opinion that suggested copeptin may provide value even on top of hs-cTnT/I.33
We report four major findings.
First, when used as continuous variables, the most unbiased approach to evaluate the diagnostic accuracy of biomarkers, the combination of hs-cTnT/I with either copeptin or glucose did not increase the diagnostic accuracy for NSTEMI in patients presenting to the ED with acute chest discomfort. These findings were confirmed in the international validation cohort.
Second, when investigating specific cut-off combinations, adding copeptin <9 mmol/L or glucose <5.6 mmol/L did not increase the sensitivity of the rule-out provided by hs-cTnT <5 ng/L or hs-cTnI <4 ng/L in patients presenting more than 3 h after chest pain onset, the target population in the ESC-algorithm. In contrast, the combination decreased rule-out efficacy significantly (both P < 0.01). Neither did combining copeptin or glucose with higher hs-cTnT/I cut-off concentrations provide relevant incremental value vs. the use of hs-cTnT/I-only cut-offs. These findings were confirmed in the international validation cohort.
Third, when restricting the analysis to patients presenting early (<3 h) from chest pain onset [a population in whom current ESC guidelines do not recommend the use of a hs-cTnT/I-only approach (0 h-sample), but rather the ESC 0/1 h- or ESC 0/2 h-algorithm], a possible trend towards higher sensitivity for the combination of hs-cTnT/I with copeptin vs. the use of hs-cTnT <5 ng/L or hs-TnI <4 ng/L emerged in the Norwegian cohort. This could not be validated in the international cohort.
Fourth, findings in patients with diabetes mellitus were consistent with that in the overall cohort.
These findings extend and corroborate prior work aiming to further improve the early rule-out and rule-in of NSTEMI.34 In harmony with the current scientific consensus, we demonstrated very good diagnostic performance of hs-cTnT/I alone, with the largest AUCs for continuous biomarkers being the two individual hs-cTnT/I assays.35 Our data also confirm the high performance and safety of the current ESC 0 h-rule-out cut-offs, and provide further support for the ESC 2020 guideline recommendation that copeptin should not be used routinely when hs-cTnT/I-based algorithms are available.5
Additionally, our findings regarding the possible value of copeptin in combination with hs-cTnT/I in early presenters may highlight the sweet-spot for the possible remaining clinical value of copeptin given the worldwide increase in the use of hs-cTnT/I assays.36 The maintained sensitivity amongst early presenters may be explained by the observation that the highest copeptin concentrations were seen in those patients with NSTEMI who presented early. Copeptin increases rapidly during high-level endogenous stress, but has a short half-life in circulation. These findings particularly extend and corroborate observations made by Stallone et al.25 among 519 patients presenting within 2 h of symptom onset, of which 102 patients (20%) had NSTEMI. The additional use of copeptin did not increase diagnostic accuracy as quantified by the AUC of hs-cTnT [0.87 (95% CI: 0.83–0.90) for hs-cTnT alone vs. 0.86 (95% CI: 0.82–0.90) for the combination; P = NS].
Further research and studies are required to elucidate this subject further.
Strengths and limitations of the study
Compared to previous studies,7,37 this study includes a reasonably large number of patients. The distribution of diagnoses appears to be in line with the expected frequencies.5
Our data add to earlier observations by evaluating several different cut-offs for cardiac troponins combined with copeptin and glucose and by including a sub-analysis of early presenters. The study had wide inclusion criteria mimicking real-life experience from the ED.
Finally, the findings obtained in the Norwegian cohort were externally validated in an even larger international cohort using central adjudication according to the universal definition of MI as the reference.
The study has several possible limitations. First, hs-cTnT results were used during the adjudication process, introducing an unavoidable possible bias against hs-cTnI. The international study used hs-cTnI as the adjudicator for hs-cTnI algorithms avoiding this confounder. It is reassuring that we did not find large discrepancies between the two cohorts; sensitivity for the ESC 0 h-algorithm hs-cTnI <4 ng/L was 97.8% in the Norwegian cohort and 98.2% in the international cohort in patients presenting >3 h from chest pain onset.
Second, recent studies have shown that ethnicity38 and sex39 influenced baseline copeptin concentrations. Such confounders could influence our results, though we chose a low cut-off concentration for copeptin to maximally improve sensitivity, and there were no significant sex-dependent difference in copeptin concentrations amongst the NSTEMI patients.
Third, not all patients who fulfilled the inclusion criteria were included during the study period, mainly due to logistical factors. Although inclusion did occur continuously, this could potentially have introduced a selection bias, if e.g. patients presenting at certain times during the day or week were underrepresented. However, the percentage of NSTE-ACS and patient characteristics appears to be similar to the data reported in other studies,3,5 and the results for copeptin-7 and glucose-dependent15 algorithms were in line with similar studies.
Conclusion
Our study showed that the use of dual biomarker test algorithms did not improve diagnostic accuracy for the rapid rule-out of NSTEMI in patients presenting with acute chest discomfort to the ED.
The possible trend towards higher sensitivity for the combination of copeptin with hs-cTnT/I in patients presenting very early deserves further study. The use of glucose in combination with hs-cTn provided high sensitivity for NSTEMI, but lowered specificity and no possible benefit could be established.
Supplementary material
Supplementary material is available at European Heart Journal: Acute Cardiovascular Care online.
Acknowledgements
The Norwegian part of this article arises from the WESTCOR study group. We are grateful to the staff, co-workers, and patients at Haukeland and Stavanger University Hospitals that have made this research project possible.
Funding
The Norwegian study was financed by a grant from the Western Norway Regional Health Authority (grant number: 912265). I.Z.R. has a PhD grant from the Western Norway Regional Health Authority (ID: F-12501). The international study was supported by research grants from the Swiss National Science Foundation, the Swiss Heart Foundation, the European Union, the Kommission für Technologie und Innovation, the University of Basel, the University Hospital Basel, Abbott Laboratories, Beckman Coulter, BRAHMS GmbH, Idorsia Pharmaceuticals Ltd, Quidel Corporation, F.Hoffmann-La Roche AG, Siemens AG, and Singulex Inc.
Conflict of interest: K.M.A. has served on an advisory board for Roche Diagnostics and has received speaker’s honoraria from Siemens Healthineers. T.O. has served on advisory boards for Abbott Diagnostics, Roche Diagnostics, and Novartis and has received research support from AstraZeneca, Abbott Diagnostics, Roche Diagnostics, ThermoFisher, Singulex, and Biomedica via Akershus University Hospital; and speaker’s honoraria from Roche Diagnostics and Novartis. Ø.S. has received lecture fees from Abbott Diagnostics. P.L.-A. has received research funding from the Swiss Heart Foundation (FF20079) and speaker’s honoraria from Quidel, paid to the institution. J.B. has received research grants from the University of Basel and the Division of Internal Medicine, the Swiss Academy of Medical Sciences, the Gottfried and Julia Bangerter-Rhyner-Foundation, and speaker’s honoraria from Siemens, Roche Diagnostics, Ortho Clinical Diagnostics, and Quidel. T.N. has received research support from the Swiss National Science Foundation (P400PM_191037/1), the Prof. Dr. Max Cloëtta Foundation, the Margarete und Walter Lichtenstein-Stiftung (3MS1038), and the University Hospital Basel as well as speaker’s honoraria/consulting honoraria from Siemens, Beckman Coulter, Bayer, Ortho Clinical Diagnostics, and Orion Pharma, outside the submitted work. L.K. has received grants from University of Basel, the Swiss Academy of Medical Sciences, and the Gottfried and Julia Bangerter-Rhyner Foundation, as well as the «Freiwillige Akademische Gesellschaft Basel». C.M. has received research grants from the Swiss National Science Foundation, the Swiss Heart Foundation, the European Union, the KTI, the University of Basel, the University Hospital Basel, Abbott, Beckman Coulter, BRAHMS, Idorsia, Novartis, Quidel, Roche, Siemens, Singulex, Sphingotec as well as speaker’s/consulting honoraria from Amgen, Astra Zeneca, Biomerieux, Bayer, Boehringer Ingelheim, BRAHMS, Idorsia, Novartis, Osler, Roche, Sanofi, Siemens, and Singulex. The remaining authors have nothing to disclose.
Data availability statement
The data underlying this article cannot be shared publicly due to the risk of violating patient privacy, as regulated by national and institutional data protection agencies.
References
Author notes
Ingar Ziad Restan and Ana Yufera Sanchez contributed equally to the article.

Comments