


Abstract
The timely diagnosis and exclusion of acute coronary syndromes in the Emergency Department (ED) remains a challenge. This study aims to evaluate the diagnostic accuracy of a high-sensitivity cardiac troponin I assay (Siemens TNIH) on serial sampling for ED patients as standalone test and in rule-out algorithms as recommendations remain assay specific.
This secondary analysis from a prospective diagnostic accuracy study at 14 centres included ED patients presenting with chest pain of suspected cardiac nature. Serum drawn on arrival and 3 h later was batchtested for TNIH. The target condition was an adjudicated diagnosis of acute myocardial infarction (AMI). We evaluated the diagnostic accuracy of absolute and relative delta criteria and four rule-out strategies. Of 802 included patients, 13.8% had AMI. Absolute delta criteria had superior accuracy to relative criteria (C-statistic 0.94 vs. 0.76, P < 0.001). However, no delta criteria achieved >95.5% sensitivity for AMI when used alone. Ruling out AMI with TNIH below the 99th percentile at 0 and 3 h had 88.3% (95% confidence interval 80.8–93.6%) sensitivity. The adapted European Society of Cardiology (ESC) 0/2 h algorithm had higher sensitivity (98.2%) than both High-STEACS (93.7%, P = 0.03) and the ESC 0/3 h algorithm (79.3%, P < 0.001). These pathways ruled out 63%, 74%, and 88% patients, respectively.
With serial sampling over 3 h, the Siemens TNIH assay should be used with a validated algorithm incorporating bespoke cut-offs and absolute delta criteria. In our analysis, the adapted ESC 0/2 h algorithm had greatest sensitivity. ‘Ruling out’ AMI using the 99th percentile of the assay cannot be recommended.

Introduction
The rapid diagnosis and exclusion of acute coronary syndromes (ACSs) in patients who present to the Emergency Department (ED) with chest pain remains a challenge to emergency physicians worldwide. This heterogeneous patient group makes up 25% of acute medical admissions in the UK, yet only 8–10% of the patients have a diagnosis of ACS. The low prevalence of ACS despite the high number of presentations presents a significant demand on finite health care resources.1,2
Currently, serial cardiac troponin testing remains the standard of care to rule out acute myocardial infarction (AMI). However, the optimal algorithm to rule out AMI should be defined for every assay.
The European Society of Cardiology (ESC) 2015 guideline supported the use of early serial measurements of cardiac troponin using a high-sensitivity cardiac troponin (hs-cTn) assay, with samples drawn on arrival in the ED and 3 h later (the ‘ESC 0/3 h pathway’).3,4 The ESC 0/3 h pathway uses the 99th percentile upper reference limit as a cut-off for both ruling in and ruling out AMI, in combination with delta changes. A similar approach was endorsed by the National Institute for Health and Care Excellence (NICE), supporting 0/3 h hs-cTn measurements for AMI rule out using the 99th percentile cut-off.5,6
The ESC 2015 guidelines have since been superceeded by the ESC 2020 guidelines that have moved to recommend a 0/1 or 0/2 h algorithm as rapid rule in and rule out strategies with troponin assay-specific cut-offs for optimal performance.7 While the 0/1 h algorithm is deemed the preferred approach, delivering blood sampling in such short intervals can proof difficult in busy EDs potentially making a 0/2 h sampling more practical as well as many places worldwide still using the now downgraded conversative 0/3 h ESC 2015 approach.
Cut-offs for using the Siemens ADVIA Centaur High-Sensitivity Troponin I assay (Siemens TNIH assay) with the ESC 2020 algorithms were derived and validated in the Advantageous Predictors of Acute Coronary Syndromes Evaluation (APACE) study where the 0/2 h algorithm could rule out AMI in ∼55% of patients with high negative predictive value (NPV).8
Similar to the ESC 2020 approach, Chapman et al. derived and validated the High-STEACS (high-sensitivity troponin in the evaluation of patients with ACS) pathway using optimized hs-cTn cut-offs set below the 99th percentile of the assay to improve risk stratification. In that study, the High-STEACS pathway ruled out more AMI patients than the ESC 0/3 h pathway, while having a five-fold lower miss rate of index AMI.9
All three algorithms use a combination of the concept of absolute troponin delta (AΔ = |TNIH concentrationT=3h − TNIH concentrationT=0h|) with the High-STEACS and ESC 0/2 h algorithm combining the concept with bespoke low troponin concentrations. The approach of using absolute troponin deltas over relative troponin delta [RΔ = (AΔ × 100)/TNIH concentrationT=0h], was shown to be superior for early rule out of AMI in multiple studies and is also endorsed by the International Federation of Clinical Chemistry Committee for Clinical Applications of Cardiac Biomarkers (IFCC-CCB), while also advising the evaluation of optimal troponin deltas for individual troponin assays and pathways.10–13
In light of the recent research into early ACS rule out strategies, we first sought to evaluate the diagnostic accuracy of the Siemens TNIH assay at 0 and 3 h in patients presenting to the ED with suspected cardiac chest pain at the 99th percentile and lower troponin concentrations including establishing the optimal absolute and relative troponin delta for the assay. Our second objective was to externally validate an ‘adapted’ ESC 0/2 h algorithm (applied with testing at 0/3 h), the ESC 0/3 h algorithm, and the High-STEACS pathway with the Siemens TNIH assay.
Methods
Design and setting
This work presents a secondary analysis of data collected in the STAR (sensitive troponin for admission reduction) study, which was nested within the larger Bedside Evaluation of Sensitive Troponin (BEST) study (NIHR portfolio reference UK CRN 18000). The BEST study was a prospective observational study conducted at 19 EDs in the UK. In a phased approach the first site commenced recruitment on 9 February 2015 with the final site completing recruitment on 25 October 2016. For this secondary analysis (STAR study) data from 14 sites were used. An overview of sites included can be found in the Supplementary material online.
Ethical approval was granted by the Research Ethics Committee (reference 14/NW/1344) and all participants provided written informed consent. We have previously published three analysis from the BEST study.14–16
Study participants
We included adult patients aged ≥18 years presenting to the ED with pain, discomfort or pressure in the chest, epigastrium, neck, jaw, or upper limbs without an obvious non-cardiac source and whom the treating emergency physician felt warranted investigation for suspected ACS.
We excluded patients whose peak symptoms were >12 h before presenting to the ED, patients requiring referral for immediate primary percutaneous coronary intervention due to unequivocal evidence of ST elevation myocardial infarction, patient requiring hospital admissions for another medical condition and patients lacking mental capacity to provide written informed consent.
Data collection and laboratory analysis
All clinical data were prospectively collected by the initial treating ED physician and clinical research nurses at the time of inclusion, using a specifically designed case report form documenting presence and absence of relevant symptoms as well as physical examination findings, 12-lead ECG interpretation, ED diagnosis, patient disposition from the ED, and patient characteristics including their past medical history, current medication use, and cardiovascular risk factors.
Patients in this observation study were treated according to local guidelines for treatment of cardiac chest pain. Local guidelines were checked for their compliance with guidance from NICE and the ESC.
Serum blood samples were routinely taken on arrival to the ED and 3 h later in patients presenting with suspected cardiac chest pain. The blood samples were frozen to −20°C within 4 h and further stored at −70°C within 28 days for analysis of promising biomarkers at a later time. Samples were subsequently analysed for hs-cTnI [Siemens High-Sensitivity Troponin I (TNIH), ADVIA Centaur, 99th percentile upper reference limit overall 46.5 ng/L, female 39.6 ng/L, male 58.0 ng/L; coefficient of variation 10% at 4.50 ng/L]. The performance characteristics of the assay were independently confirmed by the investigators.17
Pathways
The three pathways that were compared are the ESC 0/3 h pathway, the High-STEACS pathway, and adapted ESC 0/2 h algorithm with their respective AMI rule out criteria are summarized in Figure 1.
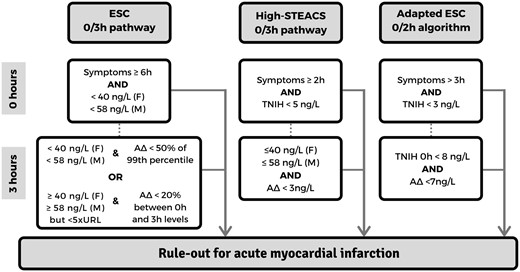
Summary of pathway rule out criteria for acute myocardial infarction.
ESC 0/3 h pathway
For ruling out myocardial infarction, the ESC 0/3 h pathway proposes cardiac troponin concentrations ≤99th percentile upper reference limit at presentation in patients with symptoms of suspected cardiac chest pain for >6 h; or if the troponin concentration remains ≤99th percentile at 3 h. In accordance with previously published guidance from the ESC Study Group on Biomarkers in Cardiology, rule out was possible if the 3 h troponin is >99th percentile without a significant absolute troponin delta, defined as >50% of the 99th percentile upper reference limit (TNIH: female >20 ng/L and male >29 ng/L). In case of a 0 h troponin concentration >99th percentile the Study Group advocated for a >20% change from the TNIH concentration on arrival. Additionally, patients with a troponin concentration of five times the upper reference limit of the troponin assay (TNIH assay: female 198 ng/L and male 290 ng/L) are considered a rule in regardless of delta change.3,4 Patients not meeting rule in criteria according to the ESC 0/3 pathway were hence inferred to have ruled out for AMI.
High-STEACS pathway
The High-STEACS pathway was derived and validated with the Abbott Architect STAT hs-cTnI assay and subsequently validated for the Siemens Atellica TNIH assay without recalibration of the thresholds.9,18 The validated High-STEACS pathway rules out AMI in patients if cardiac troponin levels are <5 ng/L at presentation (unless presenting <2 h after symptom onset) or if patients had a cardiac troponin concentration ≤99th percentile at 3 h and have a 3 h troponin delta of <3 ng/L.9
Adapted ESC 0/2 h algorithm
The ESC 2020 0/2 h algorithm using the Siemens TNIH assay was derived in a randomly selected sample from the APACE study and subsequently internally validated in samples of the remaining subjects. The algorithm suggests ruling out AMI in patients with cardiac troponin concentrations <3 ng/L if chest pain symptoms started >3 h prior to ED presentation or a troponin concentration at presentation of <8 ng/L and a 0–2 h troponin delta of <7 ng/L in patients with chest pain for <3 h prior to ED presentation.7,8 We adapted the algorithm using 0 and 3 h troponin samples with the exact same cut-offs proposed in the 0/2 h algorithm.
Outcomes
In this diagnostic accuracy study, the target condition was AMI. Allocation of the diagnosis of AMI was performed by two independent investigators in accordance with the third universal definition of AMI, based on access to relevant clinical information including ED and subsequent admission medical records, blood results, ECG, and cardiac investigations and procedures within 30 days but blinded to the results of research investigations.19 If discrepancies could not be resolved by consensus a third independent investigator would be involved.
As a prognostic outcome we also evaluated the incidence of 30-day major adverse cardiac events (MACE), which included index visit and incident AMI and cardiac death within 30 days (in accordance with previous similar studies).
Follow-up
Patients were followed up at 30 days by research nurses checking the inpatient course and contacting the patient via telephone, email, letter, or in person to establish data on the composite outcome of MACE with adjudication of AMI as described and their mortality status including the cause of death if applicable. If repeated attempts of contacting participants directly had failed, follow-up data were obtained from the patients’ primary care practitioners when possible.
Statistical analysis
Baseline characteristics were summarized using mean (standard deviation) or median (interquartile range) as appropriate. For evaluating the diagnostic accuracy of the Siemens TNIH assay at the 99th percentile upper reference limit at 0 and 3 h we calculated sensitivity, specificity, positive predictive value (PPV), and NPV using sex-specific cut-offs (female 40 ng/L and male 58 ng/L). Troponin concentrations were expressed in ng/L and rounded to integers. Both approaches were in accordance with the latest Laboratory Medicine Practice Guidelines (LMPG) on cardiac markers drafted in collaboration with the IFCC TF-CB.20 Paired comparison of diagnostic accuracy measures was performed with McNemar’s test. The overall diagnostic accuracy was summarized by calculating the area under the receiver operator curve (ROC) and graphically displayed. The area under the curve (AUC) of two ROC were compared using the DeLong method.21 An absolute troponin delta was mathematically defined as AΔ = |‘3 h-TNIH concentration’ − ‘0 h-TNIH concentration’| and a relative troponin delta as a percentage by the calculating RΔ = (AΔ × 100)/(‘0 h-TNIH concentration’). For calculation of the relative troponin delta in cases with a 0 h troponin concentration of 0 ng/L, the baseline troponin was conservatively adjusted to 0.49 ng/L. We further evaluated the diagnostic accuracy of absolute and relative troponin deltas by calculating sensitivity, specificity, PPV, and NPV and the number of patients ruled out or in at optimal sensitivity and specificity thresholds based on the respective ROC curve analysis. The optimal thresholds were chosen to maximize sensitivity at ≥99% or best possible and to maximize specificity at ≥95%, ≥97.5%, and ≥99% normally corresponding with a PPV >80%. An empirical cut-off [c] was calculated using Youden’s index [J] = maximum {Sensitivityc + Specificityc − 1} with a maximum J of 1 representing a perfect test.22 The proportion of patients suitable for AMI rule-out and the proportion with 30-day MACE were summarized using descriptive statistics as appropriate. Statistical analysis was undertaken using SPSS version 23.0 (SPSS Inc., Chicago, IL, USA) and STATA 13.1 (StataCorp LP, College Station, TX, USA) using the diagti, cutpt, roctab, and roccomp commands. Results are reported in accordance with the STARD criteria for diagnostic accuracy studies.23
Results
Of a total of 1613 patients included in the BEST study, there were 869 consenting participants who had 0 and 3 h samples analysed with the Siemens TNIH assay. We further excluded 57 participants for missing data on reference standard adjudication and 10 for lacking a delta time between ED arrival and the troponin at 0 h (t = 0) blood sample being drawn, resulting in a total of 802 participants included in this secondary analysis (Figure 2).
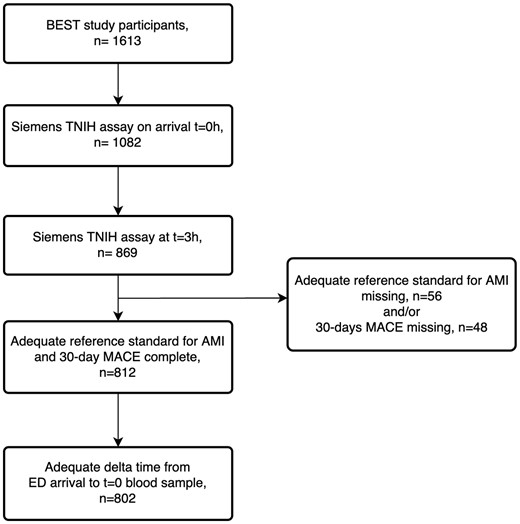
Participant flow chart. AMI, acute myocardial infarction; ED, Emergency Department; MACE, major adverse cardiac events.
The baseline characteristics of participants are summarized in Table 1. A total of 111 participants (13.8%) were diagnosed with AMI during their index visit. A total of 114 participants (14.2%) had one or more MACE within 30 days including 60 (7.5%) incident AMI and 4 (0.5%) cardiac deaths.
Baseline characteristics
| Total (n = 802) | AMI present (n = 111) | AMI absent (n = 691) | |
|---|---|---|---|
| Age (years), mean (SD) | 58.5 (15.0) | 65.1 (15.4) | 57.4 (14.6) |
| Men (%) | 507 (63.2) | 78 (70.3) | 429 (62.1) |
| Medical history | |||
| Previous myocardial infarction (%) | 232 (29.1) | 38 (34.2) | 194 (28.2) |
| Previous percutaneous coronary intervention (%) | 196 (24.6) | 32 (28.8) | 164 (23.9) |
| Previous coronary artery bypass (%) | 56 (7.1) | 14 (12.7) | 42 (6.2) |
| Previous stroke/TIA (%) | 53 (6.7) | 7 (6.5) | 46 (6.8) |
| Hypertension (%) | 394 (49.2) | 63 (56.8) | 331 (48.0) |
| Hyperlipidaemia (%) | 313 (39.5) | 49 (44.5) | 264 (38.7) |
| Type 1 diabetes mellitus (%) | 18 (2.3) | 4 (3.6) | 14 (2.0) |
| Type 2 diabetes mellitus (%) | 154 (19.3) | 26 (23.4) | 128 (18.7) |
| Current smoking (%) | 167 (20.8) | 27 (24.3) | 140 (20.3) |
| Family history of ischaemic heart disease (%) | 265 (33.0) | 38 (34.2) | 227 (32.9) |
| Time from symptom onset to t = 0 blood sample | |||
| 0–3 h (%) | 295 (36.8) | 42 (37.8) | 253 (36.6) |
| 3–6 h (%) | 232 (28.9) | 25 (22.5) | 207 (30.0) |
| 6–9 h (%) | 103 (12.8) | 16 (14.4) | 87 (12.6) |
| >9 h (%) | 172 (21.4) | 28 (25.2) | 144 (20.8) |
| ECG findings | |||
| ST depression (%) | 53 (6.7) | 15 (13.8) | 38 (5.5) |
| ST elevation (%) | 34 (4.3) | 9 (8.3) | 25 (3.7) |
| T-wave inversion (%) | 128 (16.2) | 30 (27.5) | 98 (14.4) |
AMI, acute myocardial infarction; ECG, electrocardiogram; SD, standard deviation; TIA, transient ischaemic attack.
Diagnostic accuracy at 0 and 3 h at the 99th percentile upper reference limit
At the 99th percentile upper reference limit with sex-specific cut-offs, the Siemens TNIH assays sensitivity for ruling out index visit AMI at 0 and 3 h was 72.1% [95% confidence interval (CI) 62.8–80.2] and 88.3% (95% CI 80.8–93.6), respectively. Diagnostic accuracy was not statistically different when using an overall cut-off (Supplementary material online, Table S1). Further diagnostic accuracy characteristics are summarized in Table 2. Of participants having a troponin level below the 99th percentile at 0 h 31 (4.5%) had an index visit AMI and 33 (4.7%) had a 30-day MACE while at 3 h index visit AMIs were lower at 13 (1.9%) and 30-day MACE was 15 (2.2%). No participant with a troponin concentration below the 99th percentile had a cardiac death within 30 days. The diagnostic accuracy of the Siemens TNIH assay for index visit AMI at 0 and 3 h equates to an AUC of 0.96 (95% CI 0.94–0.98) and 0.98 (95% CI 0.96–0.99), respectively (Figure 3).
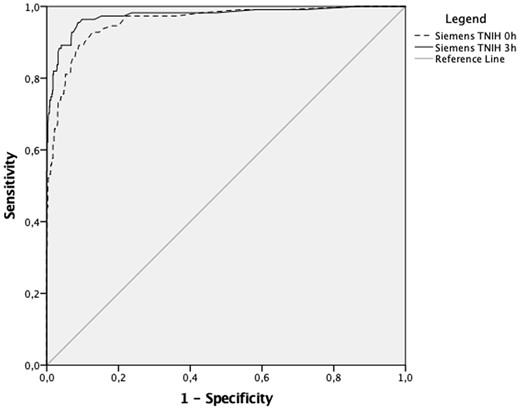
Receiver operator curve comparison of Siemens TNIH assay at 99th percentile at 0 and 3 h.
Siemens TNIH assay at 99th percentile (95% confidence intervals in parentheses)
| Siemens TNIH assay at 0 h with sex-specific 99th percentile | Siemens TNIH assay at 3 h with sex-specific 99th percentile | |||
|---|---|---|---|---|
| AMI | 30-Day MACE | AMI | 30-Day MACE | |
| Sensitivity | 72.1% (62.8–80.2) | 71.1% (61.8–79.2) | 88.3% (80.8–93.6) | 86.8% (79.2–92.4) |
| Specificity | 96.2% (94.5–97.5) | 96.4% (94.7–97.6) | 95.8% (94.0–97.2) | 95.9% (94.2–97.3) |
| PPV | 75.5% (66.2–82.3) | 76.4% (67.2–84.1) | 77.2% (68.9–84.1) | 78.0% (69.7–84.8) |
| NPV | 95.6% (93.7–97.0) | 95.3% (93.4–97.7) | 98.1% (96.7–99.0) | 97.8% (96.4–98.8) |
AMI, acute myocardial infarction; MACE, major adverse cardiac events; NPV, negative predictive value; PPV, positive predictive value.
In the subgroup sensitivity analysis of 295 early presenters with chest pain onset of <3 h (n = 295) at first troponin sampling the sensitivity for ruling out index visit AMI at the 99th percentile URL with sex-specific cut-offs was 54.8% (95% CI 38.7–70.2) and 88.1% (95% CI 74.4–96.0) at 0 and 3 h sampling, respectively. Additional diagnostic accuracy statistics including for 30-day MACE are summarized in Table 3. The AUC for index visit AMI at 0 h was 0.96 (95% CI 0.94–0.98) compared to 0.99 (95% CI 0.98–1.00) at 3 h with P = 0.002 (Figure 4).
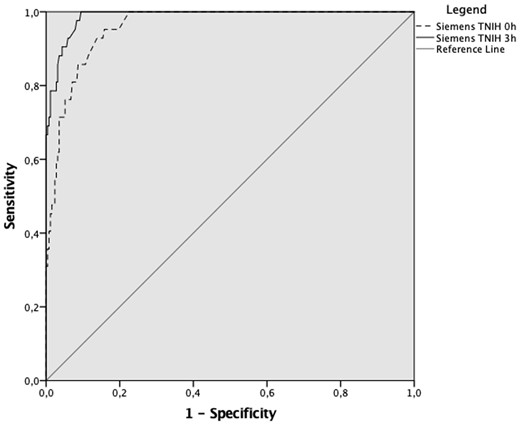
Receiver operator curve comparison of Siemens TNIH assay at 99th percentile at 0 and 3 h in early presenters.
Siemens TNIH assay at 99th percentile in early presenters (95% confidence intervals in parentheses)
| Siemens TNIH assay at 0 h with sex-specific 99th percentile | Siemens TNIH assay at 3 h with sex-specific 99th percentile | |||
|---|---|---|---|---|
| AMI | 30-Day MACE | AMI | 30-Day MACE | |
| Sensitivity | 55.8% (38.7–70.2) | 53.5% (37.7–68.8) | 88.1% (74.4–96.0) | 86.1% (72.1–94.7) |
| Specificity | 97.2% (94.4–98.9) | 97.2% (94.4–98.9) | 96.1% (92.9–98.1) | 96.0% (92.8–98.1) |
| PPV | 76.7% (57.7–90.1) | 76.7% (57.7–90.1) | 78.7% (64.3–89.3) | 78.7% (64.3–89.3) |
| NPV | 92.8% (89.0–95.6) | 92.5% (88.6–95.3) | 98.0% (95.4–99.3) | 97.6% (94.8–99.1) |
AMI, acute myocardial infarction; MACE, major adverse cardiac events; NPV, negative predictive value; PPV, positive predictive value.
Diagnostic accuracy and optimal troponin deltas of Siemens TNIH assay at 0/3 h
The diagnostic characteristics for the Siemens TNIH assay with an absolute 0/3 h troponin delta of <3 and <7 for ruling out index visit AMI and 30-day MACE and a sex-specific absolute troponin delta of <50% and <20% from the 99th percentile upper reference limit are summarized in Table 4. The AUC was 0.94 (95% CI 0.90–0.97) and 0.76 (95% CI 0.71–0.81) for absolute and relative 0–3 h troponin deltas, respectively (Figure 5). Empirical cut-off estimation established an optimal absolute troponin delta of AΔ = 11 with a Youden index of 0.82 and a relative delta of RΔ = 100% with a Youden index of 0.45. Optimizing the cut-off for absolute and relative delta troponin to achieve maximum possible sensitivity (≥95.5%) for rule out of index visit AMI, resulted in an absolute delta cut-off of ≥1 and a relative delta cut-off of ≥0.05% with both cut-offs ruling out 255 participants. Conversely, optimizing the cut-off of absolute and relative troponin deltas to achieve ≥99% specificity for rule in of index visit AMI resulted in an absolute delta cut-off of ≥38 and a relative delta cut-off of 302.2% achieving a PPV of 93.0% (95% CI 85.4–97.4) and 87.5% (95% CI 73.2–95.8), respectively. Additional optimized cut-offs with responding diagnostic characteristics are summarized in Table 5.
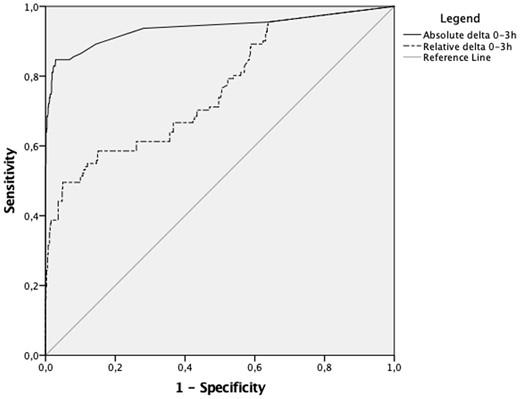
Receiver operator curve comparison of Siemens TNIH assay with absolute and relative 0–3 h delta.
Siemens TNIH assay with 0/3 h absolute troponin delta cut-offs (95% confidence intervals in parentheses)
| Absolute troponin delta at <3 ng/L | Absolute troponin delta at <7 ng/L | |||
|---|---|---|---|---|
| AMI | 30-Day MACE | AMI | 30-Day MACE | |
| Sensitivity | 87.4% (79.7–92.9) | 86.8% (79.2–92.4) | 84.7% (76.6–90.8) | 83.3% (75.2–89.7) |
| Specificity | 88.6% (86.0–90.8) | 88.8% (86.2–91.1) | 93.6% (91.5–95.3) | 93.8% (91.7–95.4) |
| PPV | 55.1% (49.7–60.5) | 56.3% (50.7–61.6) | 68.1% (59.6–75.8) | 68.8% (60.4–76.4) |
| NPV | 97.8% (96.4–98.6) | 97.6% (96.2–98.5) | 97.4% (95.9–98.5) | 97.1% (95.6–98.3) |
| Relative troponin delta at <20% | Relative troponin delta at <50% | |||
|---|---|---|---|---|
| AMI | 30-Day MACE | AMI | 30-Day MACE | |
| Sensitivity | 70.3% (60.9–78.6) | 70.2% (60.9–78.4) | 58.6% (48.8–67.8) | 57.9% (48.3–67.1) |
| Specificity | 53.6% (49.8–57.3) | 53.65 (49.8–57.4) | 74.1% (70.7–77.3) | 74.1% (70.7–77.4) |
| PPV | 19.6% (15.8–23.8) | 20.1% (16.2–24.3) | 26.6% (21.2–32.7) | 27.1% (21.6–33.1) |
| NPV | 91.8% (88.7–94.3) | 91.6% (88.4–94.1) | 91.8% (89.2–93.9) | 91.4% (88.8–93.6) |
AMI, acute myocardial infarction; MACE, major adverse cardiac events; NPV, negative predictive value; PPV, positive predictive value.
Optimized cut-offs for AMI with absolute vs. relative troponin delta (95% confidence intervals in parentheses)
| Threshold | Sensitivity | Specificity | PPV | NPV | # ruled in/out |
|---|---|---|---|---|---|
| Absolute delta | |||||
| ≥95.5% sensitivity = ≥1 | 95.5% (89.8–98.5) | 36.2% (32.6–39.9) | 19.4% (16.2–22.9) | 98.0% (95.5–99.4) | 255 |
| ≥95% specificity = ≥9 | 84.7% (76.6–90.8) | 96.0% (94.2–97.3) | 77.1% (68.6–84.2) | 97.5% (96.0–98.5) | 122 |
| ≥97.5% specificity = ≥15 | 82.9% (74.6–89.4) | 97.7% (96.3–98.7) | 85.2% (77.1–91.3) | 97.3% (95.8–98.3) | 108 |
| ≥99% specificity = ≥38 | 79.2% (70.0–86.6) | 99.1% (98.1–99.7) | 93.0% (85.4–97.4) | 97.0% (95.5–98.2) | 86 |
| Relative delta | |||||
| ≥95.5% sensitivity = ≥0.05% | 95.5% (89.8–98.5) | 36.2% (32.6–39.9) | 19.4% (16.2–22.9) | 98.0% (95.5–99.4) | 255 |
| ≥95% specificity = ≥106% | 49.6% (39.9–59.2) | 95.1% (93.2–96.6) | 61.8% (50.9–71.9) | 92.2% (89.9–94.0) | 89 |
| ≥97.5% specificity = ≥207.3 % | 38.7% (29.6–48.5) | 98.4% (97.2–99.2) | 79.6% (66.5–89.4) | 90.9% (88.6–92.9) | 54 |
| ≥99% specificity = ≥302.2% | 31.5% (23.0–41.0) | 99.3% (98.3–99.8) | 87.5% (73.2–95.8) | 90.0% (87.7–92.1) | 40 |
NPV, negative predictive value; PPV, positive predictive value.
External validation of rule out pathways
In the external validation of the ESC 0/3 h pathway, High-STEACS pathway, and the adapted ESC 0/2 h pathway we found sensitivities of 81.1% (95% CI 80.8–93.6) to 93.7% (95% CI 87.4–97.4) and 98.2% (95% CI 93.6–99.8) for the before mentioned pathways, respectively, when used with the Siemens TNIH assay for ruling out index visit AMI. The results of the external validation, the respective rule out and missed adverse events proportions of the respective three pathways are summarized in Table 6. Additional analysis of all three pathways in early presenters who had their first troponin sampling <3 h after symptom onset is provided in the Supplementary material online, Table S2.
Validation of Siemens TNIH assay with 0/3 h pathways (95% confidence intervals in parentheses)
| ESC | High-STEACS | Adapted ESC | ||||
|---|---|---|---|---|---|---|
| 0/3 h pathway | 0/3 h pathway | 0/2 h algorithm | ||||
| AMI | 30-Day MACE | AMI | 30-Day MACE | AMI | 30-Day MACE | |
| Sensitivity | 79.3% (70.6–86.4) | 77.2% (68.4–84.5) | 93.7% (87.4–97.4) | 93.0% (86.6–96.9) | 98.2% (93.6–99.8) | 97.4% (92.5–99.5) |
| Specificity | 98.6% (97.4–99.3) | 98.6% (97.3–99.3) | 84.7% (81.8–87.3) | 84.9% (82.0–87.5) | 72.8% (69.3–76.1) | 73.0% (69.5–76.3) |
| PPV | 89.8% (82.0–95.0) | 89.8% (82.0–95.0) | 49.5% (42.6–56.5) | 50.5% (43.5–57.4) | 36.7% (31.2–42.5) | 37.4% (31.9–43.1) |
| NPV | 96.7% (95.1–97.9) | 96.3% (94.6–97.6) | 98.8% (97.6–99.5) | 98.7% (97.4–99.4) | 99.6% (98.6–100) | 99.4% (98.3–99.9) |
| AMI rule out percentage and missed events, n (%) | ||||||
| AMI rule-out | 704 (87.8%) | 592 (73.8%) | 505 (63.0%) | |||
| Index visit AMI | 23 (3.3%) | 7 (1.2%) | 2 (0.4%) | |||
| 30-Day MACE | 26 (3.7%) | 8 (1.4%) | 3 (0.6%) | |||
| Cardiac death | 2 (0.3%) | 0 (0%) | 0 (0%) | |||
AMI, acute myocardial infarction; MACE, major adverse cardiac events; NPV, negative predictive value; PPV, positive predictive value.
Discussion
In this analysis, we have evaluated the diagnostic accuracy of the Siemens ADVIA Centaur TNIH assay when measured on arrival in the ED and 3 h later for the rule out of AMI and 30-day MACE. We established the assays performance at the 99th percentile, when using absolute and relative 0–3 h troponin deltas including optimized cut-offs. Furthermore, we reported the diagnostic performance of the assay when utilized in the ESC 0/3 h pathway, the High-STEACS pathway, and an adapted ESC 0/2 h algorithm.
Our findings demonstrate that using the Siemens TNIH assay to rule out AMI with tests drawn 3 h apart in the ED using the 99th percentile cut-off has suboptimal sensitivity for clinical purposes. Importantly, the low sensitivity of 72.1% at 0 h and 88.3% at 3 h is in line with earlier reported findings.8 However, sensitivity is substantially greater when using lower hs-cTn concentrations set at or just above the limit of quantification of the assay.17 Furthermore, sensitivity of the 3 h algorithms is enhanced by incorporating the combination of a 0 h cut-off set below the 99th percentile and an absolute delta change, as the ESC 0/2 h and High-STEACS algorithms both do.
With an AUC of 0.94 and 0.76 for absolute and relative 0–3 h troponin deltas, respectively, we have provided further evidence supporting the superior diagnostic accuracy of absolute troponin deltas.10,24 Furthermore, the AUC for absolute deltas reported by Reichlin et al.25 of the Siemens TNIH at 0.94 is identical to our findings. The sensitivity levels the Siemens TNIH assay reached in our analysis at cut-offs proposed in the subsequently evaluated rule out pathways did not get higher than 87.4% with an absolute 0–3 h delta of <3 ng/L for rule out of index visit AMI with diagnostic performance being even worse when using the other proposed cut-offs or 30-day MACE as outcome. Optimizing cut-offs a maximum sensitivity of ≥95.5% was achievable which would make such a strategy clinically unacceptable, as only 4 out of 10 emergency physicians were found to accept a 1% miss rate of 30-day MACE.26
While the before mentioned strategies on their own do not provide sufficient diagnostic accuracy, pathways like the ESC 0/3 h pathway, High-STEACS pathway, and adapted ESC 0/2 h algorithm evaluated in our analysis provided better performance.
Of the three strategies, the adapted ESC 0/2 h algorithm outperformed the other two pathways with superior sensitivity of 98.2% for AMI and 97.4% for 30-day MACE with corresponding NPVs of 99.6% and 99.4% thus supporting previously published findings on this approach.7,8 It is worth noting that while we used the originally proposed cut-offs of the 0–2 h algorithm, our analysis used an absolute 0–3 h troponin delta instead of the 0–2 h absolute troponin delta as we had no 2 h blood samples available for analysis. While this in theory could have increased the diagnostic accuracy to some degree we feel it mainly provides reassurance that the adapted ESC 0/2 h algorithm performs equally well at a 0–3 h absolute delta. Further evaluation with 0–2 h samples would be beneficial to confirm the 0–2 h absolute delta.
The High-STEACS pathway showed reasonable sensitivity at 93.7% and a good 98.8% NPV but a marked decrease in sensitivity compared to the 98.0% reported in the original validation of the pathway with the Siemens TNIH assay. While Chapman et al.18 reported a much lower 90.8% sensitivity and 98.0% NPV when using the ESC 0/3 h pathway, our analysis showed even lower diagnostic accuracy with 79.3% sensitivity and 96.7% NPV. A notable difference potentially affecting diagnostic accuracy between both analyses was the use of the Atellica IM analyser compared to the ADVIA Centaur analyser in our study.
In a related study comparing diagnostic accuracy of the ESC 0/3 h pathway and High-STEACS pathway in conjunction with the Abbott Architect Stat hs-cTnI assay the High-STEACS pathway equally outperformed the ESC 0/3 h pathway with a sensitivity of 97.7% and 89.3% and NPV of 99.5% and 97.9%, respectively.9
We further acknowledge that for a definitive rule out of AMI in the ESC 0/3 h pathway, patients would have to meet additional requirements of being pain free, having a GRACE score of <140 and having other differential diagnoses excluded.3 Our data did not allow for assessing those requirements and this may have negatively affected the diagnostic performance of the ESC 0/3 h pathway. While Chapman et al.9,18 did show an increase in diagnostic accuracy when incorporating those additional requirements in the ESC 0/3 h pathway, diagnostic performance was still inferior to the High-STEACS pathway. Therefore, the additional requirements might partially explain the lower diagnostic accuracy characteristics in our analysis compared to those reported by Chapman et al., but are unlikely to increase the overall ESC 0/3 h pathway performance to a level comparable to the High-STEACS pathway or adapted ESC 0/2 h algorithm.
Using at the time of the study valid third universal definition of myocardial infarction for adjudication rather than the presently used fourth universal definition could present a further limitation.27 Readjudication was not considered feasible considering the resources this would have required. With one major difference being the introduction of the concept of myocardial injury this holds the theoretical potential of wrongly adjudication of AMI in cases of myocardial injury under the old definition. However, the likelihood of overadjudication of AMI under the third universal should be minimal as the inclusion criteria of the study meant that patients had to have chest pain of suggested cardiac nature which would mean rightful adjudication of AMI in cases with a significant rise or fall of troponin.
Conclusion
Using the Siemens TNIH assay, AMI should not be ruled out purely based on the absence of a hs-cTn concentration above the 99th percentile on serial sampling over 3 h, or purely based on the absence of a relative or absolute 0–3 h troponin delta. Using a validated pathway that incorporates both bespoke ‘rule-out’ cut-offs and delta criteria, accuracy improves. In our external validation of three existing pathways the adapted ESC 0/2 h algorithm outperformed the High-STEACS and ESC 0/3 h pathway.
Supplementary material
Supplementary material is available at European Heart Journal – Acute Cardiovascular Care online.
Data availability statement
The data underlying this article cannot be shared publicly due to the privacy of individuals that participated in the study. The data will be shared on reasonable request to the corresponding author if possible.
Funding
This study was sponsored by Manchester University NHS Foundation Trust. Reagents for the purpose of this research were donated by Siemens Healthineers. The Bedside Evaluation of Sensitive Troponin (BEST) study also received funding from the following sources (for separate analyses, not presented here): European Union Horizon-2020 scheme; the Royal College of Emergency Medicine; and Abbott Point of Care.
Conflict of interest: R.B. declares receiving speaker fees from Roche and LumiraDx. The Chief Investigator’s institution has received research funding from Roche and Abbott Point of Care. All other authors declared no conflict of interest.

Comments