


Abstract
Red imported fire ant (Solenopsis invicta Buren; RIFA) and black imported fire ant (Solenopsis richteri Forel (Hymenoptera: Formicidae); BIFA) are considered distinct species with introgression via a reproductively functional hybrid (HIFA). The RIFA and BIFA common names are based on relative coloration. Due to human color perception variation, using color to identify RIFA, BIFA or HIFA is challenging. Fire ant identification traditionally involves molecular or chemical techniques, but a colorimetric test could allow rapid and low-cost identification. In this study, ant integument coloration was measured by spectrophotometer, and color attributes were compared to a combined gas chromatography (GC) index derived from cuticular hydrocarbon and venom alkaloid indices. Significant Pearson Correlation coefficients were found for colony GC index versus color attributes red to green (a*), blue to yellow (b*), chroma (C*), and hue (h*), but not lightness (L*). The RIFA colonies were distinct from BIFA for four of five color attributes and plots of the a*b* and C*h* horizontal axis of the L*a*b* and L*C*h* color spaces. Color attributes for HIFA indices were not distinct from BIFA and RIFA parental species, but HIFA a*b* and C*h* plots were distinct from RIFA and a*b* plots from BIFA. Color attributes a*, b*, and C* increased and h* decreased with GC index in a sinusoidal pattern. In conclusion, most RIFA and BIFA color attributes were distinct and a*b* and C*h* color axes plots had potential to distinguish HIFA from parental species, but coloration of HIFA indices was variable and complicated identifications among HIFA phenotypes, RIFA and BIFA.
The red imported fire ant (Solenopsis invicta Buren; RIFA) and the black imported fire ant (Solenopsis richteri Forel (Hymenoptera: Formicidae); BIFA) are two closely related species belonging to the saevissima species complex (Trager 1991, Tschinkel 2006). Both species are serious agricultural and urban pests causing about $6.7 billion in annual losses in the United States, and their populations are still expanding northward into new areas (eXtension 2020). Before the acceptance of their species status (Buren 1972), BIFA and RIFA were considered color variants of the same species. In early literature, S. richteri was referred to as the ‘dark phase’ having blackish-brown color and S. invicta as the ‘light phase’ having reddish-brown color (Tschinkel 2006). These color differences are the basis for the ‘red’ and ‘black’ colors in the RIFA and BIFA common names, respectively.
Hybridization of BIFA and RIFA has been detected in the introduced U.S. range (Vander Meer et al. 1985), resulting in the wide distribution of a reproductively functional hybrid (HIFA) in Alabama, Arkansas, Georgia, Mississippi, and Tennessee (Graham et al. 2005, Streett et al. 2006, Gardner et al. 2008, Oliver et al. 2009, Pandey et al. 2019, eXtension 2020). In the South American range, reproductive isolation was reported for RIFA and BIFA (Ross and Shoemaker 2005), but others indicate the potential for cryptic species and introgressive gene flow (Pitts et al. 2005, Calcaterra et al. 2007).
The ability to identify imported fire ant (IFA) species and their hybrid is important when matching ant populations with classical biocontrol agents (Porter and Briano 2000, Sánchez-Restrepo et al. 2020). Although RIFA populations extend over a large area in the southern United States (eXtension 2020), BIFA and HIFA predominate the northern portions of the IFA range (Oliver et al. 2009, Pandey et al. 2019). In locations like west Tennessee, BIFA populations appear to be shifting to HIFA (Pandey et al. 2019). The geographical dynamics of all these IFA populations necessitates taxonomic identification of IFA to improve targeting of classical biological control agents.
The integument of ants can vary greatly in structure, texture, and color (Wheeler 1910). Morphological characteristics like color can be used for identification and verification of species in some insects (Brower 1959, Lehnert et al. 2011). In addition to subtle differences in BIFA and RIFA morphological characteristics, variations in color also may have taxonomic value (Buren 1972). However, these IFA species and their hybrid are still mostly distinguished by esterase-based genetic markers or differences in chemical composition of cuticular hydrocarbon and venom alkaloid profiles detected with gas chromatography and mass spectrometry (Vander Meer et al. 1985, Ross et al. 1987). Measurement of integument coloration might provide a faster and less expensive method to identify BIFA, RIFA, or HIFA than molecular or cuticular and venom alkaloid analysis. The objective of this study was to determine the differences in integument coloration of BIFA, RIFA, or HIFA identified by cuticular hydrocarbon and venom alkaloid gas chromatography profiles.
Materials and Methods
Fire ant colony samples collected during a previous Tennessee survey were used in this study (Pandey et al. 2019). The identity of each colony was determined using gas chromatography (GC) to calculate a combined GC index (hereafter called ‘index’ or ‘indices’) from the cuticular hydrocarbon (IHC) and venom alkaloid (IALK) indices (Ross et al. 1987, Pandey et al. 2019). The index identifies S. richteri (index ≤ 0.06) or S. invicta (index ≥ 0.85) parental species, as well as the HIFA phenotype (index range = 0.061–0.849). To evaluate color differences, colony samples were grouped by BIFA and RIFA parental species, and HIFA colonies were grouped into eight index ranges (B = 0.061–0.1, C = 0.11–0.2, D = 0.21–0.3, E = 0.31–0.4, F = 0.41–0.5, G = 0.51–0.6, H = 0.61–0.7, I = 0.71–0.849; Table 1). For each parental species and HIFA index range, 10 colonies were randomly selected for color assessment. The average index, cuticular hydrocarbon index, and venom alkaloid index also were calculated for these 10 randomly selected colonies (Table 1). Due to limited RIFA availability in the Tennessee survey, RIFA colony samples were obtained from a Gainesville, Florida site. All ant samples were frozen alive and stored at −80°C before use in color assessment. Worker ants from each colony were placed in one cell of a 96-well microplate (Costar 3364 Standard Nontreated PP Flat Well, Fisher Scientific, Pittsburgh, PA). The microplate cell when full held an average (±SE) of 120.7 ± 6.8 worker ants (n = four colonies sampled four times) with about 15 workers visible on the surface and was imaged under the 10-mm diameter aperture of a Konica Minolta CM-2600d spectrophotometer (Konica Minolta, Tokyo, Japan) set in observer illuminant Daylight 65, observer angle at 10° (International Commission on Illumination [CIE] 1964), specular component included (SCI), ultraviolet at 100%, and using SpectraMagic software (Version 3.61 Release No. 2, Konica Minolta, Tokyo, Japan). For each colony replicate, four subsample scans were made after stirring the ants in the microplate cell between color scans.
Colony abbreviation groups for different combined GC, venom alkaloid, and cuticular hydrocarbon indices and average (±SE) indices for 10 BIFA, RIFA, or HIFA colonies and designation of the average value as BIFA, RIFA, or HIFA
| Colony group abbrev.a | Combined GC index rangeb | GC indices for colony groupsc | |||||
|---|---|---|---|---|---|---|---|
| Combined GC | Venom alkaloid | Cuticular hydrocarbon | |||||
| Average (±SE) | Type | Average (±SE) | Type | Average (±SE) | Type | ||
| A | ≤0.06 | 0.041 ± 0.0055a | BIFA | 0.088 ± 0.0080a | +HIFA | −0.049 ± 0.0155a | −BIFA |
| B | 0.061–0.10 | 0.078 ± 0.0035b | HIFA | 0.150 ± 0.0070a | +HIFA | −0.051 ± 0.0153a | −HIFA |
| C | 0.110–0.20 | 0.163 ± 0.0081c | HIFA | 0.259 ± 0.0170b | +HIFA | 0.062 ± 0.0178b | −HIFA |
| D | 0.210–0.30 | 0.244 ± 0.0104d | HIFA | 0.273 ± 0.0503b | +HIFA | 0.215 ± 0.0483c | −HIFA |
| E | 0.310–0.40 | 0.370 ± 0.0085e | HIFA | 0.446 ± 0.0301c | +HIFA | 0.313 ± 0.0255cd | −HIFA |
| F | 0.410–0.50 | 0.475 ± 0.0093f | HIFA | 0.615 ± 0.0261de | +HIFA | 0.334 ± 0.0299d | −HIFA |
| G | 0.510–0.60 | 0.541 ± 0.0067g | HIFA | 0.522 ± 0.0615cd | −HIFA | 0.560 ± 0.0588e | +HIFA |
| H | 0.610–0.70 | 0.628 ± 0.0010h | HIFA | 0.635 ± 0.0255e | +HIFA | 0.622 ± 0.0380ef | −HIFA |
| I | 0.710–0.84 | 0.728 ± 0.0074i | HIFA | 0.746 ± 0.0212f | +HIFA | 0.710 ± 0.0173f | −HIFA |
| J | ≥0.85 | 1.062 ± 0.0292j | RIFA | 1.101 ± 0.0300g | +RIFA | 1.023 ± 0.0439g | −RIFA |
| χ 2 = 858.3; df = 9; P < 0.001 | χ 2 = 465.0; df = 9; P < 0.001 | χ 2 = 489.0; df = 9; P < 0.001 | |||||
aEach colony group abbreviation letter designates 10 colony replicates. Colonies within groups were randomly selected from all the colonies with indices in the combined GC index range.
bCombined GC index ranges were defined as BIFA (≤0.06), RIFA (≥0.85), or HIFA (0.061–0.849) (Ross et al. 1987). With the exception of groups B and I, the HIFA range categories were arbitrarily set at increasing increments of 0.09.
cThe average (±SE) was calculated from 10 randomly selected colonies having indices that fell within the colony group combined GC index range. Means followed by different letters within a column were significantly different using a Proc GLIM for a normal distribution with Tukey’s test for mean separation. Type refers to the BIFA, HIFA, or RIFA classification for the average combined GC, venom alkaloid, or cuticular hydrocarbon indices according to Ross et al. (1987). For venom alkaloid and cuticular hydrocarbon, type values with + or − indicate the gas chromatography value was larger or smaller than the combined GC index, respectively. Because the combined GC index is a composite of the venom alkaloid and cuticular hydrocarbon indices, some colony groups had different type designations than the combined GC index for venom alkaloid or cuticular hydrocarbon indices (e.g., colony group A which had BIFA combined GC index, HIFA venom alkaloid index, and BIFA cuticular hydrocarbon index).
The IFA colony color was quantified using L*a*b* and L*C*h* color spaces. Color spaces are specific color models or systems that quantify colors into numeric values. The L*a*b* color space is one of the uniform color spaces defined by the International Commission on Illumination (CIE) in 1976 (Konica-Minolta 2007). It is a three-dimensional color space with color attributes lightness (L*) on the perpendicular axis and red to green (a*) and blue to yellow (b*) on the horizontal axes. The L*C*h* color space, similar to L*a*b*, measures lightness (L*), chroma (C*), and hue (h*). With L* as a common color attribute in both color spaces, L*a*b* measures rectangular color coordinates and L*C*h* measures cylindrical color coordinates (Konica-Minolta 2007). Lightness (L*) in the CIE L*a*b* and L*C*h* color spaces is luminous intensity, which ranges from 0 to 100 on the perpendicular axis with 0 being black and 100 being white. The red to green plane (a*) has +a* as the red axis and −a* as the green axis and the blue to yellow plane has +b* as the yellow axis and −b* as the blue axis. Hue (h*) defines the primary color of an object, which is directly related to the electromagnetic wavelength (e.g., blue, red, green, yellow). Hue is expressed as an angle, which starts at 0° (+a* [red]), 90° (+b* [yellow]), 180° (−a* [green]), and 270° (−b* [blue]). Chroma defines the vividness or dullness of color intensity with values of zero being achromatic. For each color attribute, the four subsample scans for each colony were averaged to obtain a single colony color attribute value for analysis.
A Pearson’s Correlation analysis was used to determine correlations among colony indices and the L*, a*, b*, C*, or h* color attributes. Color attributes also were compared to the colony indices with a Generalized Linear Interactive Model (GLIM) using a Poisson distribution with dscale to adjust for over dispersion, which provided the best criteria values for assessing goodness of fit. Means were separated with the LS Means using GLIM in SAS 9.3 (SAS Institute, Cary, NC).
Results
Pearson Correlation coefficients for the relationship of the colony index to color attributes were significant for a* (r = 0.5531; P < 0.001), b* (r = 0.3839; P < 0.001), C* (r = 0.4633; P < 0.001), and h* (r = −0.4528; P < 0.001), but not L* (r = 0.0303; P = 0.7647). All color attributes had positive correlations with colony index, except for h*, which was inversely correlated with index. Significant differences were detected among colony indices for color attribute values of a* (F = 10.26; df = 9, 90; P < 0.001), b* (F = 7.96; df = 9, 90; P < 0.001), C* (F = 9.64; df = 9, 90; P < 0.001), and h* (F = 5.44; df = 9, 90; P < 0.001), but not L* (F = 0.74; df = 9, 90; P = 0.6712) (Fig. 1). The RIFA and BIFA species were distinct for a*, b*, C*, and h* color attributes, but not L* (Fig. 1). Most HIFA index ranges were significantly different from RIFA for a* and C* with the exception of group G and for b* with the exception of group D and G (Fig. 1). In contrast, most HIFA ranges were similar to RIFA for h* except group D (Fig. 1). In general, HIFA h* values declined in a sinusoidal pattern as indices increased from BIFA to RIFA, whereas a*, b*, and C* followed somewhat of a bell-shaped to sinusoidal pattern as indices increased from BIFA to RIFA (Fig. 1).
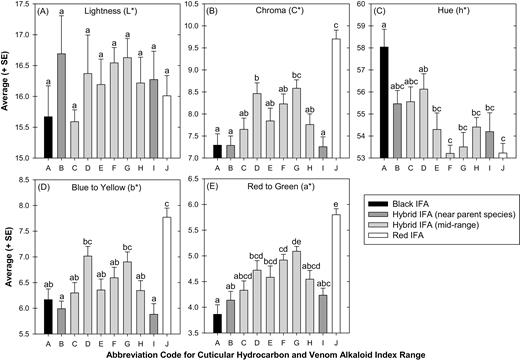
Average (±SE) color attributes for (A) lightness (L*), (B) chroma (C*), (C) hue (h*), (D) yellow to blue (b*), or (E) red to green (a*) plotted against the abbreviated code for the combined GC index (Table 1). Letter abbreviations correspond to average combined GC indices of (A) ≤ 0.06 (BIFA), (J) ≥ 0.85 (RIFA), or HIFA colonies of (B) 0.061−0.1, (C) 0.11−0.2, (D) 0.21−0.3, (E) 0.31−0.4, (F) 0.41−0.5, (G) 0.51−0.6, (H) 0.61−0.7, or (I) 0.71−0.849 (Table 1). Data were analyzed with a GLIM under a Poisson distribution with means separated using LS Means. Bars with different letters were significantly different (P < 0.05).
Since no differences were detected among colony indices for the L* attribute in the Pearson correlation coefficients or GLIM analysis, the horizontal axes of a*b* (Fig. 2A) and C*h* (Fig. 2B) were plotted without the L* perpendicular axis of the L*a*b* and L*C*h* color spaces for the different colony indices. For the plot of the a*b* axes, RIFA colonies had the highest yellow and red values, BIFA had the lowest red value, and HIFA colonies were intermediate between the parental BIFA and RIFA colonies (Fig. 2A). The HIFA index range nearest to BIFA (i.e., group B) or nearest to RIFA (i.e., group I) had the lowest yellow values among all of the colony indices and the next lowest red values after BIFA colonies (Fig. 2A). These colony indices plotted in the C*h* axes also had a similar pattern to the a*b* plots (Fig. 2B). All of the colony indices in the C*h* plots had hue angle values between 53.2° (RIFA and HIFA group F) to 58.0° (BIFA). A hue angle value of 45° would be midpoint between pure yellow (90°) and pure red (0°), so all colony indices were more yellowish than reddish in color. In the C*h* plots, C* was the factor that varied the most among colony indices with RIFA having the most vivid C* (9.7), and BIFA and HIFA colonies nearest BIFA (i.e., group B) or nearest RIFA (i.e., group I) having the dullest C* values (7.26–7.29; Fig. 2B). Most of the other HIFA indices were intermediate between BIFA and RIFA in C* values (7.65–8.58; Fig. 2B).
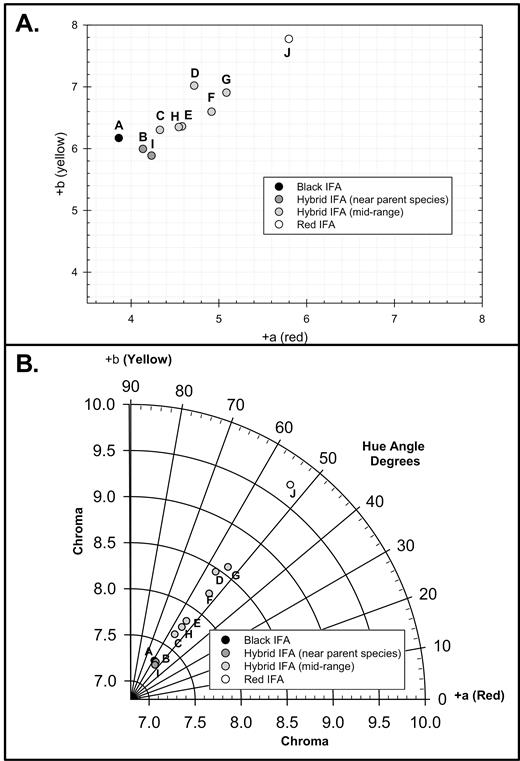
Average (A) a*b* and (B) C*h* horizontal axes plots without the L* perpendicular color space axis for different colony indices (A–J) (Table 1). The lightness (L*) perpendicular axis of the L*a*b* and L*C*h* color space was removed based on no detected differences in L* among combined GC indices using Pearson correlation coefficients or GLIM analysis. Letter abbreviations correspond to average combined GC indices of (A) ≤ 0.06 (BIFA), (J) ≥ 0.85 (RIFA), or HIFA colonies of (B) 0.061–0.1, (C) 0.11–0.2, (D) 0.21–0.3, (E) 0.31–0.4, (F) 0.41–0.5, (G) 0.51–0.6, (H) 0.61–0.7, or (I) 0.71–0.849 (Table 1).
Discussion
Traditional morphological identification of IFA species can be a challenge for nontaxonomic experts, especially when species are morphologically similar, or there are confounding issues like cryptic species or hybridization events (Trager 1991, Pitts et al. 2005, Calcaterra et al. 2007). Other methods employed to identify Solenopsis species have included molecular or chemical analyses, but these techniques can be costly or time consuming (Vander Meer et al. 1985, Ross et al. 1987). Fire ant coloration, if related to BIFA, RIFA, or HIFA colony indices, could provide an alternative to identification by morphological characters or chemical and molecular analyses, especially in the introduced IFA range where confounding factors like cryptic species may be less relevant. The use of visual characteristics to classify insects is not a new idea. Martineau et al. (2017) recently reviewed 44 studies that attempted to automate insect identification using pattern recognition software. Depending on the complexity of the computer models, the diversity of the image databases, and the characteristics used to differentiate species, Martineau et al. (2017) was able to achieve a high degree of identification accuracy. A fast and cost-effective colorimetric method would facilitate IFA species identification in the laboratory or field by regulatory agencies or diagnostic laboratories. The colorimetric method also could be amendable to high-throughput automated identification.
Lateral flow immunoassay is another IFA assessment technique that has been developed to facilitate rapid and portable field detection of RIFA, BIFA, and HIFA (Valles et al. 2016, 2018). The commercialized InvictDetect ImmunoStrip (Agdia, Inc., Elkhart, IN) reacts with worker ant proteins from RIFA colonies or HIFA colonies near RIFA, but it cannot be used to determine the colony indices or if the ants are HIFA or RIFA. Likewise, the noncommercialized multiplexed lateral flow immunoassay detects proteins associated with RIFA, BIFA, or HIFA but depending on protein amounts, HIFA close to RIFA or HIFA close to BIFA may not be distinguished from the parent species (Valles et al. 2018). Thus, a colorimetric test to rapidly recognize BIFA, HIFA, or RIFA, as well as to estimate the approximate HIFA index range, could be useful for some research and field applications where general taxonomic identity of IFA is needed.
This study found differences in integument coloration among BIFA, HIFA, and RIFA colonies based on individual color attributes (Fig. 1). With the exception of the lightness (L*) attribute, RIFA and BIFA colonies had distinct integument coloration for a*, b*, C*, and h* color attributes. Likewise, significant Pearson’s correlations were detected between color attributes and colony indices, which suggest IFA coloration may be predictive of BIFA and RIFA species or HIFA phenotype as defined by cuticular hydrocarbons and venom alkaloids. However, none of the individual color attributes provided distinctive statistical separations of all the HIFA colonies from either of the parent species. All IFA colonies had similar lightness (L*) values, so L* had limited value for predicting indices. The similar L* values among BIFA, HIFA, and RIFA (range 15.5–16.7) may reflect similarity in dark and light body patterns, despite color variations. The h* color attribute decreased in somewhat of a sinusoidal pattern as indices increased from BIFA to RIFA, and a similar inverse pattern was observed in C*, b*, and a*. The explanation for the sinusoidal pattern is unknown, but might indicate polygenic involvement in the expression of color traits among colony indices.
Although individual color attributes were less useful for separating HIFA index ranges from RIFA or BIFA (Fig. 1), HIFA and BIFA plotted distinctly from RIFA in the a*b* (Fig. 2A) or C*h* (Fig. 2B) horizontal color space axes without the perpendicular L* axis. Likewise, all HIFA colony indices plotted intermediately between BIFA and RIFA in the a*b* plots (Fig. 2A); and therefore, HIFA colonies potentially could be separated from the parental species. The HIFA colonies with indices near BIFA (i.e., group B) or near RIFA (i.e., group I) had a*b* plots closest to BIFA (Fig. 2A). Similarly, all of the IFA colonies in this study had a hue angle between 53.2° (RIFA) and 58.0° (BIFA), when C*h* axes were plotted without the perpendicular L* axis, so IFA colonies were more yellowish than reddish with RIFA having the most reddish coloration. Most HIFA colony indices were intermediate between BIFA and RIFA for C* in the C*h* plots, but the exception was again B and I groups that plotted too close to BIFA to distinctly separate (Fig. 2B).
None of the individual color attributes or a*b* and C*h* axes plots were predictive of a particular HIFA index range and similarities among HIFA groups like B and I and BIFA complicated using color for specific index predictions. Because HIFA color attributes increased and decreased (a*, b*, and C*) or decreased and increased (h*) in a sinusoidal pattern as indices increased, it would be very difficult to use color to identify a particular HIFA index. It also is unclear why the HIFA colonies with indices closest to RIFA (i.e., group I) had coloration attributes more similar to BIFA. It is possible the HIFA index ranges selected in this study are not representative of distinct HIFA phenotypes between the BIFA and RIFA parental species. There may be fewer or more divisions between the parental species related to introgression events than our selected index ranges. Another explanation for variability in HIFA index colorations could be an absence of color relationship to IFA identities derived from cuticular hydrocarbon and venom alkaloid indices, although the significant Pearson Correlation coefficients for a*, b*, C*, and h* suggest the opposite. Cuticular hydrocarbon and venom alkaloid analyses used to determine IFA index values also are not an error-free method of IFA identification, which could be another source of data confounding. A third possibility could be cryptic species within the IFA dataset that do not match well with color patterns and species indices. In South America, diversity in Solenopsis species and suspected gene flow among species has been associated with diversity in chromatogram patterns, and lighter coloration also was suggested as an indication of a cryptobiotic life form related to RIFA and Solenopsis quinquecuspis Forel hybridization (Calcaterra et al. 2007). Pitts et al. (2005) concluded that closely related Solenopsis species that had recently diverged would be expected to have few informative morphological characters, and that phylogeny of characters would be further confused by hybridization events or ancestral polymorphisms resulting from a lack of lineage sorting. Although it is possible that IFA coloration does not relate directly to ancestral origins, the repeating sinusoidal patterns observed in color attributes as indices increase from BIFA to RIFA suggests some type of pattern relationship among colony groupings. Finally, to scan IFA in this study, ~120 worker ants from a colony, which had been previously frozen alive and stored at −80°C, were loaded into a microplate cell, scanned with a spectrophotometer, stirred, and scanned again (repeated four times) and then an average color attribute value was determined. The whole-body method of scanning multiple workers, which were piled in various orientations during each scan, would produce greater variability than focusing scans on a single site on the ant body. However, spectrophotometer aperture size was a limiting factor, and scanning groups of ants from the same colony avoided background reflectance that would occur when scanning a single ant that did not fill the entire aperture opening. The group ant scanning method also was fast and suitable for rapid use on large numbers of samples. This study did not determine if freezing of live worker ants and subsequent storage at −80°C for a year or longer modified integument coloration relative to freshly killed ants, but color modifications from freezing of ants should be considered a possible factor if utilizing study data for ant coloration comparisons.
In conclusion, BIFA and RIFA had distinct coloration that could be used to separate the two species for a*, b*, C*, and h* color attributes. These individual color attributes were not distinctive for separating HIFA from RIFA or BIFA or for distinguishing specific HIFA index phenotypes. Graphical plots of a*b* and C*h* horizontal color axes without the perpendicular L* axis also resulted in distinct separation of BIFA and HIFA from RIFA (Fig. 2A and B), and positioned HIFA colonies between BIFA and RIFA in the a*b* plots. Therefore, a*b* and C*h* plots had the most potential for separating RIFA, BIFA, and HIFA, rather than individual color attributes. The colorimetric analysis of IFA colonies has the potential for rapid IFA identification and also could be complimentary to other more time-consuming laboratory techniques like chromatograms or molecular methods or to support identifications with other rapid techniques like the InvictDetectImmunoStrip.
Disclaimer: Mentioning of product names is for information purposes only and does not imply an endorsement by the authors or their institutions.
Acknowledgments
We would like to thank Megan Patton for lab support and Dr. Steven Valles (USDA-ARS Center for Medical, Agricultural and Veterinary Entomology, Gainesville, FL) for providing RIFA samples. This project was partially funded by United States Department of Agriculture Animal Plant Health Inspection Service Cooperative Agreement Number AP17PPQS&T00C047, United States Department of Agriculture National Institute of Food and Agriculture Evans Allen funding under project number TENX-1821-CCOCP, and the United States Department of Agriculture Floriculture and Nursery Research Initiative project number 58-8020-8-009.
