


Abstract
The globe skimmer dragonfly, Pantala flavescens Fabricius (Odonata: Libellulidae), is a long-distance migrant, well adapted to exploiting ephemeral waterbodies. This species occurs in Japan every summer, but overwintering has only been recorded on subtropical Ishigaki Island. It is not known from where the summer immigrants originate, nor what proportion of the globe skimmers seen in Japan are of local origin. We analyzed stable hydrogen isotope (δ 2H) composition of wings of 189 P. flavescens captured at six sites in Japan from August to September in 2016 (n = 57) and from April to November in 2017 (n = 132). We determined that the majority of individuals were immigrants. Individuals of probable Japanese origin occurred only later in the year and were of lower mass on average than immigrants. Immigrants potentially originated from a broad area as far west as northern India and the Tibetan Plateau and, especially late in the season, as near as northcentral China and the Korean peninsula. However, for April samples, the most parsimonious interpretation suggested southern origins, in northern Myanmar to southern China, or possibly Borneo-Sulawesi. Our investigation underlines the power of combining stable isotope data with other information such as wind speed and direction, arrival dates, and body mass to estimate origins and to understand the life history of this and other insects.
One of the most spectacular examples of animal migration is the intercontinental movement of the globe skimmer dragonfly Pantala flavescens Fabricius. As its common name implies, this species is broadly distributed across the globe (Fraser 1936, Russell et al. 1998, Corbet 1999) and one of its most prominent hypothesized movements involves the multigenerational circular trip from northern India, potentially including the Himalayas and the Tibetan plateau, through east Africa, on a journey exceeding 14,000 km (Fraser 1936, Anderson 2009, Hobson et al. 2012a). These movements are facilitated in part by a short larval stage (~6 wk, compared with a more typical 10 mo or more), which allows the species to make use of ephemeral (often monsoonal) waterbodies, relatively free from long-lived predators (Corbet 1999). Migratory flights also make use of high-altitude winds (especially those associated with movements of the Inter-Tropical Convergence Zone, ITCZ) and benefit from the use of gliding combined with powered flight, as well as an ability to feed on the wing while traveling (Anderson 2009, Li et al. 2014).
Despite widespread interest in the origins and movements of P. flavescens, little is known about its migratory behavior and current reports are largely anecdotal. This lack of understanding derives from the fact that it is extremely difficult to track individual small insects, especially at large spatial scales, since technological advances in tracking vertebrates have typically not been refined for insects (Chapman et al. 2015, but see Wikelski et al. 2006, Knight et al. 2019). However, the advent of stable isotope-tracking methods, which rely solely on endogenous signals present in animals, has revolutionized the way in which origins of small insects can be tracked (Hobson and Wassenaar 2019). The most prominent use of this technique has been directed at the migration of the eastern population of the Monarch Butterfly, Danaus plexippus Linnaeus (Lepidoptera: Nymphalidae), primarily using stable isotope measurements of deuterium (2H) in wing tissue (Wassenaar and Hobson 1998, Hobson et al. 1999). This approach has also been used by other researchers interested in Monarch patterns of spring recolonization in North America (Miller et al. 2012, Flockhart et al. 2013), the effects of natal origin on parasite loads (Altizer et al. 2015), the role of wing coloration in flight distance (Hanley et al. 2013), and conservation concerns related to individual origins (Flockhart et al. 2017). Stable isotope tracking of other insect species such as dragonflies (Hobson et al. 2012a) including P. flavescens (Hobson et al. 2012b, Cao et al. 2018) have since been conducted, and there is considerable promise that this approach will help elucidate origins of insect migrants on continental scales (reviewed by Stefanescu et al. 2016, Hobson et al. 2018, Hallworth et al. 2018). Such broad-scale analysis is required since work evaluating the population genetic structure of P. flavescens has revealed gene flow across large geographic areas, suggesting near-panmixia (Troast et al. 2016, Alvial et al. 2019; but see Pfeiler and Markow 2017).
In Japan, P. flavescens is a well-known summer migrant. Throughout most of the country, it occurs in large numbers during June–September, although some may be seen as early as April and as late as November (e.g., Kuwada 1972, Sugiura et al. 1999, Tanaka and Higashi 2003, Arai 2007, Iwata et al. 2009). Temperatures are mostly too cold for it to survive over winter, with eggs failing to hatch below about 15°C (Iwata et al. 2009, Ichikawa et al. 2016). However, in the subtropical southern islands, temperatures are potentially warm enough for P. flavescens to survive year-round and successful overwintering of larvae has been recorded on Ishigaki Island (Iwata et al. 2009, Watanabe 2019). Nevertheless, it is believed that most P. flavescens migrate into southern Japan every spring from warmer countries to the southwest and that from there the population rapidly increases, spreading northwards as summer progresses. For example, Arai (2007) reported that many adult P. flavescens were observed in the Ryukyu (Okinawa) Islands in spring and then moved northward as far as Hokkaido. Pantala flavescens is well known for its opportunistic reproductive strategies, with females laying eggs in small ponds and rice paddy fields, as well as swimming pools and puddles (Watanabe 1999, Sato 2004, Arai 2012, Hirake 2012). Females can lay more than 1,000 eggs per day if they encounter suitable oviposition sites (Ichikawa and Watanabe 2014). Eggs and larvae develop rapidly, completing development within roughly 50 d in Japan (Iwata et al. 2009, Ichikawa et al. 2016) as they do elsewhere (Hawking and Ingram 1994, Suhling et al. 2004). These biological characteristics result in rapid local population increase, with large numbers from what are believed to be locally bred subsequent generations being seen throughout Japan during the summer and autumn (Wakana 1959, Kuwada 1972, Arai 2007, Iwata et al. 2009). It is also known that typhoons influence the local distribution and abundance of P. flavescens, e.g., with dragonflies being observed from June to October on a weather ship located off southern Japan in the Pacific Ocean (29°N, 135°E), but with particularly large numbers being recorded when typhoons passed (Asahina and Turuoka 1967, 1968, 1969, 1970; Hashimoto and Asahina 1969).
Our objective here was to delineate possible origins of P. flavescens captured at various locations in Japan in 2016 and 2017 using stable hydrogen isotope analysis of wings (Hobson et al. 2012a, b). Captures took place during April–November, and we were especially interested in separating migrants from locally bred dragonflies. Prevailing winds during the summer are largely from mainland Asia toward Japan, and we speculated that nonlocal P. flavescens originated from East Asia, possibly from as far as northern India and Mongolia.
Materials and Methods
Field Collections
Our field collections are summarized in Table 1. Pantala flavescens specimens were individually stored at ambient condition for 24–48 h in paper envelopes. Following excretion of feces, body mass was measured using an electronic balance (to 0.0001 g). The sex and stage of individuals were identified by wing condition and color according to Ichikawa and Watanabe (2014). Specimens were then frozen and stored dry in paper envelopes until shipment to the Stable Isotope Hydrology and Ecology Laboratory of Environment Canada. All P. flavescens were individually numbered and their sex, maturity, and body weight were recorded (Fig. 1).
Summary of stable hydrogen isotope values of wings (δ 2Hw) of individual Pantala flavescens analyzed in this study
| Sample | Date | Latitude | longitude | δ 2Hp (‰) | δ 2Hw (‰) | n | Statistics |
|---|---|---|---|---|---|---|---|
| 2016 | |||||||
| Miyagi | 11 Aug. | 38°13′ N | 140°49′ E | −57 | −146.1 ± 10.8 | 20 | a |
| Saitama | 25 Aug. | 35°47′ N | 139°28′ E | −56 | −138.4 ± 8.0 | 11 | ab |
| Shiga | 7 Sept. | 35°15′ N | 136°13′ E | −58 | −131.6 ± 14.1 | 20 | b |
| Hokkaido | 15 Sept. | 43°04′ N | 141°20′ E | −54 | −145.7 ± 9.5 | 6 | a |
| 2017 | |||||||
| Kagoshima | 9–30 Apr. | 31°21′ −31°44′ N | 131°00′ −130°15′E | −45 | −110.5 ± 8.9 | 34 | a |
| Kagoshima | 30 May–9 Jun. | 31°19′ N | 130°54′E | −45 | −142.1 ± 9.1 | 6 | b |
| Shizuoka | 24 July−5 Aug. | 34°44′ −35°01′ N | 138°04′ −138°23′E | −55 | −130.9 ± 22.7 | 12 | c |
| Kagoshima | 5 Oct.−12 Nov. | 31°16′ −31°23′ N | 131°04′ −130°55′E | −45 | −129.3 ± 8.2 | 40 | c |
| Shizuoka | 24 Oct.–13 Nov. | 34°39′ N | 137°46′ −137°52′E | −55 | −123.9 ± 10.1 | 40 | c |
The δ 2Hp values correspond to predicted mean annual precipitation. δ 2H values were calculated for these locations using the waterisotopes.org calculator. The letters in the statistics column indicate differences among groups as determined by Tukey’s post hoc (P < 0.05) tests.

Prefecture areas of collection of Pantala flavescens in Japan 2016–2017 (Global Administrative Areas 2018).
Stable Isotope Analyses
Following rinsing in 2:1 chloroform:methanol and overnight drying in a fume hood, samples of 0.35 ± 0.02 mg of wing membrane were weighed into pressed silver 3.5 × 5 mm capsules and analyzed using a Eurovector Uniprep autosampler (Milan, Italy) carousel attached to a Eurovector 3000 Elemental Analyzer, coupled with a Thermo Delta V Plus isotope ratio mass spectrometer (Bremen, Germany) in continuous flow mode with the helium carrier gas. After the samples were loaded, the Uniprep autosampler (heated to 60°C) was vacuum evacuated and subsequently flushed with dry helium twice to remove adsorbed atmospheric moisture from the crushed silver capsules. The autosampler was then held under positive helium pressure for the duration of the analytical run. Two USGS keratin standards, EC-01 (formerly CBS: Caribou Hoof Standard) and EC-02 (KHS: Kudu Horn Standard of Environment Canada), were included every 10 samples. An internal laboratory standard, powdered keratin (MP Biomedicals Inc., Cat No. 90211, Lot No. 9966H) was included to monitor instrument drift and provide a check on accuracy over the course of each analytical session. Samples were combusted at 1,350°C using glassy carbon. Values of δ 2H of nonexchangeable hydrogen were derived using the comparative equilibration approach of Wassenaar and Hobson (2003) and calibrated to VSMOW using EC-01 (±1.9‰ 1 SD, n = 18, accepted δ 2H = −197.0‰) and EC-02 (±1.6‰, n = 17, accepted δ 2H = −54.1‰). We used these former calibration standard values because our original assignment algorithms were based on these (Hobson et al. 1999). This approach results in identical assignments if new calibration standards are used with correspondingly modified assignment algorithms (see below; Soto et al. 2017). In addition, because our original calibrations linking precipitation δ 2H with dragonfly wing δ 2H were based on combustion in a high-temperature glassy carbon reactor, we elected to continue with this method versus combustion at lower temperatures using a chromium-based reactor (Gehr et al. 2015, see also Soto et al. 2017). Overall measurement error for EC-01, EC-02, and our internal commercial powdered keratin δ 2H was ~2‰.
Assignment to Origin
We depicted the origins of wild dragonflies caught in Japan using a likelihood-based assignment method (Hobson et al. 2009, Van Wilgenburg et al. 2012, Wunder 2010), using the wing chitin δ 2H isoscape (δ 2Hw) and an amount-weighted precipitation-to-wing calibration algorithm derived by Hobson et al. (2012a). This was used to convert amount-weighted mean annual precipitation δ 2H (δ 2Hp) isoscapes (Bowen et al. 2005, Bowen 2019) into a δ 2Hw isoscape (Fig. 2). We used the 14.7‰ residual SD error from this regression in our assignments (Hobson et al. 2012b). We then created a spatial layer representing the known geographic range for P. flavescens in south and east Asia including India and used this as a mask (i.e., clip) to limit our assignment to origin analyses.
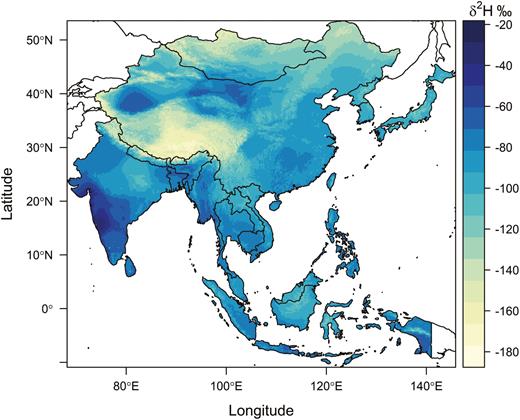
Expected wing δ 2H isoscape for Pantala flavescens in southeast Asia.
We estimated the likelihood that a cell (pixel) within the δ 2Hw isoscape represented a potential origin for a sample by using a normal probability density function to estimate the likelihood function based on the observed δ 2Hw and thus depicted the likely origins of each dragonfly by assigning individuals to the δ 2Hw isoscape one at a time. We arbitrarily chose a 2:1 odds ratio to include only those pixels (coded 1) with at least a 67% probability of origin versus all others (coded 0). This resulted in a map of binary values for each assigned individual representing presence (1) or absence (0) for each cell in the isoscape. We then summed the results of individual assignments by stacking the surfaces. We made geographic assignments to origin using functions within the R statistical computing environment (R Development Core Team 2019) using scripts employing the ‘raster’ v. 3.0–12 (Hijmans 2020), ‘maptools’ v. 1.0-1 (Bivand and Lewin-Koh 2020), and ‘rnaturalearth’ v 0.1.0 (South 2017) packages. Thus, the final assignment surface depicted the number of individuals coassigned at each pixel based on the odds criteria.
We derived an expected value for Japanese-origin P. flavescens by averaging the mean annual (amount-weighted) precipitation δ 2Hp for all of our Japanese sites (−57‰) based on the waterisotopes.org calculator. That resulted in a predicted mean δ 2Hw value for P. flavescens of −94.4‰ based on the algorithm derived by Hobson et al. (2012b). We then allowed an SD of 14.7‰ to give a corresponding range of −109.1 to −79.7‰ to be consistent with possible origins from Japan.
Trajectory Analysis
We explored possible origins and immigration routes of our three larger samples (n > 30) with the HYSPLIT (HYbrid Single Particle Lagrangian Integrated Trajectory) model developed by the U.S. National Oceanic and Atmospheric Administration (NOAA) Air Resources Laboratory (Stein et al. 2015), using the GDSA1 dataset to generate backwards trajectories from our sample locations (www.ready.noaa.gov/hypub-bin/trajasrc.pl). We used arbitrary 5 d (120 h) backward trajectories, with starting altitudes of 500, 1,000, and 1,500 m, and then in some cases investigated further with additional starting altitudes at 250-m intervals. Arrival dates during the first half of each collecting period in Japan were investigated. There was no attempt to systematically generate large numbers of trajectories in order, e.g., to estimate probabilities of origin from different sectors. Rather, the aim was simply to demonstrate that at least some trajectories linked potential areas of origin (as demonstrated by our δ 2Hw analyses) with our sampling sites. Representative trajectory plots are illustrated in Supp Material (online only; in two cases, trimmed to 4 d [96 h] for clarity of presentation).
Results
For 2016 collections (11 August–15 September), there was a significant difference in δ 2Hw among the four collection sites (Fig. 3; F3, 53 = 5.82, P = 0.02; Table 1). No clear changes in δ 2Hw were observed across sites throughout the sampling period, although almost all individuals were more depleted in 2H than expected for Japan. We depicted origins of P. flavescens from each of these sites and collection periods (Fig. 4) and found the highest probability of possible origins in August and September were from outside Japan and centered in northern China or Mongolia and northern India. Few of our 2016 samples appeared likely to have originated in Japan itself, with just a small number of individuals collected in Shiga Prefecture on 7 September having δ 2Hw levels compatible with being locally bred (Fig. 3).
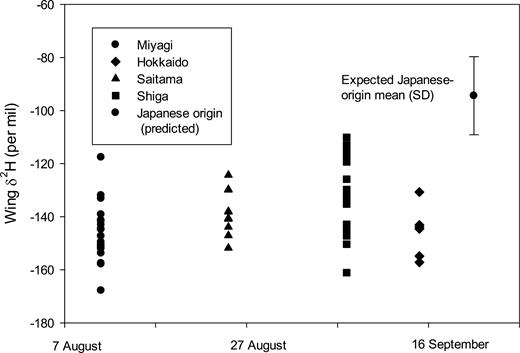
Distribution through time of wing δ 2H values measured for Pantala flavescens collected at four sites in Japan in 2016: Miyagi—11 August, Saitama—25 August, Shiga—7 September, Hokkaido—15 September. Also indicated is the mean and SD of the expected value for this species if produced in Japan.
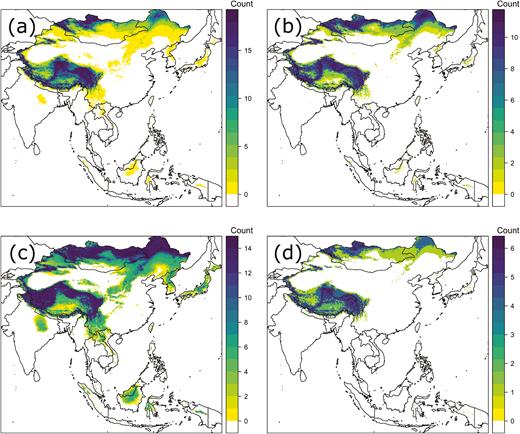
Probable origins of Pantala flavescens collected in 2016 at (a) Miyagi prefecture—11 August, (b) Saitama—25 August, (c) Shiga—7 September, and (d) Hokkaido—15 September. The legend indicates the number of individuals assigned to a given pixel consistent with the 2:1 odds criterion chosen (see Materials and Methods).
For 2017 collections (9 April–13 November), there was a significant difference in δ 2Hw among the five collection groups (Fig. 5; F4, 127 = 20.52, P = 0.000) with three groups identified (Kagoshima in April, Kagoshima in May vs all other samplings; Table 1). The most enriched group was sampled at Kagoshima in April, but all samples except that collected in Kagoshima in May–June had a proportion of individuals that could have potentially been produced in Japan (Table 1; Fig. 5). We depicted origins of P. flavescens from each site and collection period in 2017 in Fig. 6. Our April sample from Kagoshima indicated possible origins in Japan as well as sites as far as northern China and also to the southwest in the region of northern Myanmar to southern China, or Borneo-Sulawesi. Those more southwestern origins were more plausible due to the dry season throughout much of the far northwestern portion of the range under consideration and our examination of wind trajectories in April (Supp Fig. S1 [online only]). Later season captures in 2017 indicated possible origins throughout the range potentially including Japan.
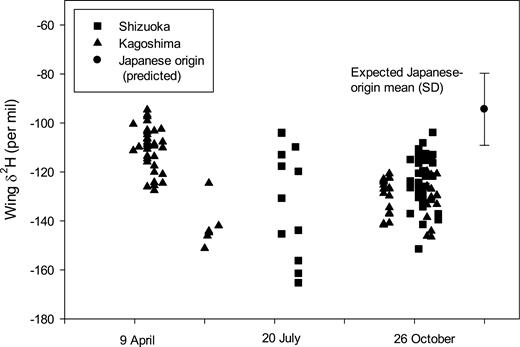
Distribution through time of wing δ 2H values measured for Pantala flavescens collected at two sites in Japan in 2017: Kagoshima 9–30 April, Kagoshima 30 May–9 June, Shizuoka 24 July–5 August, Kagoshima 5 October–12 November, and Shizuoka 24 October–13 November. Also indicated is the mean and SD of the expected value for this species if produced in Japan.
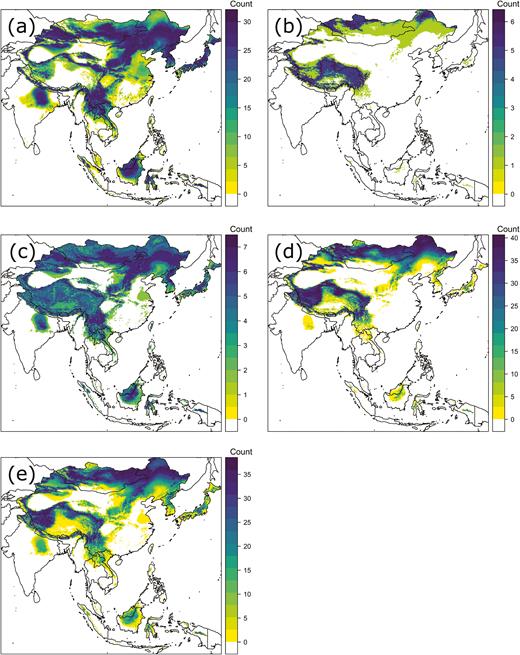
Probable origins of Pantala flavescens collected in 2017 at (a) Kagoshima prefecture 9–30 April, (b) Kagoshima 30 May–9 June, (c) Shizuoka 24 July–5 August, (d) Kagoshima 5 October–12 November, and (e) Shizuoka 24 October–13 November. The legend indicates the number of individuals assigned to a given pixel consistent with the 2:1 odds criterion chosen (see Materials and Methods).
Based on our derivation of expected values for Japanese-produced individuals, it was possible to examine characteristics of individuals potentially derived from Japan and those that were clearly immigrants. Potential Japanese-origin dragonflies were of lower mass than immigrants (Table 2, Wilcoxon rank-sum test, P < 0.001), but we found no difference in the proportion of males and females or adults and immatures among clear immigrant and possible Japanese-produced individuals (Fisher exact test, P > 0.05).
Body mass (g) showing significant statistical (Wilcoxon rank-sum test) differences between expected Japanese origin and immigrant for Pantala flavescens captured in 2017
| Site | Date | Japanese origin | Immigrant | P-value |
|---|---|---|---|---|
| Kagoshima | 9–30 Apr. | 0.1597 ± 0.042 (n = 23) | 0.1977 ± 0.043 (n = 11) | 0.013 |
| Shizuoka | 24 July–5 Aug. | 0.1414 ± 0.027 (n = 4) | 0.2441 ± 0.034 (n = 8) | 0.004 |
| Shizuoka | 24 Oct.–13 Nov | 0.1486 ± 0.026 (n = 6) | 0.1916 ± 0.04 (n = 34) | 0.012 |
| All specimens | 0.1555 ± 0.038 (n = 33) | 0.1908 ± 0.045 (n = 99) | <0.001 |
Discussion
Globe skimmer dragonflies are known to occur in Japan during the summer, and it has been assumed that those seen early in the season, in April and May, are arrivals from further south, whereas dragonflies seen later in the season are locally produced (Sugiura et al. 1999; Arai 2007, 2012; Iwata et al. 2009). Our study confirms once again the general phenomenon of long-distance migration in P. flavescens and provides evidence that individuals arriving in Japan during the spring are indeed immigrating from south of Japan. However, our investigation does not support the idea that most of the individuals seen in Japan during the rest of the summer are locally produced, instead suggesting that the majority are also immigrants.
Our spring specimens, from Kagoshima in April 2017, showed the highest δ 2Hw of any of our samples. Although this was theoretically consistent with many of these dragonflies having originated in the main islands of Japan (Figs. 5 and 6a), this cannot have been the case, since (as noted above) it is too cold for P. flavescens to overwinter in Japan, except the far southern islands (where numbers seem too small to account for the repopulation of the rest of Japan). Other potential areas of origin (the Korean peninsula, north and central China, Mongolia, northern India, and the Himalaya) are likewise excluded because they are too cold and, in some cases, also too dry for P. flavescens reproduction in the preceding weeks and months. That leaves two potential sources for our April sample, both well south of Japan: south China and the northern part of Southeast Asia (north Myanmar, Laos, and Vietnam) or the great islands of Borneo and Sulawesi. Wind trajectory analysis (Supp Fig. 1 [online only]; see also Tanoue et al. 2013) and studies of other insects (Mills et al. 1996) suggest that the former is the most likely, although the second option cannot be entirely excluded. This finding is also consistent with observations from northern China (on Beihung Island in 38°N, at the same latitude as Miyagi Prefecture), which found a net northward migration of P. flavescens in early summer (Feng et al. 2006, Cao et al. 2018).
During early summer, in June and July, our samples showed δ 2Hw values consistent with most individuals having originated either from north China and Mongolia or from south China and as far west as the Tibetan plateau (Fig. 6b and c). This is the time of the onset of the East Asian summer monsoon and the annual Baiu rains (Wang and Lin 2002, Yihui and Chan 2005, Sampe and Xie 2010, Guan et al. 2020). The rains are associated with strong SW winds above about 1,000 m (e.g., Sampe and Xie 2010: Fig. 15; Guan et al. 2020: Fig. 1), which are known to carry insects from southern China (Seino et al. 1987, Watanabe and Seino 1991). These same winds provide a means for P. flavescens to reach Japan from central south China and as far west as the Tibetan plateau. Indeed, the frequent arrival of P. flavescens in June has previously been linked with westerly winds associated with the Baiu rains (Asahina and Turuoka 1967).
Our samples from late summer, during August and September (Figs. 3 and 4), again show little evidence that they included local, Japanese-origin dragonflies, instead showing strong evidence of immigration from the west. This is not surprising as the prevailing westerly winds of early summer continue into later summer. However, a particular feature of August and September is that this is the peak of the typhoon season. From an ocean weather ship located in the Pacific Ocean (at 29°N, 135°E), P. flavescens were observed regularly during summer south-westerly winds (Hashimoto and Asahina 1969), although particularly large numbers occurred during late summer when a typhoon passed (Asahina and Turuoka 1968). On mainland Japan, the association of globe skimmer dragonflies with typhoons has long been recognized (Wakana 1959), whereas more recently, the occurrence of other insect species with typhoons has also been reported (e.g., Murata et al. 1998, Kohno et al. 2004). During the course of our study, a total of six typhoons struck Japan during August and September 2016, the second highest number of typhoons to have hit Japan in a single year from 1951 to 2019 (Japan Meteorological Agency 2020). Our isotopic results are consistent with the P. flavescens specimens collected in Miyagi, Shiga, Saitama, and Hokkaido prefectures in August–September 2016, all having been carried by typhoons from regions to the west of Japan.
Data from our October and November samples (Figs. 5 and 6d and e) suggest that several individuals may have been of Japanese origin, which does lend some support to the findings of previous studies. For example, Tanaka and Higashi (2003) reported that P. flavescens individuals encountered in October in Kumamoto Prefecture (adjacent to Kagoshima) represented the locally produced third generation of the year. Nevertheless, our data also suggest that many individuals collected in October and November originated outside of Japan (Figs. 5 and 6d and e). At Beihung Island (in northern China at 38°N), net migration of P. flavescens at the end of the summer is to the southwest, toward south central China, not to the east toward Japan (Feng et al. 2006, Cao et al. 2018). This perhaps suggests that any immigrants to Japan at this time may have arrived from further east or north of Beihung, possibly from the Korean peninsula, northern China, the Russian Far East, or Mongolia, a suggestion supported by our trajectory analysis (Supp Figs. S2 and S3 [online only]).
Body mass of immigrant dragonflies was significantly higher than that of individuals of possible Japanese natal origins. These results are consistent with the findings of Anholt et al. (1991) who reported that body mass in migratory Anisoptera is significantly higher than in non-migratory forms. The same applies to the migratory green darner dragonfly Anax junius Drury (Odonata: Aeshnidae) of North America, in which fall migrants have a higher fat content than local breeders (May and Mathews 2008, May 2013). Our findings are also consistent with those of Ishizawa (2007) who found that P. flavescens specimens from Saitama Prefecture were heavier in July and August (when samples may have included mostly mature immigrants) than in September and October (when samples may have been dominated by immature, locally bred individuals). In addition, individuals collected during our study from Kagoshima Prefecture in April 2017 which had lower δ 2Hw values (suggesting that they had traveled furthest to Japan) tended to be heavier than those with higher δ 2Hw values, and the latter individuals were also more like to be immature (Supp Fig. S4a [online only]). This might suggest that immature individuals, which were still gaining mass, were locally produced. However, even the closest source of immigrants in April would be the Okinawa islands, some hundreds of kilometer to the south, which suggests that none of the P. flavescens in this sample could be considered to be genuinely locally produced. Furthermore, our October–November 2017 sample from Shizuoka Prefecture does not show such a relationship (Fig. 4b). We also note that Ishizawa (2007) reported that females were consistently heavier than males, in contrast to our findings. In short, this consideration of body mass and maturity may be a promising approach for future studies involving more and larger samples, but it has not provided unequivocal insights in this case.
The use of δ 2H analyses of insect wings in combination with known precipitation δ 2H isoscapes to infer natal origins of migratory species is becoming an established approach to investigating the ecology of migratory insects in general (reviewed by Hobson et al. 2018, Hallworth et al. 2018) and that of P. flavescens in particular (Hobson et al. 2012a, Cao et al. 2018). Using a single isotope to infer origins at continental scales, however, necessarily can be ambiguous and is entirely dependent on the pattern of the underlying precipitation δ 2H isoscapes. Nonetheless, the strong isotopic signal associated with the Himalayas, the Tibetan Plateau and northern China is particularly useful, and the phenology of emergence of cohorts from those regions deserves closer inspection as they may drive the demography of the species across the wider region, including Japan (cf., Anderson 2009, Hobson et al. 2012a). Other isotopes to consider in future include those of strontium, carbon, and nitrogen, but this would involve the derivation of predictive isoscapes for these elements or the establishment of thresholds related to land-use practices (Wassenaar 2019). For example, dragonflies would be expected to be enriched in 15N if they were exposed to substantial agricultural influences, while strontium isotopes are related to, often complex, geological history.
To date, studies assigning individual P. flavescens to origins using δ 2Hw analyses have used calibration algorithms linking δ 2Hw with the expected amount-weighted mean annual precipitation δ 2H (Hobson et al. 2012a, Cao et al. 2018), and there is generally good agreement (i.e., r2 > 0.7). However, P. flavescens has a relatively short larval period (of only about 6 wk) compared with the species that were used in the calibration exercise of Hobson et al. (2012b). A more appropriate species-specific calibration algorithm for P. flavescens should be developed. Further refinements to wing δ 2H isoscapes for P. flavescens could use GIS layers to link more realistic origins seasonally with various population cohorts, winds, and other environmental factors. For example, a spatially explicit isotopic surface related to the extent of rice agriculture in east and southeast Asia might better inform origins of dragonfly populations there (Cao et al. 2018) and ultimately contribute to our understanding of life history and population dynamics of P. flavescens.
Acknowledgments
Blanca X. Mora Alvarez assisted with sample preparations for stable isotope analyses that were conducted at the LSIS-AFAR stable isotope laboratory of the University of Western Ontario. We also acknowledge Noriaki Nunokawa, Naoya Ishizawa, Akiko Minagawa, Motoharu Fukui, Mikito Okazaki, Hisao Imamura, Kunihiko Matsuhira, Taku Tsukada, Kouji Nakamine, Hidetoshi Sugita, Kazunari Futamachi, and Kazuya Yoshida of their assistance in collecting samples of Pantala flavescens.
References Cited
