


Abstract
The effect of temperature on the rate of spotted lanternfly, Lycorma delicatula (White) (Hemiptera: Fulgoridae), egg development was investigated for a population in Pennsylvania. Mean developmental duration (days ± SE) for egg hatch was evaluated at five constant temperatures of 19.9, 24.2, 25.1, 26.7, and 30°C using egg masses laid during the fall of 2018 and collected in 2019 from Berks Co., Pennsylvania. Base temperature thresholds for egg development were estimated using intercept and slope parameters by fitting a linear relationship between average temperature and developmental rate for the Pennsylvania study, two Korean studies, and the combined data sets. The base threshold estimates were then used to calculate seasonal accumulated degree-days (ADD) and construct logistic equations for predicting cumulative proportion of hatch in the spring. The fitted logistic prediction equations were then graphed against the egg hatch observations from field sites in Pennsylvania (2017) and Virginia (2019). When base temperature estimates from the three studies and combined studies were used to calculate ADD, the logistic models predicted similar timing for seasonal egg hatch. Because the slopes and intercepts for these four data sets were not statistically different, a base temperature threshold of 10.4°C derived from the combined model is a good estimate for computing ADD to predict spotted lanternfly spring emergence across a spatio-temporal scale. The combined model was linked with open source weather database and mapping programs to provide spatiotemporal prediction maps to aid pest surveillance and management efforts for spotted lanternfly.
The spotted lanternfly, Lycorma delicatula (White) (Hemiptera: Fulgoridae), is a generalist herbivore that has proven to be a prominent pest in forest ecosystems, urban landscapes, and agriculture. Documented to feed on more than 65–70 host plants spanning multiple plant families (Barringer et al. 2015, Dara et al. 2015, Lee et al. 2019, Urban 2020), spotted lanternfly is considered a severe yet sporadic invasive pest (Park 2015) that causes significant economic loss to viticulture, tree fruit production, and the ornamental industry (Lee et al. 2019, Urban 2020). This phloem feeding insect not only causes direct damage to plants but indirect damage through honeydew excrement which harbors sooty mold growth (Song 2010, Park 2015). Sooty mold disease impedes photosynthesis and grows on fruit covered in honeydew, increasing economic cost and decreases fruit marketability (Song 2010). Despite research into the influence of spotted lanternfly feeding on host plant health, impacts of L. delicatula damage on plants are not well understood and the species’ capacity to vector plant borne diseases is unknown, elevating our need for studies on this high-risk invasive pest.
Native to China, India, Taiwan, and Vietnam (Dara et al. 2015, Lee et al. 2019), L. delicatula has expanded its territory to include South Korea and Japan (Jung et al. 2017, Lee et al. 2019) and most recently, the northeastern United States (Barringer et al. 2015, Dara et al. 2015). Since its initial detection in Berks County, Pennsylvania in September of 2014 (Barringer et al. 2015), L. delicatula has spread to neighboring states of Maryland, New Jersey, Delaware, New York, and a region of northern Virginia and West Virginia (Lee et al. 2019, Urban 2020). Outbreaks and rapid range expansion of L. delicatula may be attributed to an increase in winter temperatures within the past 30 yr (Lee et al. 2011). This expansion is also very likely caused by the continued growth in international imports and exports of goods and commodities. The ability of this invasive to successfully establish in new habitats is likely correlated to cold tolerance of overwintering eggs and its polyphagous feeding behavior (Han et al. 2008, Park 2015).
In addition to cold tolerance, climatic factors such as photoperiod, humidity, host quality, and temperature can affect developmental rates (Calvin et al. 1984). Temperature is often considered the most significant factor influencing insect developmental rates and is commonly used to model insect phenology, population dynamics, and species distribution (Wagner et al. 1984; Damos and Savopoulou-Soultani 2012; Shi et al. 2016, 2017).
Developmental rates for a given species are life history characteristics that have evolved to assure the species’ survival within a specific ecological and climatic niche. Because insects are poikilothermic, their rate of development is dependent on the amount of heat available in their environment to drive metabolic processes that affect growth and development. Temperatures that fall below a minimum (base) temperature threshold or exceed the maximum temperature threshold may slow or arrest development (Campbell et al. 1974). To achieve a specific physiological event, the insect must experience a certain amount of heat units (degree-days) known as the thermal constant (K) (Arnold 1959, Campbell et al. 1974). The degree-day (DD) concept is commonly applied to pestiferous insect systems. When the developmental rates of an insect are known for specific average temperatures, a mathematical relationship between temperature and developmental rate (1/d) can be fitted using linear or nonlinear models. This mathematical relationship can then be used to calculate the base threshold for development. When the relationship is nonlinear, an upper developmental threshold may also be estimated.
Past studies have estimated the thermal development requirements for L. delicatula egg development in Korean populations. Choi et al. (2012) incubated egg masses at constant temperatures of 15, 20, and 25°C and estimated a base temperature of 8.14°C with a thermal constant of 355.4 total DD for mean hatch. Park (2015) studied the influence of constant temperature over a wider range of temperature treatments and used linear and nonlinear models resulting in a higher developmental threshold estimate of 11.13°C for post-diapause egg hatch and thermal constant of 293.3 total DD for mean hatch. Despite the work by Choi et al. (2012) and Park (2015) in Korea, it is unclear if the relationship between temperature and developmental rate for a Pennsylvania population of L. delicatula is similar. Campbell et al. (1974) and Calvin et al. (1991) have shown that populations within the same species can have variable developmental rates and base thresholds of development when adapted to a specific geographic location, in response to local biotic and abiotic conditions.
In this study, we compare the established relationships between average temperature and developmental rates of eggs from the two Korean studies with those of eggs collected in Pennsylvania. In combination with data from Korean populations (Choi et al. 2012, Park 2015), we also present an average relationship between temperature and spotted lanternfly egg developmental rate using combined data from the three studies, along with the calculated DD that are required to reach 50% hatch. Base threshold estimates from individual and combined data sets (Pennsylvania and Korea) along with field measured temperature data (Pennsylvania) and site-specific generated temperature data (Virginia) were used to calculate accumulated degree-days (ADD) from a biofix date of January 1. The relationship between ADD and cumulative proportion of egg hatch (PC), generated from Pennsylvania and Virginia field observed egg hatch data, was used to generate a logistic model of spring egg hatch (first-instar nymph eclosion). In combination with open source spatio-temporal weather data and mapping programs, the spring egg hatch model provide a tool for forecasting the period of spring egg hatch and timing of pest management practices across a spatio-temporal scale.
Materials and Methods
Effect of Constant Temperature on L. delicatula Egg Development
On 23 January 2019, L. delicatula eggs were collected from a forested area (40.4046957, −75.7115460) adjacent to a Christmas tree farm in Leesport, Pennsylvania. The area had a high adult and egg mass population in the fall of 2018, which resulted in high egg mass densities in 2019. Clusters of these egg masses were collected in late winter and early spring of 2019 and then transported to a quarantine research facility at University Park, Pennsylvania. The egg masses were stored at 4°C in plastic bins containing moistened paper towels until the experimental treatments were established.
Four constant temperatures represented the intended treatments: 20, 25, 27, and 30°C. However, average temperatures, calculated based on data logger readings, indicated the true average temperatures were 19.9, 24.2, 25.1, 26.7, and 30°C. There were two runs of the intended 25°C temperature, with one run averaging 24.2°C and the second run averaging 25.1°C. Because of a growth chamber malfunction that lead to temperature fluctuation ranging from 13.0°C to over 35°C, the 30°C temperature was not included in any of the analyses. Thus, for the final data analysis, four average temperatures were used to represent the Pennsylvania treatments for comparison with the Choi and Park data sets.
For each temperature treatment, 30 individual egg masses with intact wax coatings were removed from 4°C storage and subsequently glued onto the lids of separate 100- × 25-mm petri dishes (VWR 89107-632) and placed inside incubation chambers (Percival; model I-41LL) set to 16:8 photoperiod and containing a tray of distilled water to maintain humidity. Although egg masses were not exposed to a specific acclimation period between the time they were removed from storage at 4°C and placed inside incubation chambers, egg masses were exposed to room temperature while they were glued to the individual petri dishes for a duration of approximately 1 h for each of the temperature treatment conditions. The total number of individual eggs per treatment varied between 1,089 and 1,251, with an average of 33.5–39.0 eggs per mass (Table 1). HOBO U23 Pro V2 data loggers were placed in the chambers to track actual temperature and humidity conditions every 15 min. After a treatment was established, egg dishes were inspected once daily for newly emerged first-instar nymphs to determine the days to hatch and mean duration (days) to hatch for the entire population. Once the last nymph emerged, a soft paint brush was used to remove the waxy coating on egg masses and the total egg count was recorded to determine the total number of eggs in the treatment, the total number of eggs that hatch, average number of eggs per mass, and egg survival rates. After coatings were removed, it was determined that several of the dishes contained more than one egg mass, therefore the hatch count and total eggs per dish were averaged when a dish contained more than one mass.
Starting dates of trials, growth chamber temperature setpoints (±SE) (Temp1), average measured temperature (±SE) (Temp2) and relative humidity (±SE), total number of hatched eggs, total number of eggs placed in the growth chamber, total number of egg masses, mean number of eggs per mass (±SE), and egg survival rates (% per dish) for each experimental group for the laboratory egg development studies using a Pennsylvania population of L. delicatula (2019)
| Start date | Temp1 (°C) | Temp2 (°C) ± SE | RH (%) ± SE | Hatched eggs | Total eggs | Total masses | Mean eggs per mass ± SE | Survival rate (%, per dish) |
|---|---|---|---|---|---|---|---|---|
| 28 Jan. 2019 | 20 | 19.9 ± 0.027 | 90.9 ± 0.14 a | 1,091 | 1,251 | 32 | 39.0 ± 1.57 | 88.3 a |
| 28 Jan. 2019 | 25 | 24.2 ± 0.068 | 68.3 ± 0.83 c | 620 | 1,235 | 35 | 36.1 ± 1.35 | 49.0 b |
| 23 May 2019 | 25 | 25.1 ± 0.017 | 90.7 ± 0.13 a | 612 | 1,110 | 34 | 33.5 ± 1.57 | 56.7 b |
| 23 May 2019 | 27 | 26.7 ± 0.067 | 78.1 ± 0.97 b | 327 | 1,089 | 31 | 35.1 ± 2.13 | 28.8 c |
Within columns, means followed by the same letter are significantly different (one-way ANOVA, Tukey’s HSD, P < 0.05).
Parameter estimates for the relationship between egg developmental rate and temperature were estimated using standard least squares regression (JMP Pro 14.2.0), where y is developmental rate (1/d) and T is temperature at which the developmental rate was measured (Campbell et al. 1974, Nielsen et al. 2008, Park 2015):
The base temperature threshold for development (T0) is the temperature at which the developmental rate is equal to zero and is calculated as −α/β. The reciprocal of the slope (1/β) from this linear relationship is the thermal constant, K (Arnold 1959, Park 2015), also known as the total DD requirement. Egg survival rates (expressed as % survival) were calculated by dividing the total number of hatched individuals by the total number of eggs in the temperature treatment and then multiplying by 100 (Choi et al. 2012, Park 2015).
Another method to calculate total DD to 50% hatch is to multiply the number of days for 50% of the population to hatch at a given temperature and then multiply by the DD per day accumulated at the same temperature. Because the slope of the relationship between temperature and rate of development in a linear relationship is a constant, the DD calculation will be the same at all temperatures. Since the calculation of daily DD is simply a measure of distance from the average daily temperature to the T0 value, the daily DD accumulation and total DD to 50% egg hatch are usually less for higher T0 values.
To determine whether the effect of temperature on egg developmental rate significantly differed between the Choi, Park, and Pennsylvania studies, an indicator-variable regression was performed to compare the slopes and intercepts across the three study sources (JMP Pro 14.2.0).
Pennsylvania Field Study
In December 2016, temperature and relative humidity data loggers (HOBO U23 Pro V2) were placed at a forested site in Oley, Pennsylvania, near a high density of spotted lanternfly egg masses within 50 ft of mature Ailanthus altissima trees (40.4046957, −75.7115460). Temperature loggers were set to take readings every hour. Beginning in early April and continuing until mid-June of 2017, 112 marked egg masses were observed every 1–2 d throughout May and every 3–6 d in June for the emergence of first-instar nymphs. The number of new hatchlings (first-instar nymphs) on an egg mass and/or open egg cell was recorded for each sampling interval (n = 35 observation dates).
The number of new eggs hatched during a sampling interval was calculated by summing over the 112 egg masses. The total number of individuals that hatched out over the hatch period was determined by summing over all sampling intervals. The proportion of new eggs hatched during a sampling interval was then calculated by dividing the number of newly hatched eggs by the total number of eggs that hatched over the hatch period. The cumulative proportion of eggs hatched was calculated by adding the proportion hatched in the sampling interval to the sum of the proportion hatched in previous sampling intervals. The total proportion hatch ranged from zero on the date before first hatch to 1.0 on the date the last individual eggs hatched.
Virginia Field Study
In 2019, an independent research group from the Virginia Polytechnic Institute and State University provided data on spotted lanternfly phenology from an area near Winchester, Virginia (39.20400, −78.15702), where an L. delicatula population had been discovered at an ornamental stone yard the previous year. Twenty plots (2 × 2 meters) with at least three known host plant species and five egg masses were used to document L. delicatula phenology throughout the growing season (late April–early November 2019). Visual insect survey counts were conducted within a 5-min period for each plot on a weekly basis to record L. delicatula life stage and the number of L. delicatula present per host species (n = 26 observation dates). Data collected included counts of L. delicatula life stage on each plant species. For the purposes of this study, first-instar nymph counts were summed across the plots for each observation date (n = 8 observations) to determine the number of new individuals that hatched during a sampling interval. The proportion of eggs hatched was calculated using the same approach as described in the Pennsylvania Field Study section.
Given that egg hatch and occurrence of first-instar nymphs was measured at weekly intervals, the exact timing of an individual nymph hatching was not known and could have occurred any time during the weekly interval. This is in contrast to the 1- to 2-d sampling intervals used at the Pennsylvania location. Thus, the timing of egg hatch in Pennsylvania had smaller sampling uncertainty than in Virginia. Average temperature data for the specific geographic coordinates of plots in Virginia were obtained using the process described in the section on ‘Spatio-temporal Maps of Spotted Lanternfly Spring Egg Hatch’ that uses open source tools to estimate temperature and DD profiles for the specific sites.
Hatch Prediction Equations
The degree-day (DD) concept may be used to predict the cumulative proportion of the population that has hatched (PC) by a summation of DD accumulated from a given biofix date (Sked and Calvin 2005):
where the numerator (upper limit) is equal to 1.0, which bounds the equation to 100% of the population completing transition into the first nymph instar (egg hatch), expressed as a proportion. The exponent in the equation is a linear function with intercept (α) and slope (β) parameters and independent variable of ADD. ADD are calculated using the minimum (base) temperature threshold for development.
By taking the natural logarithm of the above equation, parameters α and β may be found using linear regression (Sked and Calvin 2005):
The transformed observational data for the Pennsylvania and Virginia studies (n = 35 and n = 8, respectively) were fitted to an ADD profile from January 1 using each estimated base temperature threshold for development derived from the constant temperature experiments (Pennsylvania, Korea, and combined data set) to obtain estimates of α and β using standard least squares regression (JMP Pro 14.2.0).
ADD (biofix date of January 1) profiles were computed using a common averaging method (Microsoft Excel version 16.16.21). Maximum and minimum temperatures were determined for each 24-h period to calculate the average daily temperature ([maximum daily temperature + minimum daily temperature]/2). The daily DD accumulation was then calculated by subtracting the base threshold (T0, estimated from the Pennsylvania laboratory study, published South Korean papers, or combined data set) from the average daily temperature. Beginning on January 1, daily DD contributions were summed to determine the ADD up to and over the egg hatch period. If the average daily temperature fell below the base threshold, the daily DD total was set to zero. Using the ADD profile from January 1 for each base threshold as the independent variable, mathematical models of proportional spring egg hatch for the Pennsylvania population were generated.
A prediction equation with 95% confidence limits was produced by replacing the parameter estimates in the logistic expression (JMP Pro 14.2.0) with the upper and lower confidence limits for slope and intercept values. The ADD to achieve 5, 50, and 95% egg hatch and approximate date of occurrence are reported for L. delicatula egg development using each of the estimated base temperatures.
Comparison of Pennsylvania and Virginia Egg Hatch Predictions
To determine whether the logistic equations for L. delicatula egg hatch at the two geographically separate locations were similar, we followed the approach used by Nowatzki et al. (2002). Using this approach, the predicted proportion of egg hatch completed for the Pennsylvania model was graphed against the predicted proportion of egg hatch completed for the Virginia model using each DD scale (T0 = 8.1, 10.4, 11.1, and 13.2°C). The correspondence between the two models was then evaluated by fitting the points with a linear regression.
The α and β parameters were estimated using standard least squares regression (JMP Pro 14.2.0). Following Nowatzki et al. (2002), a 100% correspondence between the two predictive models results in a regression equation with an intercept of zero and slope of 1.0. A regression with a slope that is close to 1.0 and an intercept that is significantly negative or positive indicates that the two curves are similar, but one population begins to hatch earlier or later than the other. If the intercept is zero but the slope is significantly greater or less than 1.0 or the relationship is not linear, then the hatch period is starting at the same time, but one population is progressing through the hatch period at a faster or slower rate.
Spatio-Temporal Maps of Spotted Lanternfly Spring Egg Hatch
The daily degree-day based maps of spotted lanternfly hatch percentage begin with hourly weather data downloaded from the National Oceanic and Atmospheric Administration (National Oceanic and Atmospheric Organization [NOAA] 2020). The UnRestricted Mesoscale Analysis (URMA) data set (Pondeca et al. 2015), a subset of the National Digital Forecast Database (NOAA NDFD 2020), provides surface analysis for many weather variables as a grid (2.5-km resolution) of the conterminous United States (CONUS). Each morning at 7 a.m., the previous day’s 24-hourly grids were downloaded and added to a spatially enabled database. These hourly records were then used to calculate daily minimum, maximum, and average temperature for each cell in the grid. Temperature values for an individual grid cell have an average error rate (standard deviation) of approximately, ±1.2°C, but this varies by nearest of weather stations, day of year, and location. These temperature records were then used to calculate ADD using each base temperature threshold value, and in turn used to calculate the spotted lanternfly hatch.
After the various calculations were done for the entire CONUS grid, a number of geospatial operations, such as reprojection and clipping, were done to generate maps appropriate for the North Carolina to New York domain. The daily maps—still just grids of numbers at this stage—were then uploaded to a geographic web server, which is configured to produce images (.jpg) of maps classified by color that can be consumed by web mapping products.
The technologies used to produce the DD and spatio-temporal spring egg hatch maps were all open source. These included Python (Python Software Foundation, 2020) for scripting of data download and processing; a PostgreSQL database (PostgreSQL 2020) with the PostGIS (PostGIS 2020) extension for spatial operations; the GDAL library (Open Source Geospatial Foundation 2020) for additional spatial operations; and Geoserver (Geoserver 2020) to generate and serve the maps to the web.
Results
Effect of Constant Temperature on L. delicatula Egg Development
Starting dates of trials, growth chamber temperature setpoints (±SE), average measured temperature (±SE) and relative humidity (±SE), total number of hatched eggs, total number of eggs placed in the growth chamber, total number of egg masses, mean number of eggs per mass, and egg survival rates (% per dish) for the Pennsylvania study are reported in Table 1. While the intended temperatures for the study were 20, 25, and 27°C (Table 1; Temp1), the mean temperatures (Table 1; Temp2) of 19.9, 24.2, 25.1, and 26.7°C calculated from the ‘HOBO’ data logger readings were used to establish the relationship between temperature and developmental rate of eggs and thermal constant, K (total DD) requirements. A one-way analysis of variance showed that the mean relative humidity varied between the four temperature treatments and were statistically different at a significance level of 0.05 (F (3,154) = 339.3, P < 0.0001). Pairwise comparisons using Tukey’s HSD indicated mean humidity levels differed significantly between all pairs (P < 0.0001) except the 19.9 and 25.1°C temperature groups (P = 0.9995) (Table 1). An analysis of variance (ANOVA) of egg survival rates (%) per dish also showed significant variation among temperature conditions (F (3,116) = 23.9, P < 0.0001). A post hoc Tukey’s HSD test showed that survival rates per dish for all temperature group pairings differed significantly (P ≤ 0.0280) with the exception of the 25.1°C (56.7% survival) and 24.2°C (49.0% survival) groups did not significantly differ from one another (P = 0.6995). In general, percent survival appeared to decline as temperature increased.
In the Pennsylvania laboratory study, the mean duration to hatch (days ± SE) decreased as temperature increased (Table 2). This trend was also seen in the Choi study, but the Park study saw more variable survival across temperatures. Published mean duration to hatch for L. delicatula populations in South Korea (Choi et al. 2012, Park 2015) is also reported in Table 2, showing a similar decline in mean duration to hatch as temperatures increased.
Mean developmental duration (days ± SE) to egg hatch and egg survival rates (%) for individual eggs by temperature for the Pennsylvania (PA) and two Korean populations (Choi et al. 2012, Park 2015)
| Data source | Temp (°C) | Days ± SE | Survival rate (%) |
|---|---|---|---|
| PA study | 19.9 | 36.6 ± 0.144 | 87.2 |
| 24.2 | 26.4 ± 0.157 | 50.2 | |
| 25.1 | 20.2 ± 0.080 | 55.1 | |
| 26.7 | 18.6 ± 0.113 | 30.0 | |
| Park | 15 | 72.6 ± 0.22 a | 70.6 |
| 18 | 45 ± 0.55 a | 50.7 | |
| 19 | 40.7 ± 0.15 a | 67.1 | |
| 21 | 31.3 ± 0.16 a | 53.3 | |
| 23 | 23.4 ± 0.16 a | 78.6 | |
| 24 | 21 ± 0.09 a | 55.5 | |
| 27 | 18.4 ± 0.07 a | 70.1 | |
| 31 | 15.3 ± 0.09 a | 25.9 | |
| Choi | 15 | 55.9 b | 61.9 |
| 20 | 26.8 b | 57.8 | |
| 25 | 21.6 b | 30.4 |
aSE was calculated based on SDs and number of hatched individuals reported in Park (2015).
bSD of Choi et al. (2012) not reported in publication, therefore SE was not calculated.
The linear relationship between constant temperature and L. delicatula egg developmental rate (1/d) for the Pennsylvania study, Choi et al. (2012), Park (2015), and combined data sets are presented in Table 3, where T0 is the theoretical base temperature for development and K equals the average total DD for 50% of the population to reach egg hatch. Slope and intercept parameters and goodness of fit measures were determined using standard least squares regression. The best fit linear regression line with 95% confidence regions (fit and prediction) using all three data sets is presented in Fig. 1.
Slope and intercept values (±SE) showing the linear relationship between constant temperature and L. delicatula egg developmental rate (1/d) using data sets from the Pennsylvania (PA), Choi et al. (2012), and Park (2015) studies and combined data sets, where T0 is the calculated theoretical base temperature for development and K is thermal constant (total DD) to mean hatch
| Data source | T 0 (°C) | K | Intercept (±SE) | Slope (±SE) | df | R 2 | F | P > F |
|---|---|---|---|---|---|---|---|---|
| Choi a | 8.1 | 352 | −0.0230 ± 0.0123 | 0.00284 ± 0.00060 | 2 | 0.957 | 22.2 | 0.1331 |
| Park a | 11.1 | 294 | −0.0379 ± 0.0040 | 0.00340 ± 0.00018 | 7 | 0.984 | 372.8 | <0.0001 |
| PA study | 13.2 | 255 | −0.0519 ± 0.0207 | 0.00392 ± 0.000859 | 3 | 0.912 | 20.8 | 0.0448 |
| Choi and Park | 10.2 | 311 | −0.0329 ± 0.0044 | 0.00322 ± 0.00020 | 10 | 0.966 | 257.0 | <0.0001 |
| Choi, Park, and PA study | 10.4 | 310 | −0.0337 ± 0.00458 | 0.00323 ± 0.000202 | 14 | 0.952 | 255.4 | <0.0001 |
The df, R2, F-value, and P > F are included for each linear regression fit to each data source.
a Estimates in table may differ slightly from those reported in the original publications due to computational methods.
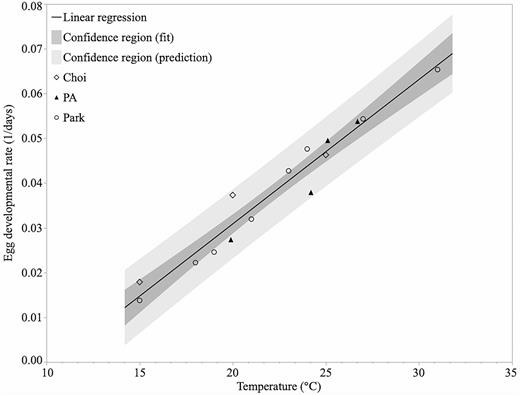
Best linear regression fit and 95% confidence region (fit and prediction) describing the relationship between temperature (°C) and L. delicatula egg developmental rate (1/d) for the combined Choi, Park, and Pennsylvania (PA) data sets.
The linear regression parameters for the Pennsylvania data resulted in a base temperature (T0) estimation of 13.2°C and K of 255 total DD to reach 50% hatch (Table 3; PA study). Our regression analysis of the Choi et al. (2012) data yielded slightly different slope and intercept parameters than those reported in the original publication, resulting in a base temperature (T0) of 8.1°C and 352 total DD to achieve 50% egg hatch. A similar difference in our regression parameters was observed for the Park data set, where our fitted data showed the T0 to be 11.1°C and a 294 total DD requirement for 50% hatch. While our estimates were slightly less, they were comparable to those originally published.
Despite the limited temperature treatments in the Choi and Pennsylvania studies, the primary question was whether the Choi, Park, and Pennsylvania studies significantly differed in the slope and intercept parameters of their developmental rate equations (Table 3). To address this question, combinations of the three data sets (Choi, Park, and Pennsylvania) were compared for significant differences in slope and intercept parameter values. The indicator-variable regression indicated that the slope and intercept parameters of the linear regression equations from the three independent studies were not statistically different (P = 0.3781 and P = 0.2782, respectively). Therefore, combining the three studies into one analysis provided more data points to estimate the relationship between temperature and developmental rate (1/d) and estimate the base threshold of development. It also suggests that the three populations were likely similar in their egg developmental requirements.
The combined linear regression for the two Korean studies results in a base temperature threshold estimate of 10.2°C with a thermal constant of about 311 total DD (Table 3; Choi and Park, df = 10, R2 = 0.966, P < 0.0001). When all three data sets are combined, the regression results in a base temperature estimation of 10.4°C (Table 3; df = 14, R2 = 0.952, P < 0.0001) where all points fit within the 95% confidence (prediction) region (Fig. 1). This combined regression provides an average estimate of the slope, intercept, and base threshold values for the relationship between temperature and egg developmental rate (1/d).
Spring Hatch Prediction Equations Using Estimated Base Thresholds for Accumulated Degree-Days
The observed proportion of L. delicatula egg hatch at Oley, Pennsylvania (2017) and first-instar nymph emergence data from Winchester, Virginia (2019) were fitted against seasonal ADD from January 1 using the various estimated base thresholds for development (Table 3) to a logistic equation model (Figs. 2 and 3). The resulting ADD predictions to reach a 0.5 cumulative proportion of hatch (i.e., 50% hatch) along with the logistic equation slope () and intercept () parameters used in the exponent of the equation and the overall fit of each model are reported for Pennsylvania (Table 4) and Virginia (Table 5).
Estimated intercept (α ± SE) and slope (β ± SE) parameters fitted to the natural log transform logistic equation () used in the exponent of a logistic relationship between cumulative proportion of egg hatch (PC) and accumulated degree-days (ADD) from January 1
| Data source | T0 (°C) | ADD | α ± SE | β ± SE | R 2 | F | P > F |
|---|---|---|---|---|---|---|---|
| Choi | 8.1 | 370 | 10.03 ± 0.40 | −0.027 ± 0.001 | 0.951 | 643.6 | <0.0001 |
| Choi, Park, and PA study | 10.4 | 242 | 9.13 ± 0.37 | −0.038 ± 0.002 | 0.951 | 633.8 | <0.0001 |
| Park | 11.1 | 207 | 8.82 ± 0.36 | −0.043 ± 0.002 | 0.949 | 617.6 | <0.0001 |
| PA study | 13.2 | 120 | 8.01 ± 0.36 | −0.067 ± 0.003 | 0.940 | 521.1 | <0.0001 |
The relationships were generated using the 2017 Oley, Pennsylvania field egg hatch observations (df = 34) and ADD was calculated using the four data source base threshold values (T0). The ADD estimates are for 50% egg hatch for the four fitted base temperature estimates from the Choi (2012), Park (2015), Pennsylvania (PA) and L. delicatula egg development studies and all three studies combined. The R2, F-value, and P > F are included for each linear regression fit to each data source.
Estimated intercept (α ± SE) and slope (β ± SE) parameters fitted to the natural log transform logistic equation used in the exponent of a logistic relationship between cumulative proportion of egg hatch (PC) and accumulated degree-days (ADD) from January 1
| Data source | T0 (°C) | ADD | α ± SE | β ± SE | R 2 | F | P > F |
|---|---|---|---|---|---|---|---|
| Choi | 8.1 | 359 | 10.92 ± 1.58 | −0.030 ± 0.004 | 0.946 | 69.7 | 0.0011 |
| Choi, Park, and PA study | 10.4 | 250 | 9.51 ± 1.53 | −0.038 ± 0.005 | 0.937 | 60.0 | 0.0015 |
| Park | 11.1 | 219 | 8.99 ± 1.51 | −0.041 ± 0.005 | 0.934 | 56.7 | 0.0017 |
| PA study | 13.2 | 135 | 7.17 ± 1.40 | −0.053 ± 0.008 | 0.923 | 47.7 | 0.0023 |
The relationships were generated using the 2019 Winchester, Virginia field egg hatch observations (df = 7) and ADD was calculated using the four data source base threshold values (T0). The ADD estimates are for 50% egg hatch for the four fitted base temperatures estimates from the Choi (2012), Park (2015), Pennsylvania (PA) L. delicatula egg development studies and all three studies combined. The R2, F-value, and P > F are included for each linear regression fit to each data source.
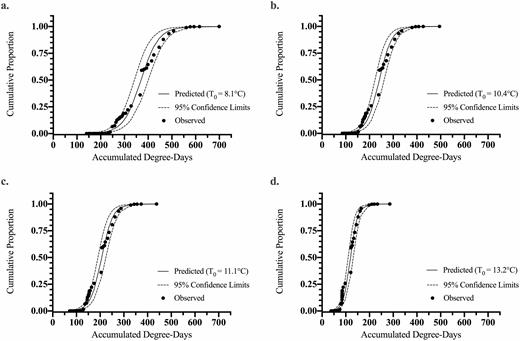
Logistic model fits including 95% confidence limits for predicting cumulative proportion of the L. delicatula population to egg hatch completion (PC) relative to accumulated degree-days (ADD) for the Oley, Pennsylvania field study in 2017 (observed data points: n = 35). Prediction curves were generated for base thresholds, T0, of (a) 8.1, (b) 10.4, (c) 11.1, and (d) 13.2°C determined from individual or combined data sets listed in Table 3.
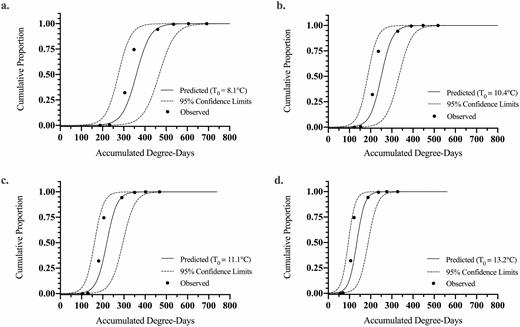
Logistic fits including 95% confidence limits for predicting cumulative proportion of the L. delicatula population to egg hatch completion (PC) relative to accumulated degree-days (ADD) for the Winchester, Virginia field study in 2019 (observed data points: n = 8). Prediction curves were generated for base thresholds, T0, of (a) 8.1, (b) 10.4, (c) 11.1, and (d) 13.2°C determined from individual or combined data sets listed in Table 3.
The intercept for ADD versus proportional egg hatch for the Pennsylvania data (Table 4) varied from 8.01 to 10.03 and the slope from −0.067 to −0.027 across study combinations. R2 values ranged from 0.940 to 0.951, all with P <0.0001. For the average model (T0 = 10.4°C), the intercept and slope values were 9.13 and −0.038, respectively (Table 4; df = 34, R2 = 0.951; F = 633.8, P < 0.0001).
The intercept for ADD versus proportional egg hatch for the Virginia data (Table 5) varied from 7.17 to 10.92 and the slope from −0.053 to −0.030 across study combinations. R2 values ranged from 0.923 to 0.946 and P > F ranged from 0.0011 to 0.0023. For the average model (T0 = 10.4°C), the intercept and slope values were 9.51 and −0.038, respectively (Table 5; df = 7, R2 = 0.937; F = 60.0, P < 0.0015).
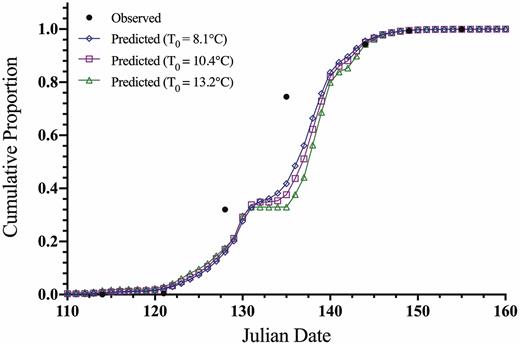
The fits of the observed field hatch data from Pennsylvania and Virginia for each theoretical base temperature ADD method are shown against the field-collected data on a Julian date scale in Figs. 4 and 5. A slight variation in fit between ADD methods can be seen, but in general, all base temperature threshold methods fit to the observed data well. The largest deviation from the predicted and actual egg hatch occurs at the mid-section of the curve for the Virginia site. The predicted ADD for 5, 50, and 95% hatch and corresponding calendar date for the 2017 Pennsylvania and 2019 Virginia studies were compared to the observed field hatch dates, as shown in Tables 6 and 7. For the Pennsylvania site, the prediction of 5 and 50% hatch was within 2 d and the 95% hatch was within 3 d across data sources for the model. The field observed timing in Pennsylvania compared to the model predictions for all model fits was within 1 d for 5%, within 3 d for 50% hatch, and within 3 d of 95% predicted hatch dates (Table 6). For the Virginia site, prediction for 5% hatch was within 2 d, 50% hatch was within 4 d, and 95% hatch was the same across data set sources used for the model. The field observed timing in Virginia compared to the model predictions for all model fits was within 2 d for 5%, off by 5–9 d for 50% hatch, and the same for 95% predicted hatch dates (Table 7). The combined study model predicted timing of hatch was within 1, 0, and 3 d of the field observed dates for 5, 50, and 95% hatch, respectively, using the Pennsylvania data. While the combined study model for the Virginia data was within 1, 7, and 0 d of the date for 5, 50, and 95% hatch, respectively.
Predicted ADD and calendar date to achieve 5, 50, and 95% L. delicatula hatch completion compared to the observed hatch at the Oley, Pennsylvania field site during the 2017 season
| Data source | T0 (°C) | ADD (date) for 5% hatch | ADD (date) for 50% hatch | ADD (date) for 95% hatch |
|---|---|---|---|---|
| Choi | 8.1 | 261 (May 1) | 370 (May 20) | 479 (June 4) |
| Choi, Park, and PA study | 10.4 | 164 (May 1) | 242 (May 20) | 320 (June 4) |
| Park | 11.1 | 138 (April 30) | 207 (May 20) | 276 (June 4) |
| PA study | 13.2 | 76 (April 29) | 120 (May 19) | 164 (June 7) |
| Observed field hatch | – | 30 April 2017 | 20 May 2017 | 7 June 2017 |
Predicted ADD and calendar date to achieve 5, 50, and 95% L. delicatula hatch completion compared to the observed hatch at Winchester, Virginia field site for 2019 season
| Data source | T0 (°C) | ADD (date) for 5% hatch | ADD (date) for 50% hatch | ADD (date) for 95% hatch |
|---|---|---|---|---|
| Choi | 8.1 | 263 (May 4) | 357 (May 16) | 456 (May 24) |
| Choi, Park, and PA study | 10.4 | 173(May 3) | 259 (May 18) | 328 (May 24) |
| Park | 11.1 | 147 (May 3) | 218 (May 17) | 291 (May 24) |
| PA study | 13.2 | 79 (May 2) | 157 (May 20) | 190 (May 24) |
| Observed field hatch | – | 2 May 2019 | 11 May 2019 | 24 May 2019 |
Observed field hatch (%) was interpolated from the observation dates before and after the desired percentage hatch would have occurred, given the spacing between first instar counts in this study (every 5–9 d).
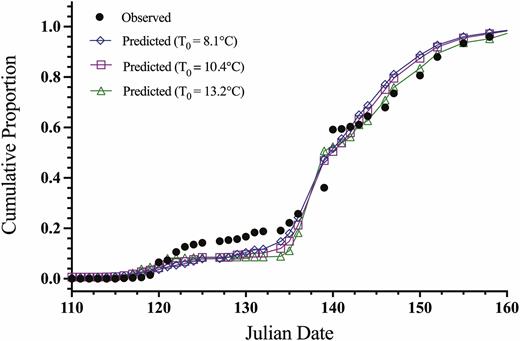
Predicted and observed cumulative proportion of the population to completing egg hatch relative to Julian date (days) for L. delicatula in Oley, Pennsylvania, 2017 (observed data points: n = 35).
Predicted and observed cumulative proportion of the population to completing egg hatch relative to Julian date (days) for L. delicatula in Winchester, Virginia, 2019 (observed data points: n = 8).
Comparison of Pennsylvania and Virginia Spring Egg Hatch Models
The degree of correspondence between the predicted spring egg hatch period for the Pennsylvania and Virginia models when T0 equals 8.1, 10.4, 11.1, and 13.2°C is illustrated in Fig. 6. For all four comparisons, the R2 values ranged between 0.968 and 0.997, with P < 0.0001 (Table 8), which indicates that there is a high degree of correspondence between the timing of egg hatch predicted by the Pennsylvania and Virginia models. There was a slight bow in the middle of the relationship when T0 = 11.1 or 13.2°C which suggests that the Pennsylvania model fit predicts a slightly faster rate of hatch during the middle of the hatch period.
Intercept (±SE) and slope (±SE) parameter estimates for linear regressions showing the correspondence between the Pennsylvania logistic model and the Virginia logistic model predictions
| T0 (°C) | Intercept ± SE (P > |t|) | Slope ± SE (P > |t|) | R 2 | F | P > F |
|---|---|---|---|---|---|
| 8.1 | 0.0054 ± 0.0035 (0.1275) | 1.041 ± 0.0079 (<0.0001) | 0.997 | 17575.5 | <0.0001 |
| 10.4 | −0.0136 ± 0.0044 (0.0028) | 0.977 ± 0.0091 (<0.0001) | 0.995 | 11535.7 | <0.0001 |
| 11.1 | −0.0181 ± 0.0067 (0.0093) | 0.956 ± 0.0137 (<0.0001) | 0.988 | 4851.1 | <0.0001 |
| 13.2 | −0.0188 ± 0.0108 (0.0872) | 0.906 ± 0.0213 (<0.0001) | 0.968 | 1804.1 | <0.0001 |
The predicted cumulative proportion for each model was determined by fitting the ADD profiles for the area near Winchester, Virginia in 2019 (df = 60). The R2, F-value, and P > F are included for each linear regression fit to each data source.
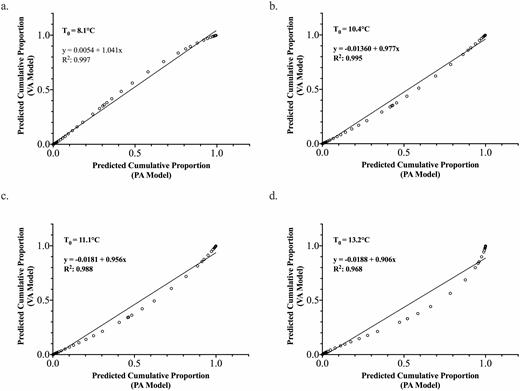
Simple linear regression showing the correspondence between the Pennsylvania (PA) logistic model and the Virginia (VA) logistic model predictions using theoretical base thresholds, T0, of (a) 8.1, (b) 10.4, (c) 11.1, and (d) 13.2°C. The predicted cumulative proportion for each model was determined by fitting the ADD profiles for the area near Winchester, Virginia in 2019 (n = 61).
The intercept values were significantly less but very close to zero using the base thresholds (T0) = 10.4, 11.1, and 13.2°C. For the 8.1°C base threshold model, the intercept was not different from zero (Fig. 6). The intercept values were still very close to zero, ranging from −0.0188 to 0.0054, suggesting a very slight delay in the spring egg hatch of the Virginia population compared to the Pennsylvania population. The slope parameter was significantly greater than 1.0 for the 8.1°C and less than 1.0 for the 10.4, 11.1, and 13.2°C base thresholds. Again, while significantly different from 1.0, they were very close to 1.0 (slope = 0.906–1.041). A slope less than 1 would indicate that the hatch is slightly faster using the Pennsylvania versus Virginia data. However, given the closeness of the intercept to zero and slope to 1.0, this is likely not biologically meaningful and could just be sampling interval error (greater time between samples in Virginia). Therefore, it appears that for practical pest management uses, the Pennsylvania and Virginia models for all T0 are predicting a similar timing for spotted lanternfly spring egg hatch.
While, the Virginia site only represents one field validation set, there is a significant difference in the climatic conditions between the Oley, Pennsylvania and Winchester, Virginia locations. Therefore, this increases confidence that the model’s predictions are likely useful over a range of climatic conditions currently occurring within the known range of the pest. Further, model verification data sets collected in the future as the pest expands its range will help improve confidence in the model’s use across broader geographic locations. Additionally, the practical use of the model does not require a highly precise prediction. Even being within a week of a key egg hatch event provides an early warning for pest managers to prepare for upcoming pest management activities, such as trap deployment and control tactic implementation.
Discussion
Effect of Constant Temperature on Egg Developmental Rate and Survival
As expected, mean egg developmental rates (1/d) increased as constant temperature increased across all studies. As typically seen in insect developmental studies, the mean duration to hatch (days) was more variable at lower temperatures in both the Pennsylvania study and Park studies (Table 2). For the Pennsylvania study, survival ranged from 87.2% (19.9°C) to 30.0% (26.7°C). Similarly, Choi et al. (2012) found a reduction in survival as the temperature increased; however, Park (2015) showed variable survival rates for temperature treatments (Table 2). Differences in survival rates may be due to incubator humidity levels, egg handling, biological contaminants, egg parasitism, and/or exposure to extreme climate conditions prior to field egg collection. Further studies may want to consider surface sterilization of egg coatings; however, other Hemipterans have been documented to have beneficial symbiotic microorganisms associated with the egg stage which needs to be taken into consideration. Variation in the composition and degree of intact wax coating may also play a factor in hatch success. The coating likely acts as a protective barrier for harsh climatic conditions and desiccation; however, its function as a deterrent for parasitism, predation, and microbial growth has yet to be explored. Due to facility and equipment limitations in our experiments, all of the temperature treatment experiments could not be conducted simultaneously, therefore age and cold storage duration likely played a role in egg viability, given that experiments were started on different dates (Table 1). Furthermore, eggs may be sensitive to sudden temperature changes because they were not given an acclimation period before placing in incubation chambers (moved from 4°C into incubation chambers within approximately 1 h), which may have also influenced survival. For these reasons, the relationship between spotted lanternfly egg survivorship and constant temperature remains unclear.
The fits of the three data sources (Table 3) suggest that while the individual fitted data might lead to different base temperatures and thermal constants, the egg developmental rates observed in two Korea studies and Pennsylvania study could not be proven to be statistically different. Combining the three study’s data into one model likely provides the best estimate for egg developmental rate. While developmental rate could differ between the Pennsylvania population and Korean populations, we do not have the ability to prove or disprove this question based on the data sets available. Thus, until development studies can be conducted with populations from various geographic locations in the same incubation chambers at the same temperatures, direct comparisons are not possible. Therefore, an average model that incorporates data from all three studies should provide a better estimate of the likely base temperature and thermal constant requirements for spotted lanternfly spring egg hatch.
Spring Hatch Prediction Equations Using Estimated Base Thresholds for Accumulated Degree-Days
For both the Pennsylvania and Virginia logistic models, the number of degree-days (DD) to a given proportion of spring hatch completed decreased as the minimum temperature threshold for egg development was increased. The logistic model using the lowest base threshold estimate (T0 = 8.1°C) resulted in 370 ADD and 359 ADD to 50% hatch for Pennsylvania and Virginia respectively, whereas the logistic model using the highest base temperature estimate (T0 = 13.2°C) resulted in 50% egg hatch as 120 ADD for Pennsylvania and 135 ADD for Virginia (Tables 4 and 5).
The overall fits of the Pennsylvania and Virginia models were very similar (Tables 4 and 5), indicating the theoretical base threshold temperatures (T0) used to compute the degree-day accumulations have little influence on model performance. The largest deviation between the prediction models and field observation data occurred in the middle of the hatch period (25–75% hatch), especially in the Virginia data (Fig. 3). This deviation in the Virginia data was most likely due to longer time intervals between observations, resulting in fewer data points to estimate the relationship (5- to 9-d intervals; n = 8). Observations were taken more frequently, in the 2017 Pennsylvania study, resulting in a higher number of data points (n = 35) to estimate the relationship. Therefore, with fewer points to estimate the logistic equation parameters, important detail during the period of rapid hatch may have been missed.
Correspondence Between Pennsylvania and Virginia Models
When the Pennsylvania model-generated prediction curve for the cumulative proportion of hatch was plotted against the cumulative proportion of egg hatch predictions for the Virginia model, the resulting fits for each of the theoretical minimum temperature thresholds had intercept estimates close to zero and a slope estimates close to 1.0 (Fig. 6). The intercept and slopes significantly deviated from zero and 1.0 for most T0 values, respectively, but the differences were minimal and likely a result of a tight relationship due to the large number of data points (df = 60) used to estimate the intercept and slope parameters. Given the strength of the linear relationship between the Pennsylvania and Virginia data sets (Fig. 6; R2 of 0.968 or higher), the models produce very similar timings for egg hatch. Since the Pennsylvania model was fitted with a higher frequency of observations compared to the Virginia model and the two models provided comparable timings for egg hatch, the Pennsylvania model is likely the best choice for predicting the occurrence of L. delicatula spring hatch across geographic locations.
In conclusion, the developmental rate equations from the Pennsylvania study and two Korean studies cannot be directly compared because they were generated using data collected at separate locations and using different incubation chambers. However, they do appear to be close enough to combine their data into an average regression equation to represent spotted lanternfly egg developmental rates. Until spotted lanternfly egg population from geographically separate locations can be compared using the same incubation chambers, we suggest using the base temperature threshold of 10.4°C generated from the combined data to calculate seasonal ADD. Using a base of 10.4°C in the spring egg hatch logistic equation, 50% egg hatch would be predicted to occur at 310 total DD. However, all base threshold (T0) estimates and corresponding thermal constants (K, degree-days) from the independent studies can be used to predict timing of spring egg hatch (first nymph eclosion) with little loss in accuracy.
While the logistic equations that were fitted to field-collected data were not a perfect fit to the actual observed period of egg hatch, they are sufficient for the use in the timing of important pest management practices, such as trapping and control tactics for targeting the first-instar nymph stage. Spatio-temporal proportion egg hatch predictions using logistic model can be currently accessed at http://www.pestwatch.psu.edu/GDD/hatch_expert.html (Fig. 7). These predictions can provide an early warning for homeowners, landscape professionals, Christmas tree growers, grape growers, government personnel, and university researchers and extension professionals to implement traps and prepare for control intervention if needed.
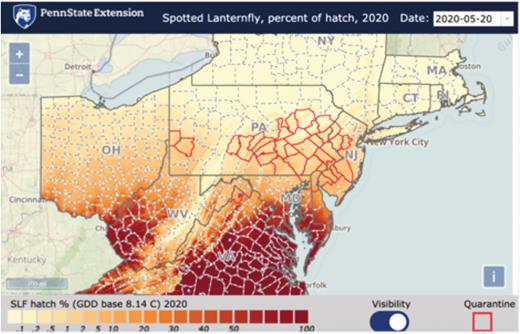
Screen shot of estimated spotted lanternfly cumulative percentage of hatch across the northeast and mid-Atlantic region on 5 May 2020. The prediction map interface is provided through the Penn State Extension software PestWatch (http://www.pestwatch.psu.edu/GDD/hatch_expert.html). This map used an ADD base temperature threshold of 8.14°C (Choi et al. 2012). Future maps will be adjusted using the combined model base temperature threshold of 10.4°C.
Acknowledgments
This work was funded by USDA-APHIS-PPQ under Cooperative Agreement AP18PPQS&T00C221, the Pennsylvania Department of Agriculture under agreement #44144949, and Hatch funding (#1004464) from the USDA National Institute of Food and Agriculture.
References Cited
