


Abstract
Growers of Bacillus thuringiensis (Bt) crops often use refuges of non-Bt plants to delay pest resistance, but plant-to-plant gene flow between Bt and non-Bt crops could affect this strategy. Here we used simulation modeling to explore the consequences of pollen- and seed-mediated gene flow in cotton fields on the evolution of resistance in a generic pest. We modeled a landscape of 0.5-ha fields where growers used farm-saved seed, as could often occur in the developing world. Specifically, we examined the effects of moderate and high gene flow rates, larval feeding behavior, dominance of resistance, refuge type and abundance, and the interactions among these factors. With either completely dominant or completely recessive inheritance of resistance, gene flow among plants and larval feeding behavior had limited practical impact on resistance evolution. With intermediate dominance, however, moderate or high gene flow among plants substantially accelerated resistance evolution in some simulations where non-Bt cotton refuges were 5 or 20% of the cotton acreage. The acceleration was usually greater when larvae moved and fed indiscriminately among Bt and non-Bt cotton plants than when larvae were sedentary or discriminated among plant types. Adding alternative host plant refuges to the landscape delayed resistance, while increasing the non-Bt cotton refuge from 20 to 50% of the cotton acreage had positive, negative, or neutral effects, depending on dominance, the amount of alternative host plant refuges, and larval feeding behavior. The results suggest that, under certain conditions, reducing gene flow between refuges and Bt crops could help delay pest resistance.
Transgenic Bacillus thuringiensis (Bt) cotton (Gossypium hirsutum L.) and corn (Zea mays L.) are used in many parts of the world to control key pests (James 2009). After more than a decade of commercial use, Bt crops remain effective against most target pests, but reports of resistance in five species underline the importance of rigorous resistance management (Tabashnik et al. 2008, 2009; Bagla 2010; Carrière et al. 2010). Most resistance management programs use a high dose of Bt toxin in transgenic plants to lower the fitness conferred by resistance alleles, and “refuges” of non-Bt host plants near Bt crops to maintain high frequencies of susceptible insects (Gould 1998, Carrière et al. 2010). Previous modeling studies compared fields with a random mixture of Bt and non-Bt plants (seed mixtures) to pure fields of non-Bt plants (external refuges) near Bt fields and showed that, under certain conditions, resistance evolved faster with seed mixtures (Mallet and Porter 1992, Tabashnik 1994, Onstad and Gould 1998). Compared with external refuges, seed mixtures may increase the mortality of Bt-susceptible insects if larvae move randomly among plants (Mallet and Porter 1992).
External refuges and Bt fields can unintentionally become mixtures of Bt, non-Bt, and hemizygous (i.e., containing one copy of the transgene) plants if gene flow between the fields is prominent (Chilcutt and Tabashnik 2004, Heuberger et al. 2008a). In cotton, pollen-mediated gene flow occurs when bees transport pollen between Bt and non-Bt fields, and the resulting outcrossed seeds are planted the next year. Seed-mediated gene flow can result from impurities in the purchased seed, accidental mixing of seed types, or residual seed left in the soil from previous seasons (Heuberger et al. 2010). Both pollen- and seed-mediated gene flow have been documented in Arizona cotton, resulting in up to 20% Bt cotton plants in non-Bt cotton fields (Heuberger et al. 2010). Pollen-mediated gene flow could be especially prominent in areas where fields are small and seed saving by farmers is common, as is true in much of the developing world (Bellon and Berthaud 2004, Huang et al. 2009, Showalter et al. 2009, Tripp 2009). Because most gene flow occurs near the edge of fields (e.g., Umbeck et al. 1991), gene flow could be highest in small fields because a higher proportion of the plants occur near the edge. Moreover, in fields where seed is saved each year by farmers, gene flow may accumulate over time (Showalter et al. 2009).
As plant-to-plant gene flow is common in Arizona and perhaps other places, we used simulation models to assess its potential effects on pest resistance. Whereas the relevant large-scale field experiments are impractical and could compromise resistance management strategies, simulations can be helpful for addressing this issue. In previous modeling work, low rates of gene flow from Bt cotton fields to non-Bt cotton refuges had little effect on resistance in Pectinophora gossypiella (Saunders), a cotton pest with recessive resistance and seed-eating larvae that develop on a single plant (Heuberger et al. 2008b). We hypothesized that gene flow could have greater effects when it accumulated across years, larvae moved among plants, and resistance was not recessive (Heuberger et al. 2008b).
Here, we simulated resistance evolution in a hypothetical cropping system where gene flow between single-toxin Bt cotton fields and non-Bt cotton refuges persisted or accumulated across years. Most of our results apply to a situation where small non-Bt cotton refuges (i.e., 0.5 ha) are surrounded by small Bt cotton fields. Although Bt crops with multiple toxins are increasingly adopted, single-toxin Bt cotton continues to be used in much of the developing world (James 2009). Specifically, we measured how resistance was affected by plant-to-plant gene flow, larval feeding behavior, the dominance of resistance, the abundance of non-Bt cotton and alternative host plant refuges, and interactions among these factors.
Methods
We performed simulations of a deterministic model in Visual Basic (Microsoft Excel 2007) to explore the effects of plant-to-plant gene flow on resistance evolution in a generic pest (Fig. 1). Where possible, parameters came from empirical data. Natural selection on the pest population occurred every generation, resulting in a change in the frequency of a resistance allele. Meanwhile, plant-to-plant gene flow between the patch types (i.e., non-Bt cotton refuges and Bt cotton fields) occurred yearly, resulting in a change in the phenotypic composition of plant patches (Fig. 1). The landscape consisted of three patch types: 1) Bt cotton fields, 2) non-Bt cotton refuges, and 3) alternative host plant refuges. We define alternative host plant refuges as plant species other than cotton that host pest larvae but are not sexually compatible with any Bt crop. Thus, they remain 100% non-Bt. Interpretations of results for most of our simulations pertain to regions where field sizes are small (we modeled 0.5 ha-fields, see below) and farm-saved seed is used.

Structure of the model for a simulated landscape with cotton only. The lower loop shows simulated changes in cotton plant genotypes, including homozygous Bt (BB), homozygous non-Bt (NN) and hemizygous (BN) cotton, in a year cycle. The upper loop shows selection on pest genotypes (rr, rs, and ss), which took place four generations per year. Plant frequencies were calculated separately for non-Bt cotton refuges and Bt cotton fields, but the change in the pest resistance allele frequency was calculated over the landscape.
Pest Assumptions.
Resistance to Bt cotton was conferred by one locus with two alleles: r (resistant) and s (susceptible) (Carrière et al. 2010) and was inherited as a recessive, intermediate, or dominant trait (Table 1). The assumption of a single major locus is a reasonable approximation of many cases of resistance to Bt toxins (Ferré and Van Rie 2002, Morin et al. 2003, Carrière et al. 2010). We do not know how expected outcomes would be affected by assuming that resistance was conferred by several genes that each had a small effect. We modeled a generic pest with four generations per year and an initial r allele frequency (pi) of 0.001 (Tabashnik et al. 2008). Adults mated and oviposited randomly among patches, but larvae stayed in their natal patch. For simplicity, survival was the same on hemizygous or homozygous Bt cotton. We reported the time to resistance as years until the frequency of the r allele (p) reached 0.5.
Values of input variables used in simulations
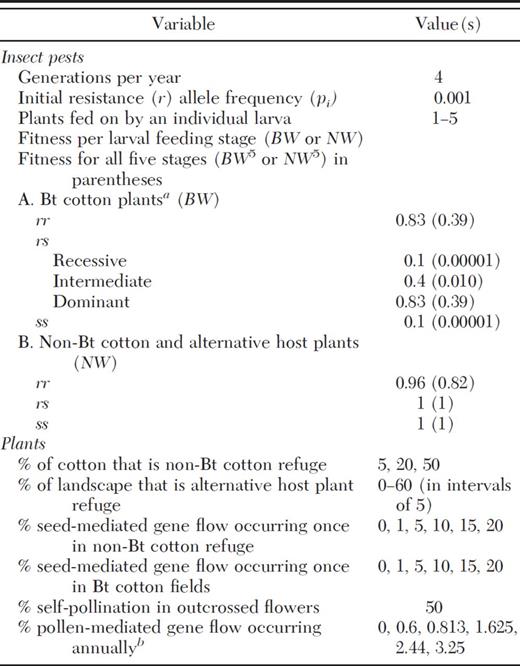
Fitness on hemi- or homozygousBtcotton.
Gene flow rate relative to thenon-Btcotton refuge (see Methods).
Values of input variables used in simulations
Fitness on hemi- or homozygousBtcotton.
Gene flow rate relative to thenon-Btcotton refuge (see Methods).
We assumed that larvae were 1) sedentary (fed only on the natal plant), 2) indiscriminate (fed on the natal plant plus four adjacent plants), or 3) discriminating (fed on the natal plant and up to four adjacent plants but settled after encountering a non-Bt plant). Cotton plants are usually intertwined in the field, and larvae of some pests readily move between them (Halcomb et al. 2000, Men et al. 2005). We could not find published data on the full extent of larval movement among cotton plants. However, we observed that Helicoverpa zea (Boddie) larvae moved across as many as six cotton plants in the greenhouse (T. Brévault, unpublished data). Therefore, we conducted sensitivity analyses of movement to up to two or 10 plants in addition to the default value of five.
Modeling the change in resistance allele frequency.
Estimating Fitness of Sedentary, Indiscriminate, or Discriminating Larvae.
When comparing sedentary, indiscriminate, and discriminating larvae, NWj and BWj were consistent across simulations (Table 1).
Weighting Fitness by the Landscape.
Plant Assumptions.
Recommended refuge sizes range from 5 to 50% of cotton acreage, depending on the pest and assumptions about resistance evolution (Carrière et al. 2005, Showalter et al. 2009, Tabashnik et al. 2009). We focused primarily on 20% non-Bt cotton refuges because gene flow rates could readily be extrapolated from the literature (see “Pollen-mediated gene flow calculations”), but also simulated 5% non-Bt cotton refuges. For conditions where resistance evolved fastest, we examined the utility of 50% non-Bt cotton refuges or alternative host plant refuges to slow resistance evolution. The utility of alternative host plants as refuges hinges on many factors, including host plant quality and phenology of the alternative host plants (Crowder et al. 2008). Here we assumed that alternative host plant refuges were equivalent to pure non-Bt cotton refuges in the number and timing of produced moths.
For simplicity, the abundance of Bt cotton fields, non-Bt cotton refuges, and alternative host plant refuges was constant in a simulation, plants were always suitable hosts for larvae, and Bt cotton plants maintained the same toxin concentration through time. There was no difference in the number or viability of seeds produced by Bt cotton plants versus non-Bt cotton plants or by outcrossing versus self-pollination. Off-type plants were randomly distributed in a patch, reflecting seed mixing that occurs during ginning. Bt and non-Bt cotton were completely sexually compatible (Zhang et al. 2000) and had the same amount of bee pollination.
Pollen- and seed-mediated gene flow varied between zero and “high” rates that were based on maximums found in the literature. “High seed-mediated gene flow” was 20%, which was based on the maximum rate of seed-mediated gene flow of Bt cotton plants in non-Bt cotton seed production fields in a study of 15 fields in Arizona in 2007 (Heuberger et al. 2010). “Moderate seed-mediated gene flow” was 1% Bt cotton seed in non-Bt cotton patches, as this was the median in our 2007 study (Heuberger et al. 2010), and a common rate (three out of 11 bags) in a 2006 survey of seed bags (Heuberger et al. 2008a). We also used 1 and 20% as moderate and high rates of seed-mediated gene flow of non-Bt plants into Bt cotton fields, although we know of no empirical data for seed-mediated gene flow in Bt cotton. For simplicity, we assumed that all plants were homozygous Bt or non-Bt at the beginning of simulations.
Pollen-mediated Gene Flow Calculations.
In simulations of pollen-mediated gene flow, each year the composition of Bt versus non-Bt pollen (male gametes) was calculated separately for the Bt and non-Bt cotton patches. This was based on the proportion of plants that were Bt (100% Bt pollen), non-Bt (100% non-Bt pollen), and hemizygous (50% Bt and 50% non-Bt). Once pollen compositions of the patch types were characterized, and before they were used to father a portion of the seeds, a designated percentage was exchanged between Bt and non-Bt cotton patches. Based on field data summarized in Free (1993), we assumed that all flowers were visited by bees in simulations with pollen-mediated gene flow. For each cotton patch type, plant genotypic frequencies for the next generation were calculated based on the resulting composition of pollen reaching the field, composition of ovules (Bt plants have Bt ovules, non-Bt plants have non-Bt ovules, and hemizygous plants are 50/50), and the percentage of self-pollination. We assumed that 50% of ovules in flowers were self-pollinated, because maximum cross-pollination rates in empirical studies of cotton ranged from 1 to 90% (McGregor 1976). When multiple patches of Bt cotton existed, all contained the same composition of plants, pollen, and seeds.
We defined “high pollen-mediated gene flow” by using an empirical study with particularly high outcrossing in a 4.5-ha-non-Bt-cotton plot bordered on two sides by Bt cotton (Llewellyn et al. 2007). In that plot, the percentages of Bt-outcrossed seeds were ≈15 and 30% in the edge rows, 1–2% 10 m from the edge, and 0.7–1% 25 m from the edge (Llewellyn et al. 2007). Consequently, for a 20% refuge, we assumed that a highly outcrossed 0.5 ha non-Bt cotton field (70 m × 70 m) with 0.5-ha Bt cotton fields on four sides (=2-ha Bt cotton), could have 22.5% [(15%+30%)/2] outcrossing in the outermost meter and 2% outcrossing in the remainder. We assumed that non-Bt cotton refuges and Bt cotton fields were 0.5 ha each, which is the low end of the range of cotton field sizes in the developing world (Showalter et al. 2009). While cotton fields in developing countries can be larger, modeling this worst-case scenario helped us to assess whether realistic gene flow rates could accelerate pest resistance evolution.
Assuming a simple field layout where plant spacing within rows is the same as between rows, ≈6% of plants in a 0.5-ha field occur at the edge. Then, adding together the outcrossing rates for the edge and middle of the field, weighted by the percentage of plants occurring in the edge or middle [(0.225 outcrossing at the edge × 0.06 of plants occurring at edge)+(0.02 outcrossing in middle × 0.94 of plants in middle)=0.0323], the high rate of pollen-mediated gene flow in 20% non-Bt cotton refuges was assumed to be 3.25% of seeds. This equation represents the percentage of seeds that were fertilized by plants from the opposite patch type. Therefore, the maximum percentage of pollen that was exchanged between patches was 6.5% because 6.5% × 50% cross-pollination=3.25% pollen-mediated gene flow. Simulations of 50% refuges had 0.5 ha of non-Bt cotton bordered on one side by 0.5 ha of Bt cotton. “High pollen-mediated gene flow” was 3.25/4=0.81% of seeds, because there was one common field border instead of four.
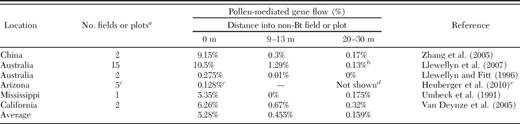
For “moderate pollen-mediated gene flow,” we considered average pollen-mediated gene flow from six studies measuring transgene flow in cotton (Table 2). These studies captured a broad range of geographical regions and field conditions, although most included nontransgenic cotton planted continuously with an adjacent plot of transgenic cotton. We excluded individual or collective fields with reported seed-mediated gene flow rates >0% as resulting plants could affect pollen-mediated gene flow. Average pollen-mediated gene flow was 5.3% of seeds at the field edge, 0.46% at 9–13 m, and 0.16% at 20–30 m (Table 2). Assuming that outcrossing in a 0.5-ha-non Bt-cotton refuge was 5.3% at the outermost meter and 0.3% in the remainder, we calculated a “moderate” rate of 0.6% gene flow in a 0.5-ha-20%-non Bt cotton refuge, using a calculation similar to the one used for high pollen-mediated gene flow. This agrees closely with the only pollen-mediated gene flow study where plants were sampled throughout non-Bt cotton plots (rather than at set distances). In that study, 0.74 and 0.80% of seeds were outcrossed in two 25-m × 185-m plots, and 0.34% were outcrossed in each of two 22-m × 25-m plots (μ=0.56%) (Umbeck et al. 1991).
Rates of pollen-mediated gene flow of transgenes in cotton
For some fields and plots, data were given for only one of the distances.
Some measurements were from the edge of 20 m buffers surrounding transgenic cotton fields.
Pollen-mediated gene flow of theBttransgene was measured innon-Btcotton seed production fields. Pollen-mediated gene flow was measured in 10 additional fields, but they were not included here because they contained seed-mediated gene flow.
We did not include samples taken from 20 m inside the seed production fields in this table, because we only tested those samples for fields with >0% pollen-mediated gene flow at the edge (Heuberger et al. 2010), which could potentially lead to an overestimate of outcrossing at 20 m.
Because we did not have empirical data for estimating pollen-mediated gene flow in 5%-non-Bt cotton refuges, we used moderate and high rates of 0.6% and 3.25%, as for the 20% refuges. In modeling 5% refuges, we assumed that a 0.5-ha non-Bt cotton field was surrounded by 9.5 ha of Bt cotton.
For simplicity, we label pollen-mediated gene flow rates by the percentage of pollen from the non-Bt cotton refuge that was exchanged with the Bt cotton fields. For 5 or 20% non-Bt cotton refuges, a smaller percentage of pollen from Bt cotton fields was exchanged with non-Bt cotton refuges than the reverse, because of the greater area of Bt cotton fields than of the non-Bt cotton refuge. Relative to the non-Bt cotton refuge, there was a four-fold lower percentage of pollen exchanged by the Bt cotton fields for 20% refuges (e.g., 3.25/4=0.81%), and a 19-fold lower percentage for 5% refuges.
Simulations of Gene Flow.
Pollen-mediated gene flow between Bt and non-Bt cotton patches occurred yearly at a constant proportional rate (for example, 0.6% of pollen exchanged between the patch types each year in some simulations), resulting in an accumulation of off-type plants.
In simulations of seed-mediated gene flow, the introduction of off-type plants via residual seed in the soil or human error occurred only once at the beginning of the simulation. In subsequent years, no additional off-type plants were introduced into fields. However, in simulations with both pollen- and seed-mediated gene flow, plants resulting from seed-mediated gene flow outcrossed with other plants.
We simulated: 1) no gene flow, 2) pollen-mediated gene flow between Bt and non-Bt cotton patches, 3) seed-mediated gene flow in the non-Bt cotton refuge, 4) seed-mediated gene flow in the Bt cotton fields, 5) both pollen-mediated gene flow and seed-mediated gene flow, and 6) pollen-mediated gene flow affecting only the non-Bt cotton refuge while Bt patches were planted with pure seed each year. This last scenario could occur in countries where it is illegal to save Bt seed but not non-Bt seed.
Results
Cumulative Effects of Pollen-mediated Gene Flow.
Fig. 2 illustrates the cumulative effects of pollen-mediated gene flow in Bt cotton fields and an associated 20% non-Bt cotton refuge with high (3.25%) pollen-mediated gene flow. The non-Bt cotton refuge experienced higher pollen-mediated gene flow than the Bt cotton fields because there was four-fold more Bt cotton than non-Bt cotton. Although there is no change in the overall frequency of the Bt transgene in the landscape, larval exposure to Bt toxin increases because hemizygous plants contain Bt toxin. In simulations, pollen-mediated gene flow affected both the non-Bt cotton refuge and Bt cotton fields, except where noted.
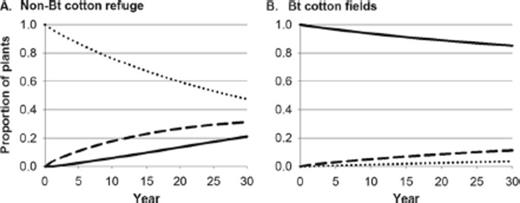
Cumulative effects of pollen-mediated gene flow in (A) a non-Bt cotton refuge and (B) the surrounding Bt cotton fields, for a landscape with 20% non-Bt cotton refuge and 80% Bt cotton fields. Lines show frequencies of homozygous Bt (solid), hemizygous (dashed), and homozygous non-Bt (dotted) cotton plants.
Effects of Gene Flow Among Plants on Pest Resistance.
With 20% non-Bt cotton refuges, pollen-mediated gene flow always accelerated resistance, and results were similar when pollen-mediated gene flow affected both the Bt and non-Bt cotton patches or the non-Bt cotton refuge only (Fig. 3). Seed-mediated gene flow in the non-Bt cotton refuge also accelerated resistance evolution by decreasing the proportion of non-Bt host plants (Fig. 4 A). In contrast, seed-mediated gene flow in the Bt cotton fields delayed resistance for sedentary larvae and, when resistance was recessive, for discriminating larvae, by increasing the proportion of non-Bt host plants (Fig. 4 B). Because seed-mediated gene flow in the non-Bt cotton refuge and pollen-mediated gene flow were the two forms of gene flow that consistently accelerated resistance evolution (Figs. 3 and 4), we also simulated these two forms of gene flow in combination to explore the worst-case scenario (Tables 3 and 4). We defined “high gene flow” as the condition of high seed-mediated gene flow in the non-Bt cotton refuge plus high pollen-mediated gene flow, and “moderate gene flow” as moderate seed-mediated gene flow in the non-Bt cotton refuge plus moderate pollen-mediated gene flow.
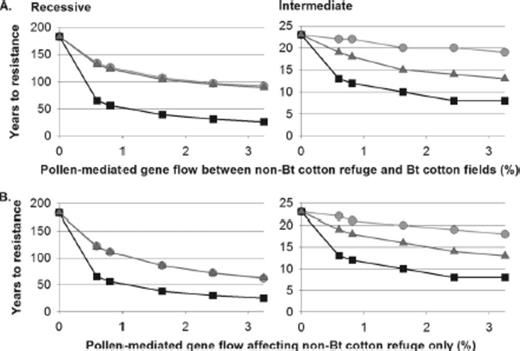
Years to resistance evolution in simulations where pollen-mediated gene flow affected (A) both patch types, or (B) the non-Bt cotton refuge but not the Bt cotton fields. Results are shown for sedentary (light gray, circles), indiscriminate (black, squares), or discriminating (dark gray, triangles) larvae. The dominance of resistance was recessive or intermediate. Non-Bt cotton refuges were 20% of the landscape and no alternative host plant refuges were present. Note that the scale of years differs among panels.
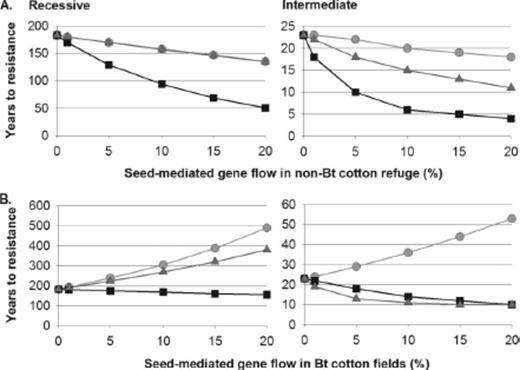
Years to resistance evolution in simulations with seed-mediated gene flow in (A) the non-Bt cotton refuge, or (B) the Bt cotton fields. Results are shown for sedentary (light gray, circles), indiscriminate (black, squares) and discriminating (dark gray, triangles) larvae. The dominance of resistance was recessive or intermediate. Non-Bt cotton refuges were 20% of the landscape and no alternative host plant refuges were present. Note that the scale of years differs among panels.
Effects of moderate or high rates of four combinations of gene flow, including pollen-mediated gene flow (pmgf) and seed-mediated gene flow (smgf) on resistance evolution for landscapes with 20% non-Bt cotton refuges
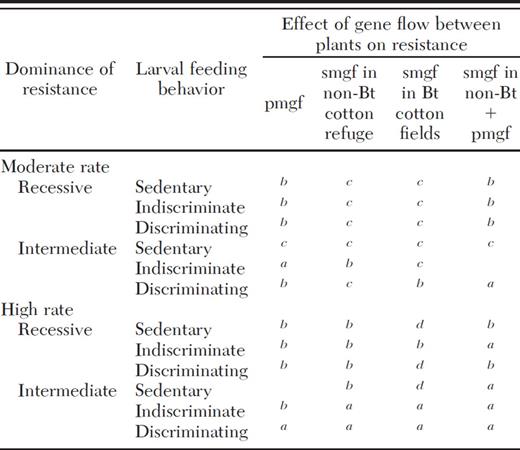
Gene flow brought the years to resistance evolution below 20 and accelerated resistance evolution by more than 5 yr.
Resistance evolution was accelerated, but this effect was small or the time to resistance evolution remained >20 yr.
Effect on resistance was negligible or nonexistent.
Resistance evolution was slowed by gene flow.
Effects of moderate or high rates of four combinations of gene flow, including pollen-mediated gene flow (pmgf) and seed-mediated gene flow (smgf) on resistance evolution for landscapes with 20% non-Bt cotton refuges
Gene flow brought the years to resistance evolution below 20 and accelerated resistance evolution by more than 5 yr.
Resistance evolution was accelerated, but this effect was small or the time to resistance evolution remained >20 yr.
Effect on resistance was negligible or nonexistent.
Resistance evolution was slowed by gene flow.
Effects of dominance and larval feeding behavior on the evolution of pest resistance to Bt cotton in simulations with both pollen- and seed-mediated gene flow and 20 or 5% non-Bt cotton refuges
Pollen-mediated gene flow = 0.6%; seed-mediated gene flow (in thenon-Btcotton refuge only) = 1%.
Pollen-mediated gene flow = 3.25%; seed-mediated gene flow (in thenon-Btcotton refuge only) = 20%.
We defined the effects of gene flow as “important” when gene flow decreased the time to resistance evolution by several years and resistance evolved in <20 yr (Table 3). Most simulations where gene flow had an important effect involved indiscriminately moving larvae and moderate to high pollen-mediated gene flow, seed-mediated gene flow, or both (Table 3). When dominance was intermediate, gene flow also had an important effect on resistance in discriminating pests if pollen-mediated gene flow or seed-mediated gene flow were high, and in sedentary pests if both seed-mediated gene flow in the non-Bt cotton refuge and pollen-mediated gene flow were high (Table 3).
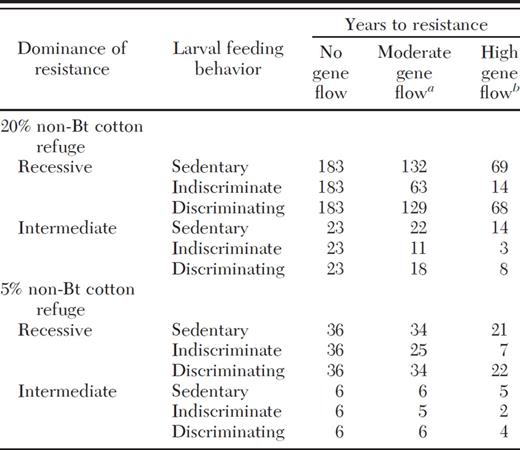
When 20% non-Bt cotton refuges were replaced by 5% non-Bt cotton refuges, resistance evolved faster and the proportional effect of gene flow on resistance was smaller (Table 4). With 5% non-Bt cotton refuges, high gene flow had important effects on resistance in indiscriminate larvae with recessive resistance, but not in discriminating or sedentary larvae (Table 4). With moderate gene flow rates, the years until resistance evolved did not drop below 20 if resistance was recessive, and did not change by more than 1 yr if dominance was intermediate (Table 4).
The relationship between gene flow and resistance evolution was affected by dominance. When resistance was recessive, it evolved slowly (>20 yr) regardless of gene flow, unless larvae moved indiscriminately and high gene flow occurred (Table 4). When resistance was dominant, it always evolved in 1–3 yr under the conditions examined in Table 4. However, in simulations of 20% non-Bt cotton refuges, gene flow frequently brought the time to resistance from >20 yr to <20 yr when dominance was intermediate (Tables 3 and 4). When 5% non-Bt cotton refuges were used, resistance evolved in <10 yr regardless of gene flow if dominance was intermediate, although high gene flow cut the years to resistance evolution from six to two in indiscriminate pests with intermediate dominance (Table 4). Therefore, gene flow tended to have the most important effects when dominance was intermediate for 20% non-Bt cotton refuges, but this trend was not seen with 5% non-Bt cotton refuges (Tables 3 and 4).
Holding the other factors constant, when gene flow was >0, larvae that moved indiscriminately among plants usually evolved resistance faster than sedentary or discriminating larvae (Table 4; Figs. 3 and 4). Compared with sedentary larvae, the rate of resistance in discriminating larvae was similar when resistance was recessive (Table 4; Figs. 3 and 4). In contrast, when resistance was intermediate, resistance evolved faster in discriminating larvae than in sedentary larvae if 20% non-Bt cotton refuges were used (Table 4; Figs. 3 and 4). When 5% non-Bt cotton refuges were used, sedentary and discriminating larvae evolved resistance at similar rates irrespective of dominance (Table 4). Therefore, the effects of larval movement on resistance can vary depending on refuge size and dominance.
In simulations where larval movement of indiscriminate and discriminating larvae was capped at two plants instead of five, gene flow only had important implications when both seed-mediated gene flow in the non-Bt cotton refuge and pollen-mediated gene flow were high and dominance was intermediate (Supp. Table S1). When movement was capped at 10 plants, the effects were qualitatively the same as simulations of five plants (Supp. Table S1).
Remediating the Effects of Gene Flow With 50% Non-Bt Cotton Refuges or Alternative Host Plant Refuges.
We further explored high gene flow simulations to determine whether large non-Bt cotton refuges or alternative host plant refuges could mitigate the effects of gene flow on resistance evolution. When cotton was the only host plant (Fig. 5, x-intercept), increasing the size of non-Bt cotton refuges from 20 to 50% always delayed resistance, although the delay was sometimes slight. Planting up to 60% of the landscape with alternative host plant refuges delayed the evolution of resistance to >20 yr for all scenarios with recessive or intermediate dominance (Fig. 5). In contrast, when resistance was dominant, both 50% non-Bt cotton refuges and large alternative host plant refuges (>50% of host plants) were needed to delay the evolution of resistance to >20 yr for sedentary or discriminating larvae (Fig. 5). This strategy did not bring the time to resistance past 20 yr for indiscriminate larvae when resistance was dominant (Fig. 5 B). Surprisingly, for indiscriminate larvae, the time to resistance evolution sometimes decreased when the size of the non-Bt cotton refuge increased if alternative host plant refuges were available (Fig. 5 B). This decrease occurred when alternative host plant refuges exceeded 20% of the landscape when resistance was recessive or 10% of the landscape when dominance was intermediate (Fig. 5 B).
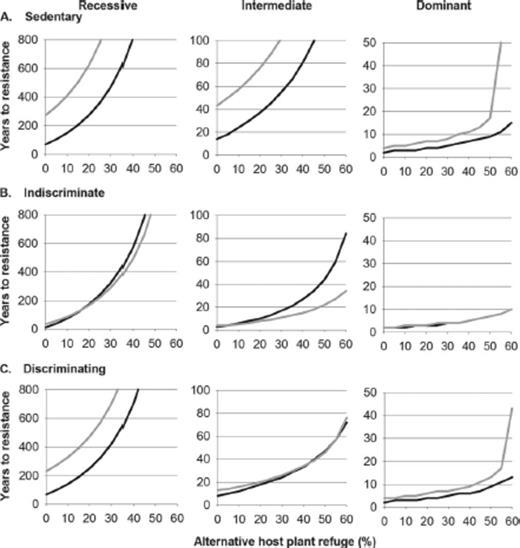
Effects of non-Bt cotton refuge size (black line: 20% of cotton; gray line: 50% of cotton) and alternative host plant refuge size (x-axis; 100% minus the percentage of host plants that were cotton) on the years to resistance evolution in simulations of high gene flow. The three larval feeding strategies and three degrees of dominance are shown. Note that the scale of years differs among panels. High gene flow included 20% seed-mediated gene flow in the non-Bt cotton refuge and 3.25% or 0.81% pollen-mediated gene flow for 20% or 50% non-Bt cotton refuges, respectively.
Discussion
Under some of the conditions modeled here, pollen- and seed-mediated gene flow had important effects on pest resistance evolution (Table 3). In particular, indiscriminate movement of larvae among plants consistently enhanced the association between gene flow and resistance compared with sedentary behavior. When high gene flow was simulated, increasing non-Bt cotton refuges to 50% of the cotton acreage and planting up to 60% of the landscape with alternative host plant refuges brought the time to resistance past 20 yr unless pests moved indiscriminately and resistance was dominant (Fig. 5).
Interestingly, increasing the size of non-Bt cotton refuges from 20% of cotton acreage to 50% accelerated resistance in some simulations that included indiscriminate larvae, high gene flow, and alternative host plant refuges (Fig. 5 B). In those scenarios, alternative host plant refuges produced enough ss individuals to delay resistance, but impure refuges of non-Bt cotton selected for resistance. Similarly, Mallet and Porter (1992) and Tabashnik (1994) modeled certain conditions under which resistance evolved faster with a seed mixture plus a non-Bt external refuge than with a pure Bt field and a non-Bt external refuge if larvae moved indiscriminately among plants.
Effects of Seed Saving and Farm Size on Plant Gene Flow.
Use of farm-saved cotton and maize seed is common in developing countries, despite industry and government efforts to promote commercial seed use (Bellon and Berthaud 2004, Huang et al. 2009, Tripp 2009). Farm-saved seed is highly vulnerable to accumulating gene flow (Gaines et al. 2007). Furthermore, seed distributing companies in developing regions often purchase from small farms where gene flow could be prominent. Here we modeled pollen-mediated gene flow in 0.5 ha non-Bt cotton refuges planted near Bt cotton fields. In developing countries, farms can be as small as 0.4–4 ha (Showalter et al. 2009). We expect pollen-mediated gene flow rates to be lower in large fields than in small fields. We also expect rates to be lower in non-Bt cotton refuges that are far from Bt cotton fields, but refuges should be no farther from Bt fields than the dispersal distance of target pests (Showalter et al. 2009).
Although our simulations of pollen-mediated gene flow represent a worst-case scenario, our simulated rates of seed-mediated gene flow were independent of field size and distance from other fields. Seed-mediated gene flow could reach rates above the 20% maximum modeled here, in which case we would expect resistance to evolve even faster. It appears that, at least for single-toxin Bt cotton, ensuring the quality of Bt cotton seed would not mitigate the effects of pollen-mediated gene flow on resistance (compare Fig. 3 A to Fig. 3 B). Farmers may save non-Bt cotton seed more often than Bt cotton seed in countries such as Argentina, Colombia, and Mexico, where saving of Bt cotton seed, but not non-Bt cotton seed, is illegal (Tripp 2009). Farmers often ignore these restrictions, however. For example, in Argentina, most Bt cotton seed is either farm-saved or obtained from other farmers (Tripp 2009). Governments in China and India do not restrict the saving of transgenic cotton seed (Tripp 2009).
Effects of Plant-to-Plant Gene Flow on ss Survival and Dominance of Resistance.
In most of the simulations performed here, plant-to-plant gene flow accelerated resistance by increasing ss mortality, thereby decreasing the effective size of refuges. In some of our simulations with intermediate dominance and mobile pests, gene flow also increased dominance because escape from Bt plants was higher for rs larvae than for ss larvae. Mallet and Porter (1992) also modeled increased dominance in seed mixtures. However, in a study of mixed stands of Bt and non-Bt broccoli, all rs larvae of Plutella xylostella died after leaving Bt broccoli (Brassica oleracea L.) plants (Tang et al. 2001). Also, survival did not differ between rs and ss larvae of P. gossypiella in mixtures of Bt and non-Bt cotton seed (Heuberger et al. 2008b). Whereas both of the pests mentioned above had functionally recessive resistance to the Bt plants or seeds, other pests with high mobility and nonrecessive resistance might show the hypothesized increase in dominance in seed mixtures (Heuberger et al. 2008b). Candidates include H. zea and H. armigera (Hübner), both of which have nonrecessive resistance to the Cry1Ac toxin that is produced by single-toxin Bt cotton (Burd et al. 2003, Nair et al. 2010). Studies comparing survival of ss and rs larvae of these species in seed mixtures versus pure stands of Bt and non-Bt plants would be useful for testing the dominance shift hypothesis.
Effect of Larval Movement on Resistance.
While indiscriminate movement is generally assumed to accelerate resistance evolution in seed mixtures, Mallet and Porter (1992) noted that the effects of nonrandom movement are harder to predict. In our simulations, resistance typically evolved more slowly for discriminating larvae than indiscriminate larvae because more discriminating ss larvae could escape Bt cotton plants. Resistance evolved faster in discriminating larvae than in sedentary larvae because rr individuals (and rs when resistance was not recessive) escaped Bt plants more often than ss did. Similarly, in an empirical study of Ostrinia nubilalis (Hübner), resistant larvae moved from Bt corn plants to adjacent non-Bt corn plants more often than susceptible larvae did (Prasifka et al. 2010).
Pests with some ability to discriminately feed on non-Bt substrates as larvae include Heliothis virescens (F.), H. zea, Spodoptera exigua (Hübner), Trichoplusia ni (Hübner), O. nubilalis, and H. armigera (Gould et al. 1991, Jyoti et al. 1996, Stapel et al. 1998, Parker and Luttrell 1999, Gore et al. 2002, Zhang et al. 2004, Gore et al. 2005, Men et al. 2005, Li et al. 2006, Prasifka et al. 2009). In studies of H. virescens and H. armigera, more larvae moved from Bt cotton plants to non-Bt cotton plants than vice versa (Parker and Luttrell 1999, Men et al. 2005). However, Halcomb et al. (2000) reported no increase in the number of H. zea or H. virescens larvae on non-Bt cotton plants in mixed stands of Bt and non-Bt cotton 48 h after infestation, perhaps because many larvae that abandoned Bt plants never made it to another plant.
In contrast to pests with mobile larvae, two pests targeted by Bt cotton, P. gossypiella and Cryptophlebia leucotreta (Meyrick), complete larval development in a single cotton boll. In our model, gene flow had straightforward effects on resistance in sedentary larvae: decreasing the effective size of refuges when it occurred in the non-Bt cotton refuge and increasing effective refuge size when it occurred in Bt cotton fields (Fig. 4). For larvae that feed on cotton seeds, exposure to Bt toxins is more complex than modeled here, as Bt-outcrossed non-Bt flowers and self-pollinating hemizygous flowers produce seeds with and without Bt toxin in the same boll (Heuberger et al. 2008a). However, small numbers of off-type seeds in bolls probably have minimal effects on resistance in P. gossypiella (Heuberger et al. 2008b).
Intentional Seed Mixtures and Two-toxin Bt Crops.
We did not model intentional mixtures of Bt and non-Bt plants, nor did we consider Bt plants that produce more than one toxin. In April 2010, the U.S. Environmental Protection Agency (USEPA) approved intentional mixtures of corn seed with and without the coleopteran-active Cry34/35Ab1 toxins as a “seed blend” resistance management strategy for Diabrotica species (USEPA 2010). Our modeling does not address this approach, because all simulations reported here included external refuges of non-Bt cotton, whereas the seed mixture strategy approved by the USEPA does not require external refuges for coleopteran pests. However, previous work has examined the potential consequences of intentional seed mixtures on resistance evolution (Mallet and Porter 1992, Tabashnik 1994, Onstad and Gould 1998, Davis and Onstad 2000, Onstad 2006). When external refuges are absent and resistance is controlled by a single locus, the presence of non-Bt plants in a seed mixture is expected to slow the evolution of resistance (Tabashnik 1994).
Two-toxin Bt cotton has replaced one-toxin Bt cotton in Australia and the United States, and similar replacements are expected eventually in other countries (Baker et al. 2008, Bravo and Soberón 2008, Matten et al. 2008, Bagla 2010). The effects of plant-to-plant gene flow on resistance may be more complicated for two-toxin Bt crops than for the one-toxin Bt cotton modeled here. If genes for the two toxins are not tightly linked genetically, gene flow from two-toxin crops could yield plants with one toxin, violating the principle of minimizing pest exposure to one-toxin plants (Fitt et al. 2004, Zhao et al. 2005). ‘Bollgard II’ cotton was created by retransforming the one-toxin Bollgard cultivar (Monsanto 2003), so genes for the two toxins are unlikely to be tightly linked.
Conclusions
Results suggest that, in regions where field sizes are small and seed-saving by farmers is common, maintaining the purity of refuge seed may be important for delaying resistance evolution in pests. One way growers could increase the purity of their planted seeds is by obtaining certified seeds rather than saving them (Gaines et al. 2007). In addition, for polyphagous pests, refuges of non-Bt host plants other than cotton could be useful in locations where high gene flow is expected, but this strategy depends on many factors, including the suitability of the alternative host plant refuge for the pest and whether or not moths emerge synchronously from the crops (Crowder et al. 2006, 2008). If alternative host plants are used as refuges, it is important that they do not have sexually compatible Bt crop relatives, or they too could contain Bt transgenes from plant-to-plant gene flow. Future empirical studies on the extent of larval movement among plants in seed mixtures and the effect of movement and feeding behavior on resistance evolution would be useful for testing predictions of our model.
This research was funded by a United States Environmental Protection Agency Science to Achieve Results (STAR) Graduate Fellowship FP 916819 and USDA–NRICGP grant 2007-35302-18225. USEPA has not officially endorsed this publication and the views expressed herein may not reflect the views of the USEPA.
References
