


Abstract
The soybean aphid Aphis glycines Matsumura (Hemiptera: Aphididae) is an invasive economic pest of soybean (Glycine max [L.] Merrill) in the United States. Research has shown the endemic natural enemy community in the United States is capable of suppressing A. glycines below EILs, but this biological control is inconsistent, especially in simple agricultural landscapes. In the course of a 3-yr project (2006-2008) we sought to determine the affects of landscape composition, configuration, and plant nutrients (N, P, and K) on A. glycines and aphidophagous natural enemy abundance. Specifically, we tested whether nearby grasslands contribute to the abundance of natural enemies and the suppression of A. glycines. The study site was located around the Neal Smith National Wildlife Refuge, composed of >2,000 ha of reconstructed prairie, located in Jasper County, IA. We sampled A. glycines, natural enemies, and plant nutrients in 100 soybean fields while characterizing the landscape surrounding each field. A. glycines abundance was lowest in 2006 but reached economically damaging populations in 2007 and 2008. The ratio of natural enemies to A. glycines decreased in each year of our study (2006 > 2007 > 2008). Variation in A. glycines and natural enemies was best explained by year and, to a lesser extent by plant nutrient levels and landscape variables. Results suggest grassland habitat did not significantly contribute to the biological control of A. glycines. Furthermore, yearly decline of natural enemy may have facilitated the colonization of A. glycines leading to outbreaks later in the season.
Soybean aphid, Aphis glycines Matsumura (Hemiptera: Aphididae), is an invasive economic pest of soybean, Glycine max (L.) Merr., in the United States. In Asia, natural enemies suppress A. glycines below EILs (Liu et al. 2004, Miao et al. 2007). A community of natural enemies in North America, mostly predators, can reduce A. glycines populations three to sevenfold (Fox et al. 2004, Schmidt et al. 2007, Miao et al. 2007, Gardiner et al. 2009a). Despite evidence of biological control of A. glycines, economic populations are encountered by many growers across the north-central United States and Iowa; specifically, resulting in the use of foliar insecticides to maintain optimal yields (Johnson et al. 2009).
A lack of consistent biological control in this region may be tied to the overall reduction of native biodiversity, as a result of the conversion to large-scale agricultural systems over the last 150 yr (Smith 1998). Before settlement by Euro-Americans in the early to mid-1800s, land in Iowa was composed of ≈79.5% prairie, 11.7% forest, 6.7% savanna, and 1.4% wetland cover types (Smith 1998). Today two crops (corn [Zea mays L.] and soybean), which are novel species from the perspective of the native biota (Hobbs et al. 2006), dominate Iowa's landscapes composing ≈62.8% of the land cover (United States Department of Agriculture [USDA] 2007). The native prairie habitat that the majority of species are adapted to, now occupies <0.1% of this area (Smith 1998). This loss of native cover types may negatively affect ecosystem services, specifically biological control of insect pests (Kreuss and Tscharntke 1994, Thies and Tscharntke 1999, Lee et al. 2001, Elliott et al. 2002, Kremen et al. 2002, Menalled et al. 2003, Landis et al. 2008). Several perennial forbs commonly found in prairies are highly attractive to natural enemies of herbivorous pests (Fiedler and Landis 2009). Furthermore, an insect's ability to move around landscapes is dependent on the composition and arrangement of the land cover types, thereby affecting the biological control services provided by natural enemies (Marino and Landis 1996, Elliott et al. 1999, Thies et al. 2003, and Tscharntke et al. 2005). In agricultural landscapes, the composition and arrangement of land cover types is known to affect the abundance, community structure, and effectiveness of predator and parasitoid communities (Marino and Landis 1996, Dyer and Landis 1997, Thies and Tscharntke 1999, Elliott et al. 2002, Menalled et al. 2003, Thies et al. 2003). For example, parasitism in a field crop is reduced in simple compared with more diversified agricultural landscapes that include potential alternate hosts, adult feeding sites, and overwintering habitats for parasitoids (Menalled et al. 1999, Thies et al. 2005).
In addition to land cover characteristics, spatial variability in plant macronutrient levels (N, P, and K) have been shown to influence the growth rates of herbivorous pests. Myers and Gratton (2006) observed an increase in A. glycines population growth rates on K-deficient plants grown in K-deficient soils. Walter and DiFonzo (2007) suggested that the nutritional quality of soybeans for A. glycines is improved when the plant is K-deficient. Noma et al. (2010) observed that A. glycines abundance was positively correlated with the concentration of N in leaves, and negatively correlated with the concentration of leaf K. Moving up a trophic level, natural enemies can also be affected by the nutrient composition of the plants on which their prey or hosts feed (Mayntz and Toft 2001, Walker et al. 2008). Mayntz and Toft (2001) observed increased growth rates and survivorship of wolf spiders Pardosa amentata (Cl.) when prey were fed more nutritious host plants, and Walker et al. (2008) observed greater parasitism of the tephritid fly Xyphosia miliaria (Schrank) reared on fertilized thistles.
Previous studies have observed an affect of landscape composition and diversity on A. glycines abundance (Gardiner et al. 2009a, Noma et al. 2010) and natural enemy diversity and abundance (Gardiner et al. 2009b, Noma et al. 2010). These studies suggest that the biological control of A. glycines is positively influenced by the configuration of noncrop habitat types surrounding soybean fields. Based on these findings and the limited amount of noncrop habitat in Iowa, our goal was to determine the effect of landscape composition, configuration, and plant macronutrients on A. glycines and natural enemy abundance. We hypothesized that the abundance of natural enemies in soybean fields would be positively correlated with an increased amount of grassland habitat surrounding the field. In turn, we expected that a greater abundance of natural enemies would reduce the abundance of A. glycines. In terms of the type of grassland habitat, we specifically focused on tallgrass prairie, because it was once the dominant land cover in Iowa (Smith 1998), and the natural enemy community is adapted to it. For this reason, we anticipated the response of natural enemies to be more evident in our study than in Gardiner et al. (2009b) and Noma et al. (2010). To account for possible nutritional effects on A. glycines and natural enemy abundance, we also measured plant macronutrients (N, P, and K). We hypothesized that A. glycines and natural enemies will be more abundant on soybean plants with higher N and less abundant on plants with lower P and K.
Materials and Methods
Experimental Design.
Over the course of this 3-yr study, 100 conventionally managed soybean fields (30, 36, and 34 in 2006, 2007, and 2008, respectively) were selected around the Neal Smith National Wildlife Refuge (NSNWR; Fig. 1). NSNWR consists of >2,000 ha of reconstructed tallgrass prairie planted with >200 species of forbs and grasses. The land around NSNWR is dominated by annual crop production, primarily a corn–soybean rotation with patchy fragments of deciduous forests, pasture, and alfalfa. All soybean fields used in this study were planted in 38 cm rows as part of a rotation with corn and were managed with minimum or no-tillage. Herbicide (typically glyphosate) was applied to soybean about 1 mo after planting to control weeds.
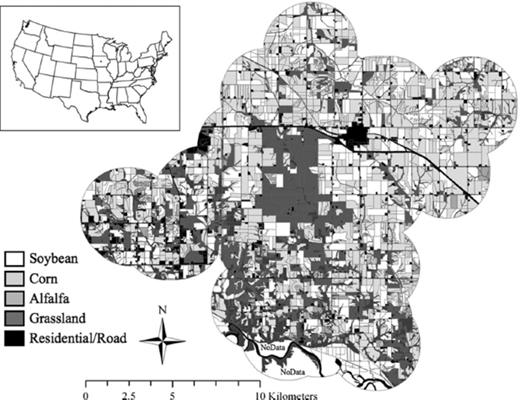
Study site located around NSWR in southeast Jasper County, IA (30 km east of Des Moines, IA); inset shows study site location in United States.
In each year, fields were initially selected based on our ability to gain access to them. The final selection criteria were: distance from NSNWR (grassland), field size, and distance from nearest selected field. Field size ranged from 4 to 70 ha, and averaged 20.7, 17.3, and 17.6 ha in 2006, 2007, and 2008. A distance of ≈1.0 km was used to select fields (mean distance between any two field's centers was 2.5 km). Because fields were rotated, there was no overlap between fields in consecutive years; however, three fields were used in both 2006 and 2008. Within each field, four sample locations were randomly selected using a geographic information system, with a minimum distance between two sample locations set to 20 m, and a minimum distance from field edge set to 10 m and stored in a global position system (GPS) for field use (Environmental Systems Research Institute [ESRI] 2007).
Soybean Aphid and Natural Enemy Sampling.
The dependent (response) variables for this study include the abundance of A. glycines and natural enemies. All soybean fields were sampled once per week for A. glycines and natural enemies from June–August. To focus our sampling effort on natural enemies that were aphidophagous and most likely to respond to A. glycines, we used field-counts, sweep-nets, and yellow-sticky cards (Schmidt et al. 2008). The precision of a sampling method varies by natural enemy taxon; therefore, data from a single sampling method were used to represent an individual taxon (Schmidt et al. 2008). In previous studies, we found that field-counts were the most precise method for collecting O. insidiosus, sweep-net samples for Nabis spp. (Hemiptera: Nabidae) and Araneae, and yellow-sticky cards for all coccinellids, syrphids, Chrysoperla spp. (Neuroptera: Chrysopidae), and parasitic wasps (Braconidae and Ichneumonidae) (Schmidt et al. 2008). Aphis glycines and natural enemy abundance was determined by counting all aphids and natural enemies (adult and immature) on 20 consecutive plants at four locations per field using (in situ) field-counts. The abundance of A. glycines was averaged across field by date and summarized by calculating cumulative aphid days (CAD), which are calculated similarly to degree-days and are a measure of the seasonal exposure of plants to A. glycines (Hanafi et al. 1989). Natural enemies were collected at four sampling locations within each field. At each location natural enemies were collected with 20 continuous pendulum sweeps, and one unbaited yellow-sticky card (Pherocon AM, Trécé, Inc., Adair, OK), folded in half so it was sticky on both sides. Yellow-sticky cards were mounted on a wooden stake and the height of the card was adjusted each week to keep the bottom of the trap above the soybean canopy. The abundance of individual natural enemy taxa was summarized for June, July, and August.
Natural enemies obtained from sweep-net and yellow-sticky card samples were bagged and stored at −20°C. All natural enemies collected were sorted and identified to at least the family level except for Orius insidiosus (Say) (Hemiptera: Anthocoridae), Podisus maculiventris (Say) (Hemiptera: Pentatomidae), and all Coccinellidae, which were identified to species. Both adult and immature stages of natural enemies were counted and voucher specimens were deposited in the Department of Entomology insect collection at Iowa State University, Ames, IA. A principal component analysis (PCA) was used to determine which natural enemies explained most of the variability in abundance using R statistical packages (Oksanen et al. 2010, R Development Core Team 2009). The covariance matrix was created using weekly count data to determine the variance of species, and the degree to which species were correlated.
To determine the abundance of immigrating A. glycines into our study area, alates were collected with a suction trap, designed to capture alates as they descend from migratory flights (Allison and Pike 1988), located 64 km NW from the center of our study site (lat 42.017, lon 93.778). The suction trap draws 10 m3 of air per minute with an electric fan through a ≈6-m vertical tube (diameter at top 30.5 cm and bottom 38 cm), which was operated only during daylight hours May through October. Captured alates were drawn into a propylene glycol-filled jar, which was replaced weekly. Samples were sent to the Illinois Natural History Survey where the aphids were identified and counted.
Plant Nutrient Sampling.
Soybean plant nutrients were quantified at the end of July when plants were in the R4 stage (pod growth; Pedersen 2004). The single uppermost trifoliolate was removed from five plants at each of the four sample locations per field (20 trifoliolates per field). Samples were allowed to dry in paper bags at room temperature for a minimum of 2 mo, and sent to a private laboratory (Agvise Laboratories, Northwood, ND) for analysis. N, P, and K content were each expressed as a percent of total dry mass.
Landscape Measurements.
From 2006–2008, all land cover elements within 2.5 km of the field center were summarized at a 15-m resolution using land cover maps. Common Land Unit (USDA Farm Service Agency [FSA] 2006) and National Land Cover Dataset data (NLCD 2001) were initially used to create maps, but all land cover elements were confirmed through an on-the-ground survey.
In preliminary analyses, we divided the land cover data into multiple, nonoverlapping concentric rings to determine whether there was an effect of distance on A. glycines or natural enemy community response to land cover (Thies et al. 2005; Gardiner et al. 2009a, b). We detected no effect and indeed little change in composition, diversity, or configuration of the landscape at different distances from the surveyed fields. Thus, in all subsequent analyses we combined all land cover measurements into a single dataset centered on each field and extending 2.0 km from the field. Measures of surrounding landscape composition, diversity, and contagion (spatial configuration) were calculated for each field on rasterized layers of land cover.
Approximately 97% of the landscape composition surrounding all soybean fields was composed of alfalfa, corn, forest, grassland (perennial grasses and forbs), residential, roads, soybean, and water. Using methods from Gardiner et al. (2009a, b), landscape diversity was measured with Simpson's index (1 - D) calculated using R statistical packages (Oksanen et al. 2010, R Development Core Team 2009). Simpson's index is typically used to summarize species diversity (Magurran 2004), but here it was used to summarize landscape diversity. The value of D ranges between 0 and one with zero corresponding to a simple and one corresponding to a diverse landscape. A contagion index (Li and Reynolds 1993) was calculated from a simplified land cover layer, in which all vegetation types were reclassified as either perennial or annual, using Fragstats (McGarigal et al. 2002). Contagion measures the extent to which landscape patches, or raster “cells,” are clumped or dispersed (McGarigal and Marks 1995). A large contagion value suggests a landscape contained a few large contiguous patches, whereas a small value suggests the landscape contained many small dispersed patches (McGarigal and Marks 1995).
Data Analysis.
To determine whether sampled soybean fields were independent of one another, we used Moran's I in preliminary analysis on response variables (CAD and natural enemy data) to test for spatial autocorrelation among our data using R statistical packages (Bivand et al. 2010, R Development Core Team 2008). We did not detect spatial autocorrelation in peak CAD or pooled natural enemy data (all field and distance combinations; P > 0.07), therefore, we did not account for it in further statistical tests. All soybean fields were sampled until insecticides were applied and the timing of this varied between years. In 2007 aphid populations peaked earlier than 2006 and 2008. Thus, to compare between years all analyses with aphid abundance include data through the second week of August.
To determine which plant nutrients and landscape metrics explained most of the variability in the response variables, CAD and natural enemy data were analyzed using multidimensional scaling (MDS) with the Bray-Curtis distance measure (Bray and Curtis 1957). MDS is a standard, nonparametric exploratory technique used in community and landscape ecology to obtain a general and holistic understanding of patterns in data (McCune and Grace 2002). As a multivariate statistical technique, it summarizes relationships between response and explanatory variables according to their distances in multidimensional space; the closer two points are, the more similar they are (Kenkel and Orlóci 1986). Pairwise correlations were assessed with the intent of selecting a subset of independent explanatory variables to include in the analysis and thus reducing multicollinearity in the dataset (Weisberg 1985). All pairwise correlations were below r=0.70 so all variables were included in the MDS analysis. Preliminary analyses were run with up to six ordination axes, and based on levels of stress the final analysis was run with two ordination axes. The specifications of the final MDS model included two axes and a random starting configuration with both real and random data. The final solution had a stress of 14.28, which is satisfactory for ecological community data (McCune and Grace 2002), and a final instability of 0.00001 based on 91 iterations. The amount of variation explained by two axes produced an R2=0.90. All response variables were graphed as points and independent variables were graphed as vectors using PC-ORD on MDS plots (McCune and Mefford 1999). Vectors indicate the direction and strength of correlations among CAD and natural enemies, year, plant nutrients, and landscape variables. Pearson correlations were used to assess the importance of independent and response variables. This analysis was initially conducted for individual years; however, only a few minor correlations in these data were detected, thus all data were combined using year as an explanatory variable. MDS also provides an educated means for reducing the number of factors that then need to be considered in the parametric regression models (McCune and Grace 2002).
We used multiple linear regression analysis and Akaike's Information Criterion for model selection, adjusted for sample size (AICc; Burnham and Anderson 2002), to determine which variables (year, plant nutrients, and/or landscape metrics) best explained CAD and individual natural enemy abundance. Eleven variables were compared: year (categorical variable), N, P, K, the area (m2) of alfalfa, corn, forest, grassland, soybean, Simpson's D, and contagion. For each analysis, we present the number of variables in a model (K), and several parameters associated with that model including; AICc value, AICc differences (ΔAICc), Akaike weight (wi), and adjusted R2 value. For each response variable, we present the “best-fit” model, which had the minimum AICc value, and “competing” models, which had a ΔAICc difference of less than two and showed strong support for the response variable (Burnham and Anderson 2002). The AICc analysis was conducted and adjusted R2 were calculated using JMP (SAS Institute 2009). We used linear regression analysis to determine the relationship between response and explanatory variables identified by both best-fit and competing models using JMP (SAS Institute 2009).
To determine the relationship between A. glycines and natural enemies, the mean abundance of natural enemies, pooled across seven taxa, and A. glycines was calculated for each week during 2006, 2007, and 2008. The abundance of A. glycines and natural enemies was transformed ln(x+1) to meet the assumptions of analysis of variance (ANOVA) (Sokal and Rohlf 1995). The values used for natural enemies were based on a mean pooled across seven taxa collected from their corresponding sampling method(s): O. insidiosus, Nabis spp., native and exotic coccinellids, Chrysoperla spp., syrphids, and Araneae. These generalist natural enemies are known predators of A. glycines. Although adult Chrysoperla spp. and syrphids are not predaceous the larval stages are, and an increase in their abundance could indicate a numerical response to increased A. glycines populations. Using analysis of covariance (ANCOVA) in JMP (SAS Institute 2009), we tested the hypothesis that slopes (the increasing rate of natural enemies to aphid abundance) between years are equal. We predicted that an increase in A. glycines would elicit an increase in natural enemies; therefore, slopes would concomitantly increase. The response variable in the ANCOVA model was mean natural enemies per sample and covariates were A. glycines, year, and the interaction between A. glycines and year. Slopes were compared between years using contrast statements.
Results
Soybean Aphid and Natural Enemy Populations.
Peak populations of A. glycines averaged 170 aphids per plant (256 CAD) in 2006; 370 aphids per plant (3,472 CAD) in 2007; and 993 aphids per plant (7,653 CAD) in 2008 (Fig. 2). A. glycines populations peaked in the second week of August in 2007 and the fourth week of August in 2006 and 2008 (Fig. 2).
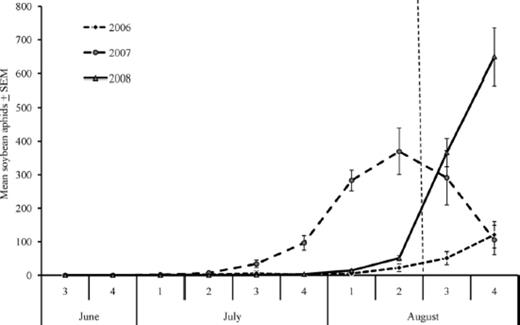
Mean number of soybean aphids per plant and week in 2006–2008. Only data before the third week of August (left of dashed vertical line) were included in statistical analyses due to insecticide application by growers after this time.
A total of 17,601 natural enemies (adult and immature) were collected, which included seven orders and 17 families for 2006–2008 (Table 1). For analyses we combined coccinellids into natives and exotics. Native coccinellids consisted of nine species (Table 1) and accounted for 36% of all coccinellids collected, whereas the remaining 64% consisted of two exotic coccinellids, H. axyridis, and C. septempunctata (Table 1). The ranking of natural enemy abundance by year was 2007 > 2008 > 2006 (Table 1). We used PCA to determine which natural enemies explained the greatest variability within the larger community and eight taxa were identified among the seven orders and 17 families. These taxa included O. insidiosus, Nabis spp., exotic coccinellids, native coccinellids, Chrysoperla spp., parasitic wasps, syrphids, and Araneae (N.P. Schmidt, unpublished data). We summarized the mean abundance of eight natural enemies collected in June, July, and August in 2006, 2007, and 2008 (Fig. 3 A–C). In 2006, parasitic wasps were most abundant in June, and Chrysoperla spp. in July and August (Fig. 3 A). In 2007, both parasitic wasps and syrphids were most abundant in June, syrphids in July, and Nabis spp. in August (Fig. 3 B). In 2008, syrphids were the most abundant natural enemy in June, July, and August (Fig. 3 C). Exotic coccinellids were most abundant in 2006 (Fig. 3 A) and declined in abundance in each subsequent year.
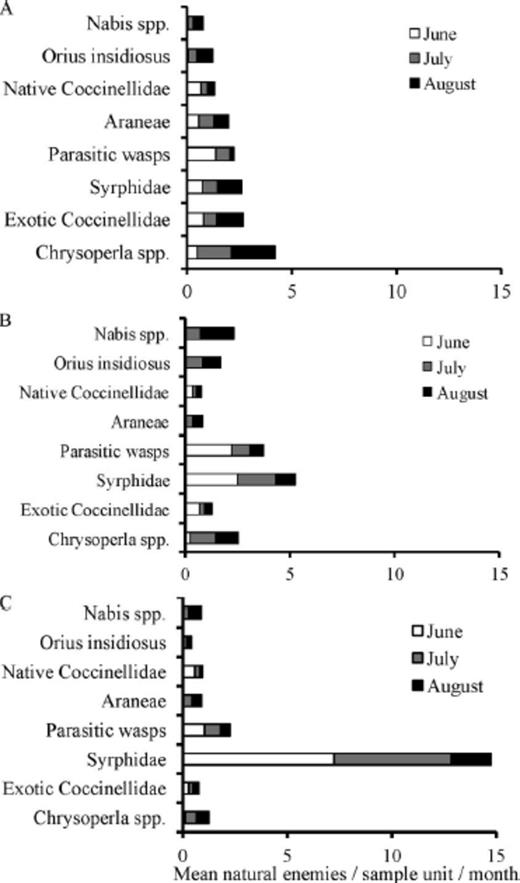
Mean natural enemies collected per sample unit (varied with taxon) and month in 2006 (A), 2007 (B), and 2008 (C).
Total natural enemies collected from Iowa soybean fields in 2006, 2007, and 2008
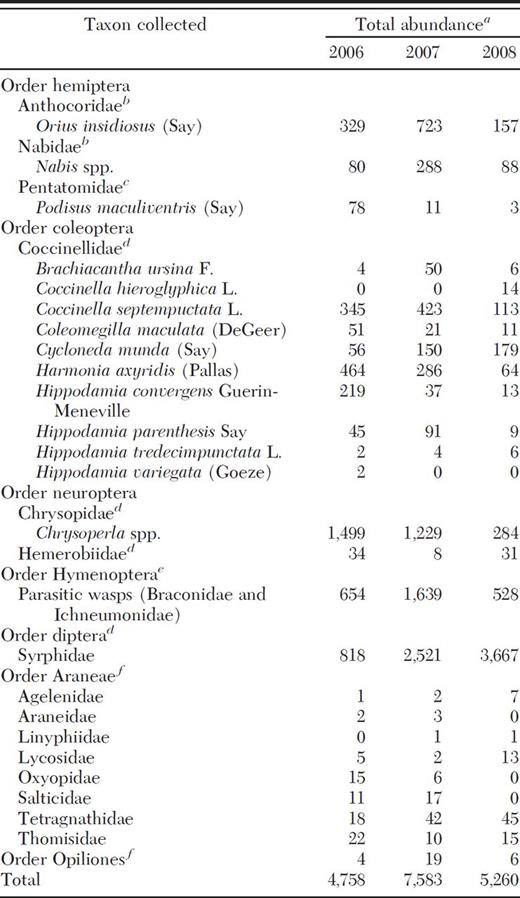
Direct comparisons between years cannot be made because the no- of fields varied between 2006, 2007, and 2008 (30, 36, and 34).
Adults and nymphs collected from field-counts.
Adults and nymphs collected from sweep-nets and field-counts.
Adults and larvae collected from yellow-sticky cards and field-counts.
Adults collected from yellow-sticky cards.
Adults and nymphs collected from sweep-nets.
Total natural enemies collected from Iowa soybean fields in 2006, 2007, and 2008
Direct comparisons between years cannot be made because the no- of fields varied between 2006, 2007, and 2008 (30, 36, and 34).
Adults and nymphs collected from field-counts.
Adults and nymphs collected from sweep-nets and field-counts.
Adults and larvae collected from yellow-sticky cards and field-counts.
Adults collected from yellow-sticky cards.
Adults and nymphs collected from sweep-nets.
Landscape Measurements.
Within our study site we observed a gradient of landscape complexity, ranging from simple (up to 95% arable, Simpson's D=0.56, and contagion=77.96) to complex (21% arable, Simpson's D=0.81, and contagion=37.86). Land cover around a given soybean field varied little among the 3 yr of this study (Fig. 4 A–C). Land cover did not substantially differ with increasing distances from study soybean fields, except areas within 0.5 km of study soybean fields tended to have lower amounts of soybean (Fig. 4 A–C). These soybean fields were typically surrounded by large quantities of grassland resulting in the reduced amount of soybeans at 0.5 km. The final MDS solution with two axes explained ≈90.2% of the variability in these data, and included 11 explanatory and nine response variables (Fig. 5). On both axes, year and plant nutrients (N, P, and K) explained the majority of the variability in both CAD and natural enemies (Table 2). Land cover variables explained a comparatively minor portion of the variation, and correlations with grassland land cover were especially low (Table 2).
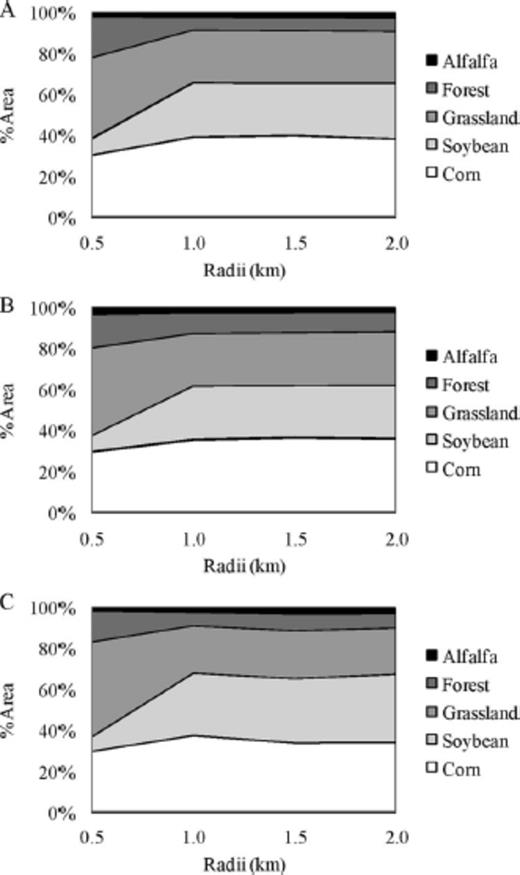
Type of land cover (%) at 0.5, 1.0, 1.5, and 2.0 km from the center of all soybean fields in 2006 (A), 2007 (B), and 2008 (C).
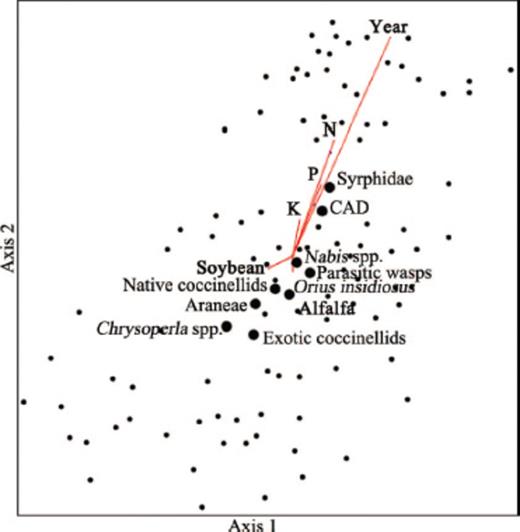
MDS analysis showing variation in A. glycines (CAD) and natural enemies among sites, variation and cluster among A. glycines (CAD) and natural enemies, and explanatory variables: year, plant nutrients, and landscape parameters. The length and direction of vectors indicates the strength and direction of the correlation, and only explanatory variables significant at P < 0.05 are shown. Axis one and two explained 23.2 and 64.8% of the variation in these data, respectively.
Pearson correlations of explanatory and response variables with multidimensional scaling axis 1 and 2, which explain 23.2 and 64.8% of the variation, respectively, and have 69.8% orthogonality
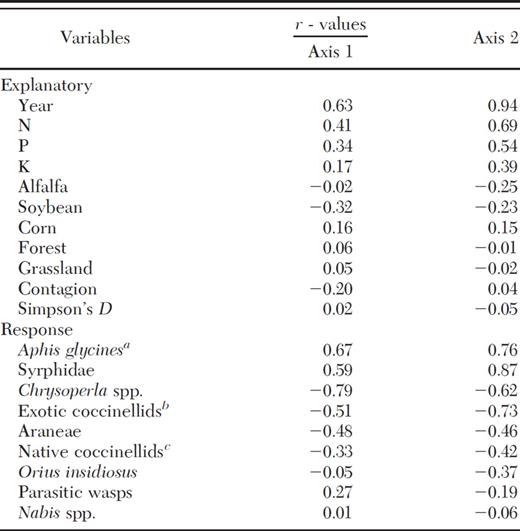
Cumulative aphid days ln(x + 1).
Harmonia axyridis and Coccinella septempunctata comprised 64% of all coccinellids collected.
Eight species of native coccinellids were collected and comprised 36% of all coccinellids collected.
Pearson correlations of explanatory and response variables with multidimensional scaling axis 1 and 2, which explain 23.2 and 64.8% of the variation, respectively, and have 69.8% orthogonality
Cumulative aphid days ln(x + 1).
Harmonia axyridis and Coccinella septempunctata comprised 64% of all coccinellids collected.
Eight species of native coccinellids were collected and comprised 36% of all coccinellids collected.
Model Comparisons.
All best-fit and competing models were significant at P < 0.01 (Table 3). For all response variables, we listed the explanatory variables from best-fit and competing models. Only the significantly correlated response and explanatory variables are described below.
Best-fit and competing models for A. glycines and natural enemy abundance in relation to landscape parameters for 2006–2008 significant at P < 0.01
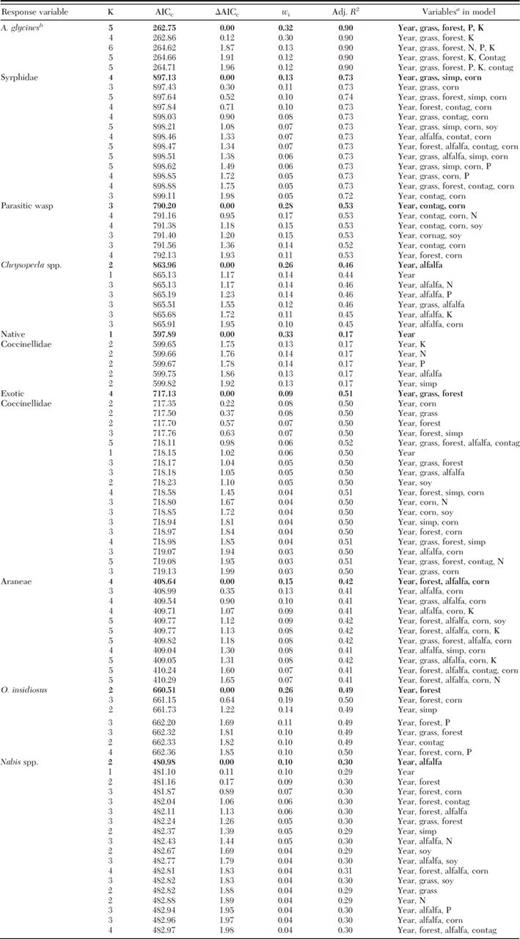
Bold indicates best-fit model. Competing models are any with ΔAICC < 2.
Variables abbreviated: Grass, grassland; Simp, Simpson's index (1-D); con tag, contagion; soy, soybean; N, soybean plant nitrogen; P, soybean plant phosphorus; and K, soybean plant potassium.
Cumulative aphid days ln(x + 1).
Best-fit and competing models for A. glycines and natural enemy abundance in relation to landscape parameters for 2006–2008 significant at P < 0.01
Bold indicates best-fit model. Competing models are any with ΔAICC < 2.
Variables abbreviated: Grass, grassland; Simp, Simpson's index (1-D); con tag, contagion; soy, soybean; N, soybean plant nitrogen; P, soybean plant phosphorus; and K, soybean plant potassium.
Cumulative aphid days ln(x + 1).
Cumulative aphid days were best predicted by year, grassland, forest, P, and K, and competing models included N and contagion (Table 3). CAD had a significant positive relationship with year (R2=0.87; F2,99=326.89; P < 0.0001), P (R2=0.35; F1,99=51.77; P < 0.001), and N (R2=0.30; F1,99=42.52; P < 0.001). Syrphids were best predicted by year, grassland, Simpson's D, and corn, and competing models included forest, contagion, soybean, alfalfa, and P (Table 3). Syrphids had a significant positive relationship with year (R2=0.67; F2,99=97.20; P < 0.0001), corn (R2=0.07; F1,99=6.94; P < 0.01), and P (R2=0.22; F1,99=27.62; P < 0.001), and a significant negative relationship with soybean (R2=0.05; F1,99=5.23; P=0.02) and alfalfa (R2=0.07; F1,99=6.87; P=0.01). Parasitic wasps were best predicted by year, contagion, and corn, and competing models included N, soybean, and forest (Table 3). Parasitic wasps had a significant positive relationship with corn (R2=0.05; F1,99=5.21; P=0.02) and N (R2=0.05; F1,99=5.57; P=0.02). Chrysoperla spp. were best predicted by year and alfalfa, and competing models included alfalfa, N, P, K, grassland, and corn (Table 3). Chrysoperla spp. had a significant positive relationship with soybean (R2=0.04; F1,99=4.00; P < 0.05), and a significant negative relationship with year (R2=0.45; F2,99=40.52; P < 0.0001), N (R2=0.20; F1,99=24.65; P < 0.001), P (R2=0.09; F1,99=10.18; P < 0.01), and K (R2=0.04; F1,99=4.42; P=0.04). Native coccinellids were best predicted by year, and competing models included N, P, K, alfalfa, and Simpson's D (Table 3). Native coccinellids had a significant negative relationship with year (R2=0.19; F2,99=11.35; P < 0.0001), N (R2=0.08; F1,99=8.08; P < 0.01), and P (R2=0.04; F1,99=4.57; P=0.04). Exotic coccinellids were best predicted by year, grassland, and forest, and competing models included corn, Simpson's D, alfalfa, contagion, soybean, and N (Table 3). Exotic coccinellids had a significant positive relationship with alfalfa (R2=0.04; F1,99=4.28; P=0.04), and a significant negative relationship with year (R2=0.50; F2,99=48.77; P < 0.0001) and N (R2=0.24; F1,99=30.72; P < 0.001). Araneae were best predicted by year, forest, alfalfa, and corn, and competing models included grassland, K, Simpson's D, and contagion (Table 3). Araneae had a significant positive relationship with forest (R2=0.10; F1,99=10.37; P < 0.01) and alfalfa (R2=0.24; F1,99=11.52; P < 0.001), and a significant negative relationship with year (R2=0.19; F2,99=22.41; P < 0.0001) and corn (R2=0.11; F1,99=17.39; P < 0.001). O. insidiosus were best predicted by year and forest, and competing models included Simpson's D, P, grassland, and contagion (Table 3). Orius insidiosus had a significant negative relationship with year (R2=0.09; F2,99=9.66; P < 0.01). Nabis spp. were best predicted by year and alfalfa, and competing models included forest, corn, contagion, grassland, Simpson's D, N, and P (Table 3). Nabis spp. had a significant positive relationship with alfalfa (R2=0.04; F1,99=3.87; P=0.05).
Relationship of Natural Enemies to Soybean Aphids.
To determine the relationship between A. glycines and natural enemies we tested the hypothesis that the rate of change in natural enemies did not vary with the abundance of aphids. We observed a linear relationship between A. glycines and natural enemies in each year of our study (Fig. 6). The equations for slopes were in 2006 y=0.0224x+0.3406, in 2007 y=0.0028x+0.3685, and 2008 y=−0.0084x+0.2592. Slopes between 2006 and 2007 were not significantly different (F1,21=0.23; P=0.64), whereas we observed significant difference in slopes between 2006 and 2008 (F1,21=9.4; P < 0.01) and 2007 and 2008 (F1,21=6.4; P=0.01). A greater positive slope in 2006 suggests that natural enemies exhibited a numerical response with increased A. glycines abundance, compared with 2007 and 2008 when slopes were closer to zero and negative respectively (Fig. 6).
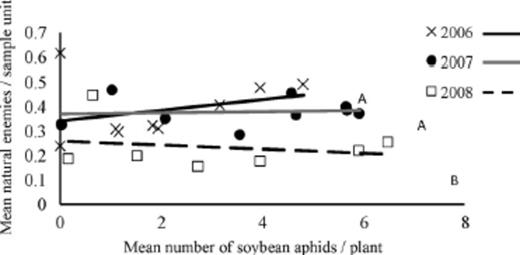
Relationship between A. glycines and natural enemies (averaged across seven taxa: O. insidiosus, Nabis spp., exotic coccinellids, native coccinellids, Chrysoperla spp., syrphids, and Araneae) in 2006–2008. Weekly aphid and natural enemy abundance data were transformed ln(x+1). Lines associated with the same letters do not have significantly different slopes (P > 0.05). Equations for slopes follow; 2006: y=0.0224x+0.3406; 2007: y=0.0028x+0.3685; and 2008: y=−0.0084x+0.2592.
Discussion
As stated in our initial hypothesis, we expected that soybean fields in landscapes with an abundance of grassland habitat would harbor an increased abundance of natural enemies and reduced abundance of A. glycines. However, our analyses suggest landscape composition, diversity, and contagion explained less of the variation in both response variables in comparison to year effects and plant macronutrient levels at our study site. Over the course of this 3-yr study, we found no significant correlation between the amount of grassland habitat within 2 km of soybean fields and A. glycines or natural enemies. Rather, most variation in abundance of A. glycines was explained by an effect of year and to a lesser extent by plant nutrients (N and P; Table 2). Similarly, variation in the abundance of eight natural enemy taxa was best explained by year, and to a lesser extent landscape composition and plant nutrients (Table 2).
A. glycines populations have been known to fluctuate across the north-central United States between years, with high populations typically observed in odd years and low populations in even years (Myers and Gratton 2006). In this study we observed low A. glycines populations in 2006 and high populations that exceeded the economic threshold (250 aphids per plant; Ragsdale et al. 2007) in 2007 and 2008. Natural enemies respond to an increased abundance of A. glycines in a density-dependent way (Donaldson et al. 2007, Schmidt et al. 2007). However, we found the response of natural enemies to A. glycines abundance decreased over time (Fig. 6). One likely explanation may be substantial variation in immigration rates of alate A. glycines experienced in Iowa during this study. In 2008, >3,500 alates were collected during August (Fig. 7). Captures of alate A. glycines in suction traps are positively associated with the abundance of A. glycines on soybean plants (Rhainds et al. 2010), although this relationship was only examined within 10 km of a suction trap. Assuming our study area received a greater immigration of alates in 2008 than in the previous 2 yr, such a rapid increase in prey population may have prevented us from observing a functional and/or numerical response of natural enemies to A. glycines during 2008 (Fig. 6). The source of immigrant A. glycines for our study site is not clear, but is not likely to be local. Each year we walked the perimeter of soybean fields comprising our study, in addition to woodlots in the NSNWR and local parks, and did not find Rhamnus cathartica L. (Rhamnaceae), the overwintering host of A. glycines.
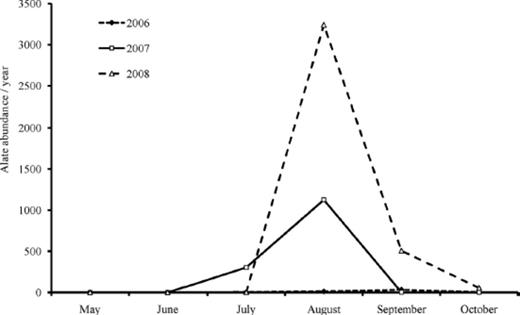
Alate A. glycines abundance from a suction trap located in Boone County, IA for 2006–2008. This was the nearest trap to our study sites (≈64 km north).
A second explanation for the decline in the response of natural enemies to A. glycines may be a reduction in their abundance, as we observed for several members of the natural enemy community in 2008 (Table 1; Fig. 3). The only member of this community whose abundance increased from 2007 to 2008 were adult syrphids, which accounted for 69.7% of this community in 2008 (Table 1). Syrphids are not predatory as adults, and their presence in soybean fields is likely due to immigration from other habitats in response to volatile cues from A. glycines and the honeydew they exude (Budenberg and Powell 1992). The abundance of most natural enemies collected in 2008 decreased. This pattern was especially true for several native and exotic coccinellids, O. insidiosus, and Chrysoperla spp., all of which were lower in abundance in 2008 than 2006 (Table 1; Fig. 3). The decline of these predatory taxa is of concern because many are a source of significant aphid mortality (Fox et al. 2004, Schmidt et al. 2007, Miao et al. 2007, Gardiner et al. 2009a).
Our results suggest that variability in the abundance of A. glycines was most affected by one or more unmeasured abiotic and/or biotic factors associated with year; year explained 87% of the variation in A. glycines and 19–67% of the variation in natural enemy abundance. Year-to-year variation in immigration rates of A. glycines provides one likely explanation, given the lack of overwintering sites in our study area. Other contributing factors may include increasing use of insecticide seed treatments, aerial application of foliar insecticides, area planted to corn, and weather.
In discussing soybean production practices with growers in our study area, we found that most seed planted in recent years was treated with an insecticide and use of foliar insecticide applications have increased in recent years. Generalist predators have been observed in soybean early in the growing season feeding on thrips or plants. Carnivorous species sometimes feed on plant tissue, and such zoophytophagy is commonly observed with O. insidiosus (Armer et al. 1998) and more recently H. axyridis and Coleomegilla maculata DeGeer (Moser et al. 2008). Moser and Obrycki (2009) found a significant reduction in H. axyridis larvae that fed on corn seedlings treated with neonicotinoids. In addition, extrapolating these findings to soybean agroecosystems may explain a portion of the decline in predators observed over the 3 yr of this study. Future research is needed to discern the effects of alate A. glycines immigration in soybean and the impacts of nontarget effects of seed treatments in soybean agroecosystems.
Landis et al. (2008) suggested that as a greater amount of corn is produced within a landscape, a decline in the biological control of A. glycines would be observed. This prediction was based on the observation by Gardiner et al. (2009a) where the biological control of A. glycines was affected by land use surrounding soybean fields, such that there was a decrease in this ecosystem service when the land around soybean fields was mostly composed of grasslands or corn. Gardiner et al. (2009b) found that forests provided the most suitable habitat for key natural enemies, specifically H. axyridis, of A. glycines. Over the course of our study, the amount of Iowa's corn acreage increased from 15.98 million ha in 2006 to 18.10 million ha in 2007, and decreased to 16.36 million ha in 2008 (USDA National Agricultural Statistics Service [NASS] 2010). The large increase of corn in 2007 may have contributed to the decline in natural enemies that we observed in 2008.
As expected, plant nutrients further explained the variation we observed in A. glycines abundance, as there is a documented relationship between plant nutrients and A. glycines population growth. Myers and Gratton (2006) found results similar to ours where peak A. glycines populations were positively correlated with N, P, and K, while aphid growth rates were negatively correlated with N, P, and K. In addition, Noma et al. (2010) found A. glycines populations were positively correlated with N, and negatively correlated with K. Increased nutrient levels in our study may be related to the employment of no-till or minimum tillage practices. Over an 8-yr study in south-central Texas, soil nutrients P and K, and extractable P and K, were in greater concentrations at depths of 0–0.05 m in no-till compared with conventionally tilled sorghum Sorghum bicolor (L.), wheat Triticum aestivum L., and soybean fields (Franzluebbers and Hons 1996).
Gardiner et al. (2009a) found increased biological control of A. glycines in more diverse landscapes that included forest and grassland. Furthermore, the abundance of native coccinellids was positively correlated with landscapes consisting of low-diversity and grassland, whereas the abundance of exotic coccinellids was correlated with forest (Gardiner et al. 2009b). In our study, native coccinellids were positively correlated by year and negatively correlated with plant N and P, whereas exotic coccinellids were positively correlated by year and alfalfa, and negatively correlated with plant N (Table 3). Compared with the effect of year, landscape metrics explained little variation in our natural enemy data, which conflicts with previous research. One explanation may be provided by Hodgson et al. (2009), who observed at the landscape level, habitat quality for the butterfly Plebejus argus L. (Lepidoptera: Lycaenidae) appeared less important when butterfly abundances were greater. Hodgson et al. (2009) suggest the varying levels of disturbance and succession in a landscape affected habitat quality and indirectly the ability to detect the abundance of P. argus.
The NSNWR was established in 1990 on former agricultural lands and managers add new prairie plantings each year. Management of the reconstructed grasslands at NSNWR consists of mowing and fire, which both disturb the landscape and alters succession. Plants found in prairies have been shown to be attractive to beneficial insects, including natural enemies of A. glycines (Fiedler and Landis 2009). We have assessed the plant community in NSNWR (Schmidt 2010) and found several species of the flowering forbs that are attractive to natural enemies: Aster laevis L., Ratibida pinnata (Vent.) Barnhart, Silphium perfoliatum (L.), Zizia aurea (L.) W.D.J. Koch. However, the simple presence of such plants may not be sufficient to improve the abundance or diversity of the natural enemy community; a threshold density of these plants may be needed to sustain natural enemy populations. Efforts to improve the biological control of A. glycines through habitat management may require a greater density of such plants than what is typically incorporated in traditional prairie restorations.
In summary, results suggest that grassland habitat in this study did not contribute to the biological control of A. glycines. In each subsequent year of this study, both the abundance and density of A. glycines immigrants in soybean increased. This increase may be due to a reduction in the top-down control of A. glycines in soybean agroecosystems; specifically, a reduction in the abundance of individual natural enemy taxa. Although not directly measured, this reduction may be; both a result of agricultural intensification (increased corn production and seed-applied insecticide). Future research should consider these insights to improve our understanding of A. glycines population dynamics.
We thank Mike Gannon of the Heartland City Coop.; all landowners who allowed us to collect data on their property; graduate students Kevin Johnson and Mike McCarville; and hourly workers Dustin Paulson, Daniel Stull, Robert Moore, Finn Pillsbury, Matt Maher, Nathan Johnson, and Andrew Thraenert, and Todd Hanson, Bonnie Jan, and Anna MacDonald for assistance with digitizing. David Voegtlin and Doris Lagos provide identification of aphids collected in the suction trap. This work was funded by the Leopold Center for Sustainable Agriculture (Title: The Impact of Biodiversity Services in Rowcrop Production in Annual versus Perennial Landscapes; Grant E2006-13). In addition, this journal paper of the Iowa Agriculture and Home Economics Experiment Station, Ames, IA, Project No. 5032, was supported by Hatch Act and State of Iowa funds.
References
