


Abstract
The relationship between habitat structural composition, presence of Ixodes scapularis Say (I. dammini Spielman, Clifford, Piesman, and Corwin), and the prevalence of Borrelia burgdorferi infection in small mammal populations was studied at 12 4-ha study sites selected within two perpendicular transects spanning New York State. Species-adjusted small mammal infection rates (SARs) were calculated to enable comparison of B. burgdorferi infection rates among sites with differing small mammal species composition and were used as the outcome variable in a predictive model. Sites with high SARs were characterized by lower overstory tree canopy height and basal area, increased understory coverage, substantial understory shrub coverage, decreased presence of surface water or saturated soil, high dominance values for I. scapularis, and higher tick burdens on small mammals. These differences were statistically significant from sites with moderate or low SAR values. Understory foliage height profiles were created for each study site, and significant differences in vegetation structural composition between high SAR sites and those with low or moderate SAR were documented. High SAR sites had increased density of herbaceous foliage at 0 and 25 cm, and higher shrub density at 0, 25, and 50 cm measurements above the ground, associated with I. scapularis questing success, and lower densities of sapling trees at 25, 50, and 75 cm. The structural composition of understory vegetation may dictate vector density and predict B. burgdorferi infection rates in small mammals in New York State.
New York State accounts for ≈30% of the national Lyme disease cases reported annually and has some of the highest county-level Lyme disease incidence rates in the United States (Centers for Disease Control 2004). The New York State Department of Health has documented the progressive expansion of the geographic range of Ixodes scapularis Say (I. dammini) (Oliver et al. 1993) from 22 counties in 1989 (White et al. 1991), to include 60 (of 62) counties by 1999 (Dennis et al. 1998; New York State Department of Health, unpublished data), during 15 yr of statewide passive tick surveillance. Although I. scapularis ticks and Lyme disease may currently be acquired throughout New York State (New York State Department of Health, unpublished data), the risk of acquiring Lyme disease is not uniform across the state (Glavanakov et al. 2001) because of geographic variation in I. scapularis population density and Borrelia burgdorferi prevalence in small mammal populations (White et al. 1991; J.O., unpublished data).
The ecological dynamic that exists between I. scapularis and the principal host of B. burgdorferi, the white-footed mouse (Peromyscus leucopus Rafinesque), has been the focus of numerous studies in the northeast (Piesman and Spielman 1979, Awerbuch and Spielman 1994, Goodwin et al. 2001, LoGiudice et al. 2003) and other regions of the United States (Walker et al. 1996, Clark et al. 2002). These studies sought to document the potential influence of factors including host movement, availability, species composition, general vegetation characteristics, and microclimate on the distribution of vector ticks or the prevalence of associated disease agents in local tick populations. Additionally, the habitat associations of I. scapularis have been described focally (Falco and Fish 1988, Maupin et al. 1991, Ostfeld et al. 1995), and its distribution extrapolated across large geographic areas using predictive models (Estrada-Peña 2001, Guerra et al. 2002). While previous research has documented information regarding these aspects of the enzootic cycle of B. burgdorferi and I. scapularis biology and may help assess potential for the local establishment of I. scapularis ticks, the impact of vegetation structure on B. burgdorferi infection prevalence in resident small mammal populations has not been examined.
The primary objective of this study was to use a quantitative forest survey to determine if a relationship existed among habitat characteristics, average tick burden on small mammals, dominance of I. scapularis feeding on small mammal hosts, and the prevalence of B. burgdorferi in small mammal populations at 12 sites distributed across New York. Additionally, our goal was to determine habitat characteristics associated with I. scapularis presence, leading to increased B. burgdorferi infection rates in resident small mammal populations, ultimately related to increased Lyme disease risk to residents of New York. This included a focused attempt to quantify structural properties of understory vegetation favorable to generating an effective tick-host interface, measured by both I. scapularis burden on, and B. burgdorferi infection prevalence in, resident small mammal populations.
Materials and Methods
Site Selection.
Twelve study sites were selected within two perpendicular transects (72 km wide) spanning New York, running south to north from the southern Hudson Valley to the Canadian border and east to west from the Massachusetts border to Lake Erie (Fig.). Sites were randomly selected along a geographic gradient in an effort to conduct long-term (3 yr) studies of I. scapularis populations and host mammal B. burgdorferi infection rates in geographic regions of New York considered endemic, emerging, and nonendemic for Lyme disease, including areas where these data were scarce or nonexistent. Sites selected met the following criteria: ≥4 ha contiguous upland forested area, accessible, appearing to have suitable habitat for small mammals, particularly Peromyscus spp., and ticks. After initial inspection, potential site locations not meeting these criteria, and those where long-term permission of use could not be granted, were excluded. The resulting 12 trapping locations were spaced roughly equidistant within the two transects. The average distance between adjacent study sites was ≈95 km. Most sites were located on state-owned land such as wildlife management areas and parks. Two sites were established on private property with permission.

Small mammal trapping and habitat survey sites in two perpendicular transects in New York.
Mammal Collection.
Small mammal trapping occurred monthly from May through October during each of 3 consecutive yr (1998-2000). Two hundred Kness-E snap traps (Kness Manufacturing, Albia, IA) baited with either peanuts or peanut butter were set at each site overnight or during two consecutive nights with 100 traps each night. Site visits were rotational, with the goal that each site would be trapped once monthly, with ~4-wk intervals between trapping sessions. Traps were set during the 3 h preceding dusk, at nominal 5-m intervals in irregular transects throughout each 4-ha site, and retrieved early the following morning. Transect locations were altered within the sites each trapping event to minimize potential deleterious effects of removal sampling. Trap locations were marked with wire flags or survey tape and numbered sequentially to ensure all traps were retrieved. Trapped mammals were placed individually (including trap) in sealed plastic bags and chilled on wet ice until delivered to a New York State Department of Health laboratory, where they were processed immediately in a biosafety cabinet with laminar airflow or stored individually at -80°C until processing. Processed animal carcasses were archived in individually numbered, sealable bags and stored at -20°C. The New York State Institutional Animal Care and Use Committee (97-275) and Centers for Disease Control approved the New York State Department of Health animal welfare protocol for small mammal trapping during the course of this study.
Ectoparasites were removed from captured small mammals, identified, and preserved in 80% ethanol. Any ticks that had detached from animals during transport to the laboratory were collected from the inner surface of the individual sealed plastic bag and were included in the assessment of tick burden for that animal. Mammals were screened for the presence of B. burgdorferi by targeting the OspA gene by polymerase chain reaction (PCR) of ear tissue biopsy; this was confirmed by Southern blotting hybridization analysis (Chu 1998).
Host-Seeking Tick Collection.
Sites were sampled monthly for the presence of host-seeking ticks using a 1-m2 piece of white felt or canvas during dragging, flagging, and walking surveys (Ginsberg and Ewing 1989b). Sampling was conducted during favorable weather conditions by a two-person team throughout each 4-ha site, including along deer trails (present at all sites), for 30 min. All collections were preformed between 1100 and 1530 hours or before setting mammal traps (May to October). The cloth was checked approximately every 2 min for ticks. Ticks were removed with foreceps and placed in a 50-ml plastic screw capped vial with a Kimwipe (Kimberly-Clark Worldwide, Roswell, GA) moistened with distilled water for transport to the laboratory for identification. Collections were not conducted when vegetation was wet, snow was present, air temperature fell below 6°C, or when winds exceeded 10 km/h.
Forest Survey.
Forest surveys were conducted at the end of the 2000 growing season to determine the general forest type and structure of each 4-ha site. GPS coordinates and elevation points were taken (eTrex Summit, model #010-00212-00; Garmin, Olathe, KS) and confirmed using United States Geological Survey 1:24,000 topographic maps. A 13% area sample was taken at each site with 26 circular 0.02-ha plots, equally spaced along transect lines using compass and pacing methods. Vegetation was classified as follows: overstory, canopy trees having a diameter at breast-height (DBH) >15.2 cm; intermediate, trees with a DBH ≤15.2 cm but >3.1 m in height; understory, trees ≤3.1 m in height, shrubs, ferns, and herbaceous forbs/grasses. A Biltmore stick was used to estimate DBH to the nearest 5-cm-diameter class (Savage et al. 1996), and a clinometer was used to measure tree height to the nearest 3-m interval (Bonham 1989). All vegetation within plot boundaries was identified using taxonomic keys of Symonds (1958), Peterson and McKenny (1968), and Mitchell and Danaher (1998). Intermediate trees were recorded by the number of individuals per plot in range classes as follows: 1-5, 6-15, 16-30, 31-60, 61-100, or >100. The total understory vegetation was estimated as covering 1-5, 6-15, 16-30, 31-60, or 61-100% of each plot (Kirkman et al. 2000). The coverage of each understory species was estimated as a proportion of the total groundcover. Understory plants were grouped into the following structural classes: shrub, sapling tree, fern, and herbaceous forb/grass. Understory species coverage estimates were totaled by structural class. The percent of ground covered by rocks, logs, twigs, and water (standing water, swamps, bogs, streams, creeks, natural springs, saturated soil, etc.) was visually estimated for each plot. To avoid potential sampling biases, forest surveys at all sites were conducted by the same two-person team. Based on vegetation species composition and community structure documented by the forest surveys, the sites were typed according to the terrestrial community system described by Reschke (1990) and Edinger et al. (2002).
Stratification Sampling.
At the end of the 2001 growing season, a modified line-intercept sampling scheme was conducted to create a foliage height profile (MacArthur and Horn 1969) of the understory vegetation at each site. Species and structural class (shrub, sapling tree, fern, and herbaceous forb/grass) of all live plants intersecting a 1-m chain at each of five height intervals (0, 25, 50, and 75 cm and 1 m) were recorded at 25 sample points, equally spaced along five 200-m transects using compass and pacing methods. Height intervals were selected to obtain a detailed picture of the structural stratification of the understory vegetation and correspond to the minimum and maximum reported questing height of I. scapularis ticks (Goddard 1992, Sonenshine 1993). Measurements were taken along north-south and east-west orientations at each point, for a site total of 50 sampling attempts at each height interval. Clonal plants intersecting more than once within each chain section were documented as multiple hits at heights from 25 cm to 1 m. Only living groundcover plant material was included at the 0-cm height level.
Data Analysis.
Where X represents the total number of vegetation hits of cover type c at height level i for stratification survey plots (n = 1, … , 25), and N represents the total number of stratification plots in which the vegetation type occurred.
Where N is the total number of ticks of all species collected from small mammals at a given site, and n is the total number of I. scapularis collected from small mammals at same site. Only mammal and tick specimens that could be identified to species, and mammals having conclusive B. burgdorferi test results were included in our calculations.
Where i is the index of sites (i = 1, … , 12) and j is the index of species (j = 1, … , 14); inf ij and cap ij are the number of infected and total mammals, respectively, of jth species captured at site i; popj is the number of mammals of jth species captured across all the study sites. Site B. burgdorferi rates were categorized as high (SAR ≥ 2), moderate (0.5 < SAR < 2), or low (SAR ≤ 0.5).
Two-sample, two-tailed t-tests were used to compare values for habitat variables between sites classified with high SARs and those with moderate or low SARs. Spearman rank correlation (Zar 1999) was used to measure relations between SAR and habitat variables, as well as relations of paired habitat variables. Vegetation variables with a P < 0.1 relative to SAR were selected for further analysis. Principle component analysis (PCA), based on a correlation matrix of those selected vegetation variables, was used for representing vegetation features in a given area more efficiently (Hatcher 1994, McGarigal et al. 2000). Varimax rotation with Kaiser normalization was used to achieve more interpretable results from the initial components. The number of vegetation variables was reduced. Backward multiple regression analysis was conducted to further reduce the results of the PCA to the principal components considered to be the best predictors of the SAR for a given site. All statistical analyses were performed using the SAS statistical program package (SAS Institute 2004).
Results
Small Mammals and Ticks.
Of the 3,497 small mammals trapped, 3,179 were identified to species and used in our determination of small mammal diversity (H'), which ranged from 0.39 at the Dutchess County study site to 1.66 at our site in Essex County (Table 1). We excluded data from 318 mammals rendered unidentifiable to species or unsuitable for PCR testing because of predation. Fourteen mammal species were collected. The most abundant small mammals captured at all sites were Peromyscus spp., comprising 63% of total mammals captured. Blarina brevicauda Say (22%) was the second most commonly encountered species at all sites except Columbia County, where Clethrionomys gapperi Vigors (7%) was more abundant. Other small mammal species captured (8%) included the following: Napaeozapus insignis Miller (n = 104), Sorex cinereus Kerr (n = 43), Tamias striatus (n = 35), Microtus pinetorum LeConte (n = 22), M. pennsylvanicus Ord (n = 19), Zapus hudsonius Zimmerman (n = 17), S. fumeus Miller (n = 7), Glaucomys volans (n = 7), G. sabrinus Shaw (n = 1), and Tamiasciurus hudsonicus Erxleben (n = 1).
B. burgdorferi infection rates, I. scapularis burden and dominance, mean ± SD values for select habitat measurements, and significance results of comparison by two-tailed t-test of select site characteristics at high SAR sites with those at moderate or low SAR site classifications a

N = 12.
P < 0.05.
P < 0.01
P <0.0001 for comparison between sites with high SARs and those with low or moderate SARs.
B. burgdorferi infection rates, I. scapularis burden and dominance, mean ± SD values for select habitat measurements, and significance results of comparison by two-tailed t-test of select site characteristics at high SAR sites with those at moderate or low SAR site classifications a
N = 12.
P < 0.05.
P < 0.01
P <0.0001 for comparison between sites with high SARs and those with low or moderate SARs.
Conclusive PCR test results for the detection of B. burgdorferi by PCR of ear tissue biopsy were obtained from >99% (n = 3,163) of the specimens collected. Crude B. burgdorferi infection rates in small mammals ranged from 0 to 23%, with corresponding species-adjusted SARs ranging from 0.01 to 3.09 (Table 1). No significant relationship was detected between H' of small mammals and crude B. burgdorferi infection rates (r = -0.08, P = 0.79), or percent infected Peromyscus spp. (r = -0.15, P = 0.63). Sites with high SARs did not show a significant difference in average H' compared with sites with moderate or low SARs (t = -1.42, df = 3, P = 0.25). There was a significant positive correlation between H' and average tree diameter (r = 0.63, P < 0.02), percent log coverage (r = 0.62, P < 0.05), and estimated sapling tree coverage (r = 0.58, P < 0.05). However, H' was negatively correlated with estimated shrub coverage (r = -0.72, P < 0.01).
There were six species of ticks (n = 1,982) removed from 11 species of small mammals (n = 397) obtained from 11 of 12 study sites. Ticks removed from mammal hosts that could not be identified to species because of predation (n = 22) were excluded from our analysis (n = 91). I. scapularis was the most frequent species obtained from small mammals (1,800 larvae, 89 nymphs, 1 adult) and accounted for 95% of the ticks. Other tick species removed from mammals included the following: Dermacentor variabilis (43 larvae, 9 nymphs), Ixodes angustus (9 larvae, 15 nymphs, 1 adult), I. cookei (7 larvae), I. muris (4 larvae, 2 adults), and I. marxi (2 adults). I. scapularis ticks were collected from nine mammal species in five counties (Table 2), May through October, with the majority (n = 862) obtained from animals captured in October. Average I. scapularis burdens ranged from a high of eight ticks per animal at the Rensselaer County site to one per animal at the sites in Columbia and Seneca counties (Table 1). Simpson's index of dominance (SID) values for I. scapularis ranged from 0 to 1.0 for all sites, and from 0.43 to 1.0 at sites where I. scapularis >1 were present (n = 4; Table 1). High SAR sites had significantly higher tick burdens (t = 4.30, df = 2, P < 0.05) and higher SID values for I. scapularis (t = 19.12, df = 9, P < 0.0001) than those found at low or moderate SAR sites (Table 1). There was a significant positive correlation between both average tick burden and SID values for I. scapularis and several habitat variables including vegetation density at 25 cm, average understory shrub coverage, shrub density at all height levels (0, 25, 50, and 75 cm, 1 m, and cumulative), and fern density at 25 cm (Table 3). Average percent surface water or saturated soil, total vegetation hits at 75 cm, average understory tree coverage, and sapling tree density at 25 (r = -0.58, P < 0.05 and r = 0.57, P < 0.05) and 75 cm (r = -0.72, P < 0.01 and r = -0.72, P < 0.01) had a negative relationship to I. scapularis SID values and average tick burdens (Table 3). Both average small mammal tick burden and SID values for I. scapularis were strongly correlated with SAR (r = 0.78, P < 0.002 and r = 0.79, P < 0.002, respectively; Table 3.
I. scapularis removed from small mammals by life stage, mammal species, and county, 1998-2000a

Does not include one female I. scapularis removed from one Peromyscus spp. (Dutchess County).
Total no. of ticks/total no. of animals.
Peromyscus leucopus and/or P. maniculatus.
I. scapularis removed from small mammals by life stage, mammal species, and county, 1998-2000a
Does not include one female I. scapularis removed from one Peromyscus spp. (Dutchess County).
Total no. of ticks/total no. of animals.
Peromyscus leucopus and/or P. maniculatus.
Spearman rank correlation coefficients for J. scapuluris SID values, select habitat measurements, and SARs for combined data at 12 study sites a

N = 12.
DENshrub.
DENfern.
P < 0.1.
P < 0.05.
P < 0.005.
P < 0.0001.
Spearman rank correlation coefficients for J. scapuluris SID values, select habitat measurements, and SARs for combined data at 12 study sites a
N = 12.
DENshrub.
DENfern.
P < 0.1.
P < 0.05.
P < 0.005.
P < 0.0001.
Host-seeking Ticks.
Flagging, dragging, and walking surveys for questing ticks at the 12 study sites resulted in a total of 864 I. scapularis ticks collected from four sites. No other tick species were encountered. Larvae, nymphs, and adults were collected from the Dutchess County site (40 larvae, 7 nymphs, and 72 adults), whereas nymphs and adults were collected from the sites in Rensselaer (20 nymphs, 135 adults) and Albany counties (17 nymphs, 572 adults). One female I. scapularis was collected from the Columbia County study site. More than 90% of host-seeking I. scapularis collected were adults, obtained during the months of October and November (55%) and March and April (32%). Adult ticks were also collected in May (n = 59), December (n = 26), June (n = 14), and January (n = 4). Host-seeking I. scapularis nymphs were primarily found during the months of May and June (98%). One I. scapularis nymph from the Rensselaer County site and all I. scapularis larvae were collected during September.
Forest Survey.
The locations and forest classifications of the 12 sites are outlined in Table 4. High SAR sites were characterized by lower average canopy height and basal area (t = -4.82, df = 109, P < 0.0001 and t = -5.70, df = 188, P < 0.0001, respectively), with a corresponding increase in understory coverage (t = 4.67, df = 162, P < 0.0001) and understory shrub coverage (t = 9.76, df = 105, P < 0.0001; Table 1). Sites with the low/moderate SAR values had minimal shrub coverage and typically had an understory dominated by ferns and sapling trees (t = -4.03, df = 191, P < 0.0001 and t = -8.47, df = 229, P < 0.0001, respectively; Table 1). These sites also had significantly more surface water or saturated soil present (t = -5.57, df = 234, P < 0.0001; Table 1). The average estimated percent surface water coverage was significantly negatively related to SARs (r = -0.82, P < 0.001), whereas the positive relationship between SARs and visually estimated understory shrub coverage was marginally significant (r = 0.42, P < 0.1; Table 3).
Study site descriptions

New York State Department of Environmental Conservation, New York Natural Heritage Program classification based on forest survey data.
Study site descriptions
New York State Department of Environmental Conservation, New York Natural Heritage Program classification based on forest survey data.
Stratification Survey.
Sites with high SARs had significantly higher shrub densities at 0 (t = 4.24, df = 137, P < 0.0001), 25 (t = 4.36, df = 132, P < 0.0001), and 50 cm (t = 2.01, df = 161, P < 0.05). They also had higher densities of herbaceous foliage at 0 (t = 3.18, df = 149, P < 0.002) and 25 cm (t = 2.07, df = 134, P < 0.05), with significantly lower densities of sapling trees at 25 (t = -2.47, df = 153, P < 0.02), 50 (t = -3.98, df = 215, P < 0.0001), and 75 cm (t = -5.89, df = 202, P < 0.0001). Statistically significant relationships between shrub density at all heights and SAR were observed (Table 3). The 0- (r = 0.56, P < 0.05) and 50-cm (r = 0.58, P < 0.05) height levels were of particular importance, as well as overall shrub density (r = 0.71, P < 0.01), having the most significant impact on SARs. Increased sapling tree density at 75 cm (r = -0.45, P < 0.1) had a marginally significant negative impact on SAR (Table 3).
Modeling.
Spearman rank correlations between habitat variables and SAR produced a group of 13 significant (P < 0.1) variables (Table 5). PCA, based on a correlation matrix of the 12 selected vegetation variables, and varimax rotation with Kaiser normalization reduced the vegetation variables to four principal components: shrub factor, fern factor, tree factor, and water factor (Tables 5 and 6). By backward multiple regression analysis, three principal components (shrub, tree, and water) were further included as the best predictors of the rate of B. burgdorferi infection in small mammals at a given site, accounting for 87.3% of the total variance in these data (P < 0.0001; Table 7).
Rotated and normalized factor pattern results of PCA of selected habitat and vegetation structural variables
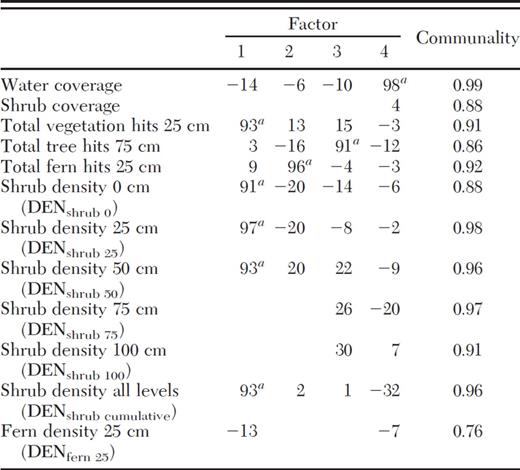
Variables loading on corresponding factors.
Rotated and normalized factor pattern results of PCA of selected habitat and vegetation structural variables
Variables loading on corresponding factors.
Properties of factors resulting from PCA analysis and species-adjusted B. burgdorferi infection rates in small nianunals

Properties of factors resulting from PCA analysis and species-adjusted B. burgdorferi infection rates in small nianunals
Regression analysis of factors resulting from PCA and species-adjusted B. burgdorferi infection rates (SARs) in small mammals

Shrub, percent shrub coverage and DENshrub; fern, total fern hits at 25 cm and DENfern25; tree, total tree hits at 75 cm; water, percent water coverage.
Regression analysis of factors resulting from PCA and species-adjusted B. burgdorferi infection rates (SARs) in small mammals
Shrub, percent shrub coverage and DENshrub; fern, total fern hits at 25 cm and DENfern25; tree, total tree hits at 75 cm; water, percent water coverage.
Discussion
The results of this study indicate that habitat structural characteristics play a key role in the vector ecology of Lyme disease in New York and may serve as an indicator for I. scapularis establishment and subsequent B. burgdorferi infection rates in resident small mammals. Study sites with high B. burgdorferi infection rates in small mammals, resulting from established I. scapularis populations, exhibited significant differences in habitat structural composition compared with sites with low or moderate B. burgdorferi infection rates in small mammal hosts. These differences likely impact several aspects of the enzootic cycle of B. burgdorferi, potentially influencing tick survival and reproductive success as well as host density and diversity.
In our study, we found that sites with a dense, shrubby understory had significantly higher tick densities, reflected by elevated burdens on small mammals (Schmidt et al. 1999). These findings are agreeable with those of previous research (Ginsberg and Ewing 1989a, Adler et al. 1992, Goddard 1992, Lubelczyk et al. 2004). We also documented established I. scapularis populations through collection surveys and the presence of immature ticks on small mammals and found I. scapularis SID values to be highest at sites where the understory was dominated by dense shrubs. The vegetation stratification component of our study took this analysis a step further, documenting a strong relationship between shrub density at specific height levels (0, 25, and 50 cm) and each of the following: increased tick burdens, I. scapularis dominance, and B. burgdorferi infection rates in resident small mammals. Dense understory coverage contributes to a stable microclimate and increased relative humidity at ground level, likely enhancing tick survival (Stafford 1994, Lindsay et al. 1999). Although we did not take leaf litter measurements in this study, the importance of litter in contributing to a suitable microclimate for I. scapularis immatures has been well documented (Schultze et al. 1995,2002, Ostfeld et al. 1995, Lindsay et al. 1999, Lubelczyk et al. 2004) and may be enhanced by the climate-buffering effect of shrubby vegetation. High shrub coverage may also reduce tick predation by ground dwelling birds and provide harborage from mammalian and avian predators for rodents carrying ticks, further concentrating ticks in shrub-dominated areas.
Understory vegetation has a documented impact on small mammal populations, dictating the distribution and density of many species in forest ecosystems (Burt 1957, Brooks and Doyle 2001, McShea et al. 2002). Increased density of woody understory vegetation has been significantly related to decreased small mammal species diversity and increased Peromyscus density (Myton 1974, Adler and Wilson 1987). In our study, we also found small mammal diversity, as reflected by H', was significantly negatively impacted by increasing shrub coverage, with the lowest diversity encountered at our Dutchess County site. However, we did not detect a significant relationship between H' and B. burgdorferi prevalence in small mammals. Of the seven sites found to have higher levels of small mammal species diversity (H' > 1), three sites (Columbia, Albany, and Otsego) showed moderate or high prevalence of B. burgdorferi infection in resident mammals. It is important to note that Peromyscus spp. and B. brevicauda, encountered in abundance at all study sites, comprised 85% of total small mammals captured during our study, and may have influenced H' values if they were more likely to be captured by the Kness snap traps. Alternate hosts of I. scapularis, such as birds, were not included in our H' diversity calculations and may impact the applicability of our findings to regions where these or other host animals play a more significant role in the enzootic cycle of B. burgdorferi.
We selected a lethal trapping method despite the potential depletion of small mammals at collection sites over the course of our 3-yr study. The New York State Institutional Animal Care and Use Committee (97-275) and Centers for Disease Control approved the New York State Department of Health animal welfare protocol for small mammal trapping during the course of this study and favored a lethal trapping method. Hantavirus infection is documented in resident New York small mammal populations, and locally acquired cases of hantavirus pulmonary syndrome (HPS) had occurred in recent history (White et al. 1996). Snap-trapping enabled staff to safely transport captured animals in sealed plastic bags to the laboratory for processing in a biosafety cabinet, avoiding the use of cumbersome positive air purifying respirator (PAPR) units and complicated logistics of field processing small mammals (Mills et al. 1995a,b). By trapping relatively large, forested sites (>4 ha), setting traps with an approximate capture rate of only 11% (N. P. unpublished data), altering the locations of transects each trapping session, and visiting sites at ≥4 wk intervals, our captures most likely did not exceed recruitment (through births and immigration) to the resident small mammal populations, particularly when one takes into consideration the short gestation periods (typically ≤20 d), large litter sizes, and relatively small, commonly overlapping, home ranges of the mammal species involved (Asdell 1946, Bourliere 1956, Burt 1957).
Understory vegetation provides the physical interface between ticks and small mammal hosts. In our study, sites with the highest proportion of understory shrub coverage supported mammals with the highest tick burdens. Adler et al. (1992) also found that I. scapularis larval density on P. leucopus was strongly associated with woody vegetation and that average mouse larval and nymphal burdens were highest in study plots dominated by shrubs. Although we detected significant relationships between shrub density at all height levels (0, 25, 50, and 75 cm and 1 m) and SID values for I. scapularis, sites with higher tick burdens and species-adjusted SARs in small mammals had significant differences in the density of shrubs at the 0-, 25-, and 50-cm levels only. This indicates that increased vegetation density at the lowest understory strata may foster increased small mammal-tick contact. Our findings identified vegetation structure at sites in three counties (Albany, Dutchess, and Rensselaer) of the 12 sites surveyed to be highly suited for effective tick-host interactions, because of higher vegetation densities at 0 and 25 cm. We concluded that increased shrub and herbaceous vegetation density at key heights for immature I. scapularis questing and survival (Sonenshine 1993, Schultze and Jordan 2005) resulted in a greater probability of tick-host interactions, increasing I. scapularis burdens, and leading to higher B. burgdorferi infection rates in small mammals, thus characterizing high Lyme disease risk habitat.
Of the sites found to have moderate B. burgdorferi prevalence in small mammals (Columbia and Otsego), we found evidence of an established population of I. scapularis at the Columbia County site only. Regardless, it is likely these counties represent a northward shift in the geographic range of broadly established I. scapularis populations and subsequent advance of the Lyme disease front, as incidence rates in the northern Hudson Valley and Capital District regions of New York have been on the rise in recent years. In 2001, Columbia County claimed the highest Lyme disease incidence rate in the nation of 1,025.5 per 100,000 population (Centers for Disease Control 2004). The neighboring counties of Greene, Albany, and Rensselaer experienced 4.3-, 2.7-, and 13.1-fold increases, respectively, in Lyme disease incidence rates from 1998 to 2001 (New York State Department of Health, unpublished data).
The habitat structure of the sites in the remaining seven counties (Clinton, Essex, Saratoga, Onondaga, Seneca, Livingston, and Erie) was sufficient to support small mammals (cumulative 61% of total mammal captures), but may not currently support adequate tick-host interactions or have a suitable microclimate for successful I. scapularis establishment. These sites had increased sapling tree density at the 75-cm-height level, which had a significantly negative relationship to I. scapularis burden and SAR in small mammals. The decrease in light penetration to lower strata caused by sapling trees at the 75-cm-height interval likely inhibits the growth of photophilic shrub species abundant at high SAR sites: Lonicera spp., Rosa multiflora L., and Vaccinium spp. (Richburg et al. 2001), at height levels potentially influential to tick survival and reproductive success (0, 25, and 50 cm). Additionally, the stems of sapling trees are structurally less complex and may prove to be a less suitable questing substrate for immature ticks compared with other types of vegetation. When immature ticks use herbaceous plants and shrubs for questing, transpiration from the surrounding leaves may aid in maintaining a favorable microclimate, minimizing desiccation (Lindsay et al. 1999). Sapling trees have far less leaves at the ground level and 25- and 50-cm-height levels; thus, areas with a sapling tree-dominated understory may prove less hospitable to I. scapularis immatures because of increased saturation deficit (Schultze and Jordan 2005) and lack of available questing substrate.
We also found that sites with low B. burgdorferi prevalence in small mammals, I. scapularis burdens on mammals, and I. scapularis dominance values had significantly more ground covered by surface water. Saturated soil and inundated leaf litter may not be conducive to I. scapularis establishment, because surface level pore space is filled by water, with a likely reduction in suitable molting and overwintering sites. A positive relationship between I. scapularis presence and sandy, well-drained soil has been documented in previous studies (Kitron et al. 1992, Glass et al. 1994). Additionally, several shrew species favor habitats with vernal ponds, intermittent streams, saturated soil, and significant fern coverage (Burt 1957, McShea et al. 2002), whereas Peromyscus spp. prefer shrubby habitats and better drained soils (Adler et al. 1992). More than 92% of I. scapularis removed from small mammals were collected from Peromyscus spp., with tick burdens highest in this species, indicating increased tick-mouse contact or possibly preferential host selection on the part of I. scapularis immatures (Schmidt et al. 1999). However, in our study, it is important to note that the most abundant small mammal species captured at all sites, including those with the highest percent of surface water coverage, were Peromyscus spp, and mammal collections at sites with low SAR classifications (n = 7) yielded 59% of the total Peromyscus spp. captured. These data point to the likelihood that unsuitable microclimate for ticks or reduced tick-mammal contact, and not lack of reservoir competent hosts, limits B. burgdorferi prevalence in small mammals at these sites.
Forest structure is dynamic as a result of natural succession and disturbances, alternately creating suitable and unsuitable tick and mammal habitats over time. Regardless of geographic location within the range of I. scapularis, areas with habitat structural composition similar to those sites found in our study to have increased B. burgdorferi SAR in small mammals should be considered to pose a potential risk of exposure to B. burgdorferi-infected ticks. Counties with elevated Lyme disease incidence rates per 100,000 population in New York for 2001, Columbia (1,025.5), Dutchess (400.1), Rensselaer (57.7), and Albany (22.4) (New York State Department of Health, unpublished data), correspond to the locations of sites found in our study to have high or moderate B. burgdorferi rates in small mammals and established I. scapularis populations. The statewide distribution of I. scapularis ticks in New York is not uniform, particularly in areas where this species is not yet widely established (New York State Department of Health, unpublished data), and is likely limited by the suitability of microhabitat for tick survival and reproduction. Areas with similar habitat qualities to those found to foster I. scapularis and B. burgdorferi-infected mammals at our study sites may serve as potential colonization sites for ticks as the geographic range of I. scapularis expands, increasing prevalence of B. burgdorferi infection in reservoir hosts, and subsequently the risk of acquiring Lyme disease for New York residents beyond historically endemic regions. A single I. scapularis larvae removed from a mouse in Seneca County, located in the westcentral region of New York, shows the potential for tick establishment that would inevitably lead to an increase in resident mammal B. burgdorferi infection. It is important to note that B. burgdorferi-infected mammals were collected from all 12 study sites, and if I. scapularis populations become widely established in all regions of the state, the central, northern, and western portions of New York will likely experience a corresponding rise in locally acquired Lyme disease cases similar to that documented in the historically endemic lower Hudson Valley region.
Although our sites were distributed across New York, our study was limited by a relatively small number of sites. We collected ticks and small mammals from a variety of forest types, basing our analysis on structural elements of vegetation to enable comparison between widely distributed study sites. Further research could determine whether our findings are applicable on a broader scale, test the validity of our predictive model, or explore potential influences of plant species composition at the site level. Using structural composition of understory vegetation as an indicator of B. burgdorferi infection in small mammals is, to the best of our knowledge, a new approach. The relationship between understory structure and small mammal infection rates is not a direct relationship but may prove to be a helpful indicator of Lyme disease risk at the local level in New York.
Tick burdens in our study were considered to be minimum infestation numbers, because ticks could have detached from cooling mammal carcasses before trap retrieval. However, tick density estimates based exclusively on drag sampling may be confounded by the presence of dense, woody vegetation (Schultze and Jordan 2001), with likely underestimation of density of I. scapularis immatures (Ginsberg and Ewing 1989b, Schultze et al. 1997). We believe this may have occurred at our sites in Dutchess and Albany counties, where high understory coverage with dense shrub cover, including lowbush blueberry (Vaccinium pallidum) thickets, may have prevented access to the drag by nymphal ticks. Average tick burdens and B. burgdorferi infection rates in small mammal hosts may better reflect the density of questing immature ticks (Schmidt et al. 1999), and more specifically, the rate of successful tick-host interactions when comparing sites with similar mammal densities and species composition, as was the case in our study. Our results emphasize the importance of the relationship between preferred small mammal habitat (food resources and shelter from predators) and ideal tick habitat (suitable microclimate, questing substrate, and host availability). These findings may enable future assessment of forested residential and recreational areas across New York for ideal I. scapularis and B. burgdorferi-infected mammal habitat and aid in the development of appropriate intervention strategies.
The authors thank L. Miller, the New York State Department of Environmental Conservation, the Seneca Nation, and the Seneca Nation Department of Health for granting the use of lands to conduct this research. We acknowledge the testing efforts of F. Chu, A. Reddy, and L. Lee. The authors also thank the following individuals for assistance in collecting and processing mammals for testing and for assistance with data entry: B. Ingersol, M. Martin, N. Pardanani, and R. Zink. We also thank N. Pardanani for information and data pertaining to the field application and effectiveness of the Kness snap trap, database design and project management pertaining to mammal collections, K. Eisenburg for assistance with the figure and exploratory statistical analysis, and J. Lee for reviewing this manuscript and providing comments that strengthened the paper. This research was funded by a Cooperative Agreement (U50/CCU206575) from the Centers for Disease Control and Prevention (CDC).
References
Author notes
The work reported in this paper was supported by Cooperative Agreement Number U50/CCU206575 from the Centers for Disease Control and Prevention (CDC). Its contents are solely the responsibility of the authors and do not necessarily represent the official views of CDC.
