


Abstract
Inflammatory bowel diseases (IBD) are characterized by mucosal inflammation and sequential fibrosis formation, but the exact role of the hyperactive NLRP3 inflammasome in these processes is unclear. Thus, we studied the expression and function of the NLRP3 inflammasome in the context of inflammation and fibrosis in IBD.
We analysed intestinal NLRP3 expression in mucosal immune cells and fibroblasts from IBD patients and NLRP3-associated gene expression via single-cell RNA sequencing and microarray analyses. Furthermore, cytokine secretion of NLRP3 inhibitor treated blood and mucosal cells, as well as proliferation, collagen production, and cell death of NLRP3 inhibitor treated intestinal fibroblasts from IBD patients were studied.
We found increased NLRP3 expression in the inflamed mucosa of IBD patients and NLRP3 inhibition led to reduced IL-1β and IL-18 production in blood cells and diminished the bioactive form of mucosal IL-1β. Single cell analysis identified overlapping expression patterns of NLRP3 and IL-1β in classically activated intestinal macrophages and we also detected NLRP3 expression in CD163+ macrophages. In addition, NLRP3 expression was also found in intestinal fibroblasts from IBD patients. Inhibition of NLRP3 led to reduced proliferation of intestinal fibroblasts, which was associated with a marked decrease in production of collagen type I and type VI in IBD patients. Moreover, NLRP3 inhibition in intestinal fibroblasts induced autophagy, a cellular process involved in collagen degradation.
In the presented study, we demonstrate that inhibiting NLRP3 might pave the way for novel therapeutic approaches in IBD, especially to prevent the severe complication of intestinal fibrosis formation.
1. Introduction
Crohn’s disease [CD] and ulcerative colitis [UC] represent the main clinical entities of inflammatory bowel diseases [IBD] and are characterized by the chronic uncontrolled activation of the mucosal immune system in the gastrointestinal tract.1,2 The relapsing onset of intestinal inflammation is typically interspersed by episodes of clinical remission. The pathogenesis of these disorders remains only partially understood. It has been established that an interplay of various factors, including genetic predisposition, environmental factors, abnormal composition of the microbiota, and exuberant activation of the mucosal immune system results in uncontrolled gut inflammation.3 The clinical symptoms of IBD are often nonspecific, such as diarrhoea, fatigue, rectal bleeding, weight loss, abdominal pain, fever, and malabsorption. In addition, complications of the progressive disease course, including fistulas, stenosis, and the development of intestinal fibrosis, can occur.4 In particular, intestinal fibrosis is a serious complication with no approved targeted therapy options available so far, often resulting in the need for surgical intervention and resection of the affected intestinal tissue.5,6 Due to the complexity of the multifactorial pathogenesis and the heterogeneous clinical outcome, each individual IBD phenotype is varying. As a result, current therapeutic options are only effective in a subgroup of IBD patients.7 It is therefore an urgent clinical need to identify novel molecular targets to establish alternative targeted therapeutic approaches.
One contributing factor to the development of IBD is a dysregulated innate and adaptive mucosal immune system. Here, recent data suggest that overactivation of the NOD-, LRR- and pyrin domain-containing 3 [NLRP3] inflammasome is a crucial player in the intestinal inflammatory reaction.8
Inflammasomes are cytosolic multimeric protein complexes which are mainly expressed in immune and epithelial cells but also in fibroblasts, osteoclasts, and keratinocytes.9–12 So far, several inflammasomes have been described differing in their protein composition.13 Among them, the NLRP3 inflammasome is best studied. The NLRP3 inflammasome consists of three components: a sensor, an adaptor, and an effector protein. The sensor protein is a pattern recognition receptor [PRR] enabling the recognition of pathogens or evolutionally conserved pathogen-associated molecular patterns [PAMPs] as well as endogenous danger-associated molecular patterns [DAMPs]. In the presence of PAMPs or DAMPs, the PRR senses the ligand and mediates assembly of the NLRP3 inflammasome by conformational changes, therefore leading to the interaction between the adapter molecule apoptosis-associated speck-like protein [ASC] and the effector protein pro-caspase-1. The activated NLRP3 inflammasome mediates self-cleavage of pro-caspase 1 into its bioactive form. This subsequently leads to induction of the proinflammatory response by triggering secretion of the proinflammatory cytokines interleukin [IL]-1β and IL-18 as well as induction of pyroptosis, a proinflammatory form of cell death.14
It is widely accepted that the persistent production of proinflammatory cytokines represents a key driver of intestinal inflammation in IBD.4,15 IL-1β and IL-18 are proinflammatory cytokines that play a crucial role in the immunopathogenesis of IBD. In particular, IL-1β-driven inflammation appears to be present in several IBD patients, which is associated with a diminished response to existing therapeutic strategies.16,17 A potential pharmacological intervention for these patients could be the reduction of pathologically excessive IL-1β secretion. Previous data linked increased levels of IL-1β in mucosal biopsies of IBD patients with heightened disease severity.18 The main outcome of IL-1β activation in mucosal immunity is the stimulation of T cell proliferation and therefore the induction of adaptive immune responses leading to the secretion of further proinflammatory cytokines, such as IL-6 and tumour necrosis factor [TNF]-α both of which have been identified as playing a prominent role in IBD pathogenesis.19,20
In the past, the function of the NLRP3 inflammasome was mainly studied with regard to inflammatory processes in immune cells. Recently, the NLRP3 inflammasome was shown to link a persistent proinflammatory cytokine milieu and the progression of structure remodelling by activated fibroblasts.21 Activated fibroblasts show increased proliferation and represent the main producers of extracellular matrix [ECM], such as collagens and fibronectin.22 In IBD, pathological production of ECM has been shown to be associated with structural remodelling processes and possibly leading to the development of intestinal stenosis and fibrosis.23,24 Furthermore, cytokines of the IL-1 superfamily have been identified to mainly drive activation and proliferation of fibroblasts.25–27
Based on these findings, NLRP3 inhibition might represent a novel target to ameliorate gut inflammation and the onset and progression of fibrosis in IBD patients. We therefore studied the function of the NLRP3 inflammasome in IBD and intestinal fibrotic processes and the molecular effects of NLRP3 inhibition by application of a newly developed NLRP3 inhibitor in primary mucosal immune cells and fibroblasts of IBD patients.
2. Materials and Methods
2.1. Patients
Peripheral blood and intestinal tissue samples were taken from IBD patients [n = 164] and controls [n = 26] in our studies. Characteristics of the patients included in our studies are summarized in Tables 1 and 2. Samples from IBD patients were used in the study after obtaining prior written informed consent from each patient. The study was previously approved by the Ethical Committee and the institutional review board of the University of Erlangen-Nuremberg.
Overview of analysed subjects in studies of the blood
| Control | Crohn’s disease | Ulcerative colitis | |
|---|---|---|---|
| Number of subjects | 6 | 23 | 21 |
| Female [%] | 50 | 39 | 48 |
| Age in years | 23–26 | 22–71 | 27–77 |
| Control | Crohn’s disease | Ulcerative colitis | |
|---|---|---|---|
| Number of subjects | 6 | 23 | 21 |
| Female [%] | 50 | 39 | 48 |
| Age in years | 23–26 | 22–71 | 27–77 |
Overview of analysed subjects in studies of intestinal tissue/intestinal cells
| Control | Crohn’s disease | Ulcerative colitis | |
|---|---|---|---|
| Number of subjects | 20 | 80 | 40 |
| Female [%] | 60 | 44 | 40 |
| Age in years | 45–82 | 20–69 | 23–65 |
| Control | Crohn’s disease | Ulcerative colitis | |
|---|---|---|---|
| Number of subjects | 20 | 80 | 40 |
| Female [%] | 60 | 44 | 40 |
| Age in years | 45–82 | 20–69 | 23–65 |
2.2. Primary human blood cell isolation
Peripheral blood mononuclear cells [PBMCs] were purified from blood samples of IBD patients and healthy controls. Cells were isolated performing density gradient centrifugation. A subpopulation of CD14+ monocytes/macrophages was purified using magnetic bead-based cell separation according to the manufacturer’s instructions [Miltenyi Biotec].
2.3. Primary human intestinal cell isolation
Lamina propria mononuclear cells [LPMCs] from IBD patients were isolated from human intestinal biopsies taken during endoscopy or from resected gut specimens. Cells were isolated as reported previously28 using the lamina propria dissociation kit [Miltenyi Biotec]. A subpopulation of intestinal CD14+ monocytes/macrophages was purified using magnetic bead-based cell separation according to the manufacturer’s instructions [Miltenyi Biotec].
2.4. Primary human fibroblast isolation
Primary human intestinal fibroblasts were isolated from resected gut specimens of IBD patients. Intestinal tissue was washed in Hanks’ balanced salt solution [Gibco] supplemented with 0.5 M EDTA [Invitrogen], 0.1 M EGTA [Carl Roth], and 10% fetal calf serum [FCS; Sigma Aldrich] and then digested with DNase I [1000 U/mL], collagenase D [0.1 U/mL], and Dispase II [1.5 U/mL]. Enzymes were obtained from Roche. Adherent cells were cultivated in Dulbecco’s modified Eagle medium F-12 [DMEM; Sigma-Aldrich] containing 10% fetal calf serum [Sigma-Aldrich], 2.5% HEPES [Gibco], and 1% penicillin/streptomycin [Gibco]. Control fibroblasts were isolated as previously described.29
2.5. Stimulation of primary cells
PBMCs and LPMCs were cultivated in the presence of gentamycin [Gibco] for 24 h and left either unstimulated or stimulated with LPS [1 µg/mL, Sigma # L5293], or a combination of LPS and NLRP3 inhibitor [10 µM, IFM-2384, kindly provided by IFM Therapeutics]. After 24 h, ATP [5 mM, Sigma] was added 30 min before collecting supernatant and harvesting the cells. Intestinal fibroblasts were cultivated in DMEM containing 10% FCS. Cells were used from passages 4–10 of cultivation. Fibroblasts were seeded for 24 h in 10% FCS containing medium. Afterwards cells were stimulated with IL-1β [10 ng/mL, R&D System] and IL-36γ [100 ng/mL R&D System] or TNFα [5 ng/mL, R&D System] or CpG OND 2006 [1 µM, Invivogen] and additionally treated with NLRP3 inhibitor [10 µM] for 9 days in serum-free medium. Medium was changed every 2 days. For the dose–response curve, inhibitor concentrations of 1.25, 2.5, 5, 10, and 20 µM were used and the read-out was used to determine cell death [see below].
2.6. RNA isolation from primary mucosal cells or fibroblasts
RNA was isolated from human CD14+ LPMCs or human intestinal fibroblasts of IBD patients using the RNeasy Mini Kit [Qiagen]. In total, 500 ng RNA was then reverse transcribed into cDNA using iScript [BioRad] according to the manufacturer’s instructions. For quantitative expression analysis, quantitect primers from Qiagen were used. Data were normalized to the reference gene HPRT.
2.7. Microarray analysis
RNA from intestinal CD14+ monocytes/macrophages and intestinal fibroblasts was obtained as described above. Its integrity was verified using a Nano Chip [RNA 6000; Agilent Technologies] on a BioAnalyzer [vB.02.03 BSI307; 2100; Agilent Technologies] as recommended by the manufacturer [RNA 6000 Nano Assay Protocol2]. Sample labelling and preparation for microarray hybridization was performed according to a standard protocol. The RNA replicates of CD14+ monocytes/macrophages from four IBD patients and four controls, such as RNA replicates of four stimulated intestinal fibroblasts and four NLRP3 inhibitor-treated fibroblasts from IBD patients were each hybridized onto a 4 × 44k array [design-ID 026655; Agilent Technologies]. Data were extracted with the feature extraction software package [v.11.7.1; Agilent Technologies] using a standard protocol. The text files generated by the feature extraction software were imported into GeneSpring GX [v.12.5; Silicon Genetics]. Data were log2-transformed followed by normalization to the 75th percentile and corrected to the median of all samples. Features of CD14+ monocytes/macrophages passing the quality check [flags detected in at least one condition] and showing changes in expression levels equal to or greater than two-fold were selected for further analysis. A volcano plot was applied to identify statistical significance [p < 0.05], more than two-fold differentially expressed genes, between two conditions, including the Benjamini–Hochberg multiple test correction. Pearson and Ward statistics were used to generate hierarchical clustering of the experimental conditions. For analyses of intestinal fibroblasts, which passed the quality check [flags detected in at least one condition] a volcano plot was performed to specify statistical significance [padj < 0.05], including the Benjamini–Hochberg correction. Data have been deposited in NCBI’s Gene Expression Omnibus [GEO] and are accessible through GEO Series accession numbers GSE230535 and GSE230539.
2.8. Single-cell RNA sequencing
Single-cell RNA sequencing was performed at the next-generation sequencing core facility of the University of Erlangen-Nuremberg using the Chromium Platform [10x Genomics]. For analysis, >2000 cells were added to 10x Chromium Single Cell 3ʹ Solution v3 library preparation according to the manufacturer’s protocol. Libraries were sequenced on an Illumina HiSeq 2500 platform to an average depth of 26.500 reads per cell. Reads were converted to FASTQ format using mkfastq from Cellranger 4.0.0 [10x Genomics]. Reads were then aligned to the preprocessed standard human reference genome refdata-gex-GRCh38-2020-A [10x Genomics, GRCh38, based on Ensembl annotation release 98]. Alignment was performed using the count command from Cellranger v4.0.0 with standard parameters. Quality control with cell filtering [gene count per cell, unique molecular identifier count per cell, percentage of mitochondrial or ribosomal transcripts], clustering, UMAP projection, and visualization of gene expression were performed using the Seurat v3.2.0 package within the R statistical environment v4.0.2. Cells with <800 UMI (unique molecular identifier), >25% mRNA transcribed from mitochondrial genes, or <2% counts for ribosomal components were removed. Samples from the same condition were merged and the raw gene expression scaled using the SCTransform approach. The sample identity was added as a batch variable in the scaling step. To be able to compare gene expression between conditions, merged and SCTransform-scaled conditions were integrated using the shared nearest neighbour approach as implemented in Seurat v3.2.0. Cluster marker genes were determined using edgeR v3.30.3. The edgeR model included the cellular detection rate [=sequencing depth per cell] and the sample identity as covariates to account for technical differences between samples. Data have been deposited in NCBI’s GEO and are accessible through GEO accession number GSE230419.
2.9. Enzyme-linked immunosorbent assay [ELISA]
Protein levels of IL-1β [# DY201], IL-18 [# DY318], IL-6 [# DY206], IL-36γ [# DY2320], IL-33 [# DY3625B], Caspase-1 [# DCA100], TNFα [#DY210], IFNγ [#DY285B], and IL-17 [#DY317] [all from R&D Systems] and NLRP3 [# EH4202, Wuhan Fine Biotech] in supernatants of cultured PBMCs and LPMCs were quantified by ELISA according to the manufacturer’s instructions. Proliferation of human intestinal fibroblasts was determined with the Cell Proliferation ELISA BrdU [colorimetric] Kit [# 11647229001, Roche] and cell death of human intestinal fibroblasts was determined with the Cell Death Detection ELISAPLUS Kit [# 11774425001, Roche]. Both ELISAs were performed according to the manufacturer’s protocol. Optical densities were detected using an MRX microplate [Dynatech Laboratories].
2.10. Simple WesternTM assay
The Simple WesternTM assay provides fully automated quantitative immunodetection of proteins separated by capillary electrophoresis.30 Briefly, the protein sample is mixed with primary and secondary antibodies as well as the chemiluminescence substrate in appropriate buffer and loaded in a nano-volume capillary. After separation the proteins are immobilized to the capillary wall via a proprietary, photoactivated capture chemistry and target proteins are detected. The results are depicted as intensity values. In detail, supernatants from LPMCs were diluted 1:1 in 0.1× ProteinSimple sample buffer [ProteinSimple] and were then combined with ProteinSimple 5× fluorescent master mix [ProteinSimple] for capillary electrophoresis. Samples were heated at 95°C for 5 min and briefly centrifugated. Each sample was loaded into a pre-filled microplate [ProteinSimple]. Primary antibodies were diluted 1:50 with antibody diluent 2 [ProteinSimple] and then loaded into the microplate. All other reagents were prepared according to the manufacturer’s protocol. After centrifugation of the microplate at 1000 g for 5 min, samples were loaded onto a ProteinSimple 12–230-kDa capillary cartridge [ProteinSimple]. A molecular weight marker was included and the cleaved IL-1β had a molecular weight of ~17 kDa.
2.11. Immunoblot
Proteins were extracted from human intestinal fibroblasts using RIPA lysis buffer [ThermoFisher Scientific] containing protease and phosphatase inhibitors [Roche Diagnostics]. Protein concentrations were determined performing BCA protein assay [ThermoFisher Scientific]. 20 µg of protein was denatured in electrophoresis buffer [Laemmli Sample Buffer, BioRad] at 95°C for 5 minutes and separated by SDS-PAGE [Mini-PROTEAN Tetra Cell System, Biorad]. Proteins were blotted onto nitrocellulose membranes for one hour. Blocking was performed in TBS-T buffer [Carl Roth] containing 5% non-fat milk [Carl Roth]. Membranes were incubated overnight at 4°C with the following primary antibodies: NLRP3 [clone Sc06-23, Invitrogen], ASC [clone B-3, Santa Cruz Biotechnology], Caspase 1 [clone 14F468, Santa Cruz Biotechnology], Col I [clone EPR22894-89, Abcam], Col VI [clone EPR17072, Abcam], PARP-1 [clone E51, Abcam], LC3B [clone EPR18709, Abcam]. Alpha-tubulin [11H10, Cell Signaling Technology] and GAPDH [EPR16891, Abcam] were used as loading controls. If necessary, a horseradish-peroxidase-conjugated secondary antibody [goat anti-rabbit IgG, # A0545, Sigma Aldrich or goat anti-mouse IgG #405306, BioLegend] was incubated for 1 h at room temperature. Chemiluminescence signal was detected using Reagent 1 and Reagent 2 blotting substrate [ThermoFisher Scientific] on a Amersham Imager 600 [GE Healthcare Bio-Sciences]. Quantification of protein level normalized to the loading control was performed using ImageJ [National Institutes of Health].
2.12. Immunofluorescence staining
Cryo-frozen intestinal cross-sections from gut specimens of IBD patients and controls were fixed with 4% paraformaldehyde and blocked using blocking reagent [Dako] and 10% neutral goat serum [Sigma]. The following primary antibodies were incubated overnight at 4°C: anti-NLRP3 [clone Sc06-23, Invitrogen], anti-α-SMA [clone 1A4, Abcam], and anti-CD163 [clone OTI2G12, Abcam]. Secondary antibodies (anti-rabbit Alexa Fluor 594 [# A32740] for NLRP3 and anti-mouse Alexa Fluor 488 [# A11017] for CD163 and α-SMA, both from Abcam) were incubated for 2 h at room temperature. Isotype antibody staining served as a control. Nuclei staining was performed with DAPI [Abcam] for 10 min. Image acquisition was done with a Stellaris 8 laser scanning microscope [Leica]. Data quantification were assessed with ImageJ. NLRP3+ cells or NLRP3+ CD163+, such as NLRP3+ α-SMA+ double positive cells were counted manually.
Human intestinal fibroblasts were seeded in eight-well chamber slides [IBIDI] and stimulated for 9 days. Cells were fixed with 4% paraformaldehyde and blocked using blocking reagent [Dako]. The following primary antibodies were incubated overnight at 4°C: anti-NLRP3 [clone Sc06-23, Invitrogen], anti-vimentin Alexa Fluor 488 [clone V9, Abcam], anti-Col I [clone EPR22894-89, Abcam], anti-Col VI [clone EPR17072, Abcam], anti-IL-1 receptor Alexa Fluor 647 [clone H-8, Santa Cruz Biotechnology], and Ki67 Alexa Fluor 594 [clone EPR3610, Abcam]. NLRP3, collagen I, and collagen VI were stained with the secondary antibody anti-rabbit Alexa Fluor 594 [# A32740, Abcam] for 2 h at room temperature. Isotype antibody staining served as a control. Nuclei staining was performed with DAPI [Abcam] for 10 min. Image acquisition was done with a Stellaris 8 laser scanning microscope [Leica]. Data quantification were assessed with ImageJ. Ki67+ cells were counted manually, whereas the signal intensity of collagen I and collagen VI was determined using mean grey intensity calculation by ImageJ software.
2.13. Statistical analysis
For statistical analyses Prism8 software [GraphPad] was used with either Student’s t-test or the Wilcoxon-Mann-Whitney test. For the comparison of several groups the ANOVA test was performed. For the dose–response curve a nonlinear regression analysis was performed. Significant differences were defined fat p ≤ 0.05.
3. Results
3.1. NLRP3 inhibition leads to decreased IL-1β and IL-18 secretion in human PBMCs
In this study we investigated the molecular effects of NLRP3 inhibition in IBD. Several activators of the NLRP3 inflammasome have been described in previous works.31 We used lipopolysaccharide [LPS] and ATP to initiate NLRP3 inflammasome activation. LPS from Gram-negative bacteria is one of the so-called PAMPs. As a ligand for TLR-4, LPS leads to NF-κB-mediated upregulation of NLRP3 protein expression and pro-IL-1β, resulting in adequate levels of these proteins for NLRP3 inflammasome activation. It is well established that this initial step is required for NLRP3 inflammasome activation.32,33 To include an additional DAMP for NLRP3 activation in our studies, we stimulated in addition with ATP, which indirectly leads to K+-efflux, a well-described cellular event for NLRP3 inflammasome activation.31,34 In this context, we first showed that stimulation of PBMCs with LPS and LPS plus ATP caused an increase in IL-1β whereas NLRP3 inhibition led to a significantly decreased IL-1 β secretion in bulk PBMCs of CD and UC patients [Figure 1A]. We further assessed the effect of NLRP3 inhibition on IL-18 secretion. For both entities we observed an increase of IL-18 secretion due to stimulation of the cells and an inhibition after NLRP3 inhibitor treatment [Figure 1B]. Interestingly, NLRP3 inhibition did not affect the secretion of the proinflammatory cytokines IL-33, IL-36γ, IL-6, and TNFα by PBMCs but IFNγ secretion was decreased after NLRP3 inhibition [Supplementary Figure S1]. We speculate that the reduced IFNγ concentrations are a consequence of the decreased IL-18 production by PBMCs after NLRP3 inhibition, as IL-18 is known to induce IFNγ production.35,36 NLRP3 expression has already been demonstrated in many immune and nonimmune cells, particularly strong expression is evident in immune cells of myeloid origin.37 Consistent with this, we observed stronger activation of IL-1β secretion by CD14+ blood monocytes/macrophages and subsequently stronger effects on the IL-1β secretion by NLRP3 inhibitor treatment compared to bulk PBMCs in CD and UC patients [Figure 1C]. Even though the secretion levels for IL-18 secretion by CD14+ monocytes/macrophages were lower compared to bulk PBMCs, the effect of the NLRP3 inhibitor was still significant [Figure 1D]. NLRP3 inhibition had no effect on the IL-36γ secretion of CD14+ monocytes/macrophages [Supplementary Figure S2].
![NLRP3 inhibition leads to decreased IL-1β and IL-18 secretion in human PBMCs. PBMCs were unstimulated or stimulated for 24 h with LPS or LPS plus ATP and treated with the NLRP3 inhibitor [10 µM]. [A] IL-1β concentrations were analysed in the supernatant of PBMCs from CD [n = 10] and UC patients [n = 13]. [B] IL-18 concentrations were analysed in the supernatant of PBMCs from CD [n = 11] and UC patients [n = 11]. [C] IL-1β concentrations were analysed in the supernatant of CD14+ monocytes/macrophages from blood of CD [n = 11] and UC patients [n = 8] [D] IL-18 concentrations were analysed in the supernatant of CD14+ monocytes/macrophages from blood of CD [n = 10] and UC patients [n = 7]. Student’s t-test was applied for UC patients in D. Mann–Whitney test was used for statistical analyses if not indicated otherwise. The presented data show mean values ± SEM. *p ≤ 0.05; **p ≤ 0.01; ***p ≤ 0.001; ****p ≤ 0.0001.](https://oup.silverchair-cdn.com/oup/backfile/Content_public/Journal/ecco-jcc/18/3/10.1093_ecco-jcc_jjad164/1/m_jjad164_fig1.jpeg?Expires=1750195592&Signature=VGGUUXZ9Oq2GVe82rLodeZf-T-35k8h0wknnTbYE574DWCmv62gzVXKEwMrX9gZpzAsL0Ar4i4J5DdBTc3527sA5PjyrciPSHwBRwyouXON1GgAHchCblsRvf3aMqlhitdaFPz-clrKK7mi5vhYpMIbtpqG8~LYXCIt5BMi5VELmvnWYV5tyQYzNrAM6NfxT-JK5NLT~Z~rLO15AD8UFaGjHOpSQrkeYGRhfsm-Q4TAL8oXNp7tEVRAGJGCgx-Dx80fM3G6KFUippY1b-IChp1s8v0QOiA5XWJmytaXqoA0xEIqzE4Suc6qGvqs6RsCyFFJ6z-T91Q86XELh8~lthg__&Key-Pair-Id=APKAIE5G5CRDK6RD3PGA)
NLRP3 inhibition leads to decreased IL-1β and IL-18 secretion in human PBMCs. PBMCs were unstimulated or stimulated for 24 h with LPS or LPS plus ATP and treated with the NLRP3 inhibitor [10 µM]. [A] IL-1β concentrations were analysed in the supernatant of PBMCs from CD [n = 10] and UC patients [n = 13]. [B] IL-18 concentrations were analysed in the supernatant of PBMCs from CD [n = 11] and UC patients [n = 11]. [C] IL-1β concentrations were analysed in the supernatant of CD14+ monocytes/macrophages from blood of CD [n = 11] and UC patients [n = 8] [D] IL-18 concentrations were analysed in the supernatant of CD14+ monocytes/macrophages from blood of CD [n = 10] and UC patients [n = 7]. Student’s t-test was applied for UC patients in D. Mann–Whitney test was used for statistical analyses if not indicated otherwise. The presented data show mean values ± SEM. *p ≤ 0.05; **p ≤ 0.01; ***p ≤ 0.001; ****p ≤ 0.0001.
3.2. NLRP3 inhibition leads to decreased bioactive IL-1β secretion in human LPMCs
To further investigate the role of the NLRP3 inflammasome as a potential therapeutic target in IBD, we first examined the NLRP3 expression in intestinal tissue sections. We showed an upregulation of the NLRP3 protein in intestinal inflamed tissue compared to noninflamed tissue of IBD patients and gut tissue from controls. Quantification of NLRP3-positive cells revealed more NLRP3-expressing cells in inflamed compared to noninflamed tissue and controls [Figure 2A]. As these findings indicate a relevance of NLRP3 in intestinal inflammation, the influence of NLRP3 inhibitor treatment on the secretion of proinflammatory cytokines by LPMCs was determined. IL-1β secretion was decreased in NLRP3 inhibitor-treated LPMCs from IBD patients [Figure 2B]. The secretion of other proinflammatory cytokines of the IL-1 family as well as further proinflammatory cytokines was not affected by NLRP3 inhibition. In contrast, NLRP3 inhibition led to decreased IFNγ secretion by LPMCs [Supplementary Figure S3].
![NLRP3 inhibition leads to decreased bioactive IL-1β secretion in human LPMCs. [A] Representative immunofluorescence staining for NLRP3 and respective isotype control on intestinal cryosections from IBD patients [n = 10] and controls [n = 10]. Scale bars represent 50 µm [upper row] and 5 µm [lower row]. Arrows indicate NLRP3+ cells. Bar graph shows the mean number ± SEM of NLRP3+ cells in three to six high power fields [HPFs]. Student’s t-test was applied for statistical analysis. *p ≤ 0.05; ***, p ≤ 0.005. [B] LPMCs from IBD patients [n = 22–46] were unstimulated or stimulated for 24 h with LPS or LPS plus ATP and treated with the NLRP3 inhibitor [10 µM]. IL-1β concentrations were analysed in the supernatants by ELISA. [C] Subgroup analysis of IBD patients. IL-1β levels were determined by ELISA in the supernatant of cultured LPMCs of CD [n = 11–19] and UC patients [n = 11–27]. [D] Cleaved IL-1β concentrations were determined in the supernatants of LPMCs from IBD patients [n = 40] by Simple WesternTM analysis. The cleaved form of IL-1β was detected at 17 kDa. Mann–Whitney test was used for statistical analyses if not indicated otherwise. The bars show mean values ± SEM. *p ≤ 0.05; **p ≤ 0.01; ***p ≤ 0.001.](https://oup.silverchair-cdn.com/oup/backfile/Content_public/Journal/ecco-jcc/18/3/10.1093_ecco-jcc_jjad164/1/m_jjad164_fig2.jpeg?Expires=1750195593&Signature=kkiMwcucWslp84gAFlTIFDL--EoUXr1CxlcuRr~FCHnsAoDbyjP2nrkGj1gDXjRYrWnJOZfzxYxl7XPoCVszpAM-guMbbq51qJ93sBaCX6sNyOPpidUe~Lcn9~G-UfOFfkkew~elbObJX6zUGode0rTpIupV7ehzV1oSgPZmSKSXOFUUndjLEZSHxEeJyfuBV~sMGzRyvA0GEJA-PF51c5YuExPnLws5sVekfGrFMqD6mpUdj22nFjEqsPsgUnfO6iihnFO2fFvBGPlSfoHvQye3a47tjGLY6ergfYRkXYOPSHu2k01z5Ebrfi0X56B~SqZ36fwrwDb2PXyGg6PCKw__&Key-Pair-Id=APKAIE5G5CRDK6RD3PGA)
NLRP3 inhibition leads to decreased bioactive IL-1β secretion in human LPMCs. [A] Representative immunofluorescence staining for NLRP3 and respective isotype control on intestinal cryosections from IBD patients [n = 10] and controls [n = 10]. Scale bars represent 50 µm [upper row] and 5 µm [lower row]. Arrows indicate NLRP3+ cells. Bar graph shows the mean number ± SEM of NLRP3+ cells in three to six high power fields [HPFs]. Student’s t-test was applied for statistical analysis. *p ≤ 0.05; ***, p ≤ 0.005. [B] LPMCs from IBD patients [n = 22–46] were unstimulated or stimulated for 24 h with LPS or LPS plus ATP and treated with the NLRP3 inhibitor [10 µM]. IL-1β concentrations were analysed in the supernatants by ELISA. [C] Subgroup analysis of IBD patients. IL-1β levels were determined by ELISA in the supernatant of cultured LPMCs of CD [n = 11–19] and UC patients [n = 11–27]. [D] Cleaved IL-1β concentrations were determined in the supernatants of LPMCs from IBD patients [n = 40] by Simple WesternTM analysis. The cleaved form of IL-1β was detected at 17 kDa. Mann–Whitney test was used for statistical analyses if not indicated otherwise. The bars show mean values ± SEM. *p ≤ 0.05; **p ≤ 0.01; ***p ≤ 0.001.
Subgroup analysis of IBD patients showed a decrease of IL-1β secretion in LPMCs from CD and UC patients after NLRP3 inhibitor treatment [Figure 2C]. To address the effect of NLRP3 inhibition on the secretion of mature bioactive IL-1β from LPMCs of IBD patients, we analysed the supernatants by highly sensitive Simple WesternTM analysis and showed that NLRP3 inhibitor treatment resulted in a decrease of cleaved IL-1β secretion [Figure 2D]. Regarding a potential therapeutic intervention, these results show a very specific effect of NLRP3 inhibition on the IL-1β secretion by human mucosal cells from CD and UC patients.
3.3. NLRP3 expression is upregulated in intestinal CD14+ monocytes/ macrophages in IBD patients
After proving the upregulation of NLRP3 expression in inflamed tissue from IBD patients and subsequently the effect of NLRP3 inhibition on bulk LPMCs, we further evaluated in more detail the expression patterns of NLRP3 in LPMCs by single cell analysis. Within the heterogenous bulk LPMCs we found 12 different cell clusters, identified by different cell markers [Figure 3A]. The heat map resulting from the samples revealed strong clustering of the individual cell clusters within the LPMCs [Figure 3B]. Analysis of NLRP3 and IL-1β showed wide expression patterns within the different cell clusters, whereas IL-18 was expressed in fewer clusters. Il-1β expression was mainly detected in cluster 3 [M1-like macrophages, monocytes] and 10 [M1-like macrophages]. Furthermore, in cell cluster 10 there was an obvious overlap with the expression of NLRP3 [Figure 3C]. This is in accordance with published data suggesting macrophages as the major source of IL-1β production.36,38 Differential gene expression analyses of IL-1β-expressing and IL-1β nonexpressing macrophages/monocytes from clusters 3 and 10 was performed [Supplementary Tables S1 and S2]. In addition, differential gene expression analysis of IL-1β /NLRP3 co-expressing cells and IL-1β/NLRP3 nonexpressing cells from cluster 10 was performed [Supplementary Table S3]. Of note, no other NLR was expressed by the monocytes/macrophages from cluster 3, further strengthening the role of NLRP3 in intestinal monocytes/macrophages. The IL-1β-expressing monocytes/macrophages from clusters 3 and 10 showed several commonly expressed genes with the most prominent being CXCL5, CSF1, CXCL1, INHBA, and CXCL8 [Supplementary Tables S4 and S5].
![Coexpression of NLRP3 and IL-1β in human LPMCs is predominantly found in M1-like macrophages. [A] Uniform Manifold Approximation and Projection for Dimension Reduction [UMAP] plots of aligned gene expression data in single cells obtained from LPMCs of CD patients [n = 7]. Unsupervised clustering with the Leiden algorithm at a resolution of 0.2 distinguishes 12 clusters. Each cluster is defined by a unique set of differentially expressed genes. [B] Heatmap showing the top ten marker genes for each cluster defined in A. [C] Gene expression patterns projected onto UMAP plots of NLRP3, IL1B, and IL18.](https://oup.silverchair-cdn.com/oup/backfile/Content_public/Journal/ecco-jcc/18/3/10.1093_ecco-jcc_jjad164/1/m_jjad164_fig3.jpeg?Expires=1750195593&Signature=Zpq6WEJHG5D-CDdZK-Uaiz7aFvhtBag4OAy1VXM95w6wDNSFuOgbhXy0HBDAXScn9LLGDjZCEGNB0Gzl3EPPOiOkDvjNSPuJXlvCO0Z-rVsMoEFn1kATVb5CR1PrVfXbiuR8N8MI27VAS7~tKqI715bk~wiUuvaG6fJIjvdc3BOQexc3N3wyae2x~HTQZNl2P1-2OfffPxxFrLFDQVb3aeFg11yy47af8eRzyBKPLWTSu87DojVw5qEy39mAMXPscgJgdfqh0QsgD3eU04AbIawwg~wTsQvuKoCMq-acEfq2IgGJymlKq03q4QNVEqWmD2vKPcJJDPCy~8GTPzedUg__&Key-Pair-Id=APKAIE5G5CRDK6RD3PGA)
Coexpression of NLRP3 and IL-1β in human LPMCs is predominantly found in M1-like macrophages. [A] Uniform Manifold Approximation and Projection for Dimension Reduction [UMAP] plots of aligned gene expression data in single cells obtained from LPMCs of CD patients [n = 7]. Unsupervised clustering with the Leiden algorithm at a resolution of 0.2 distinguishes 12 clusters. Each cluster is defined by a unique set of differentially expressed genes. [B] Heatmap showing the top ten marker genes for each cluster defined in A. [C] Gene expression patterns projected onto UMAP plots of NLRP3, IL1B, and IL18.
3.4. NLRP3 expression is upregulated in intestinal CD14+ monocytes/macrophages in IBD patients
Given the fact that IL-1β is a very potent proinflammatory cytokine, which in some IBD patients is the key driver of intestinal inflammation and shows a strong overlap in NLRP3 expression patterns in proinflammatory M1-like macrophages, we next investigated the relevance of NLRP3 on these cells. For that, we performed microarray analyses of CD14+ monocytes/macrophages from IBD patients and controls. Ingenuity pathway analysis of the NLRP3 inflammasome signalling pathway revealed an upregulation of the NLRP3 protein and the transcription factor NF-κB in IBD patients compared to controls. Other inflammasomes such as NLRP1, AIM2 or NLRC4 were not upregulated in IBD patients, indicating a prominent role of NLRP3 in the immunopathogenesis of IBD [Figure 4A]. Next, we assessed NLRP3 expression in CD163+ [monocyte/macrophage marker] cells in intestinal tissue. Immunofluorescence staining revealed more NLRP3/CD163-positive cells in inflamed tissue compared to not inflamed tissue from IBD patients and controls, underlining an involvement of NLRP3 in intestinal inflammation [Figure 4B].
![NLRP3 expression is upregulated in intestinal CD14+ monocytes/macrophages in IBD patients. [A] Ingenuity Pathway Analysis [IPA] of intestinal CD14+ monocytes/macrophages of IBD patients [n = 4] and controls [n = 4] showing the NLRP3 inflammasome signalling pathway. The red colour indicates a significant upregulation of the respective molecules in IBD patients compared to controls. [B] Representative immunofluorescence staining for CD163 and NLRP3 was performed on cryosections from inflamed and noninflamed intestinal tissue [n = 10] of IBD patients and controls [n = 10]. Scale bars represent 50 µm [upper row] and 5 µm [lower row]. Arrows indicate double positive cells for NLRP3 and CD163. Bar graph shows the mean numbers ± SEM of double positive cells in three to six high power fields [HPFs]. Mann–Whitney test was applied for statistical analysis. ***p ≤ 0.001.](https://oup.silverchair-cdn.com/oup/backfile/Content_public/Journal/ecco-jcc/18/3/10.1093_ecco-jcc_jjad164/1/m_jjad164_fig4.jpeg?Expires=1750195593&Signature=QX~Sj1TcolV55MI4~z9f94BxtysffEoxo-n8m0D1vD2c-imTTJSY1P6FLNyrRur76LxGXkJNLwqO4FZvCb7WLtzN93G0ZyD7epTCodkHN-kY23jafiZLcajxIbETHM-MtGJE8DsJVty7yL0~2smItdlySkE-bIwAv3MgqAYmMQuIauxXzCbYMmo-7LbA5UGQRsmLCdv~-ZU-xu4WI0jd1ENlyRN-FDMsIcUkYy-VLLnT9nwbCBgX0dzt-Up~RRGfLIGRi2hFIkEXHVJ-ax-kSg~MoQDFzdBjPNSRSkH1rxVRL5Er--IjQj22m2iuE-vcL~UanCP2JXVOmEyYRUKxgg__&Key-Pair-Id=APKAIE5G5CRDK6RD3PGA)
NLRP3 expression is upregulated in intestinal CD14+ monocytes/macrophages in IBD patients. [A] Ingenuity Pathway Analysis [IPA] of intestinal CD14+ monocytes/macrophages of IBD patients [n = 4] and controls [n = 4] showing the NLRP3 inflammasome signalling pathway. The red colour indicates a significant upregulation of the respective molecules in IBD patients compared to controls. [B] Representative immunofluorescence staining for CD163 and NLRP3 was performed on cryosections from inflamed and noninflamed intestinal tissue [n = 10] of IBD patients and controls [n = 10]. Scale bars represent 50 µm [upper row] and 5 µm [lower row]. Arrows indicate double positive cells for NLRP3 and CD163. Bar graph shows the mean numbers ± SEM of double positive cells in three to six high power fields [HPFs]. Mann–Whitney test was applied for statistical analysis. ***p ≤ 0.001.
3.5. NLRP3 is expressed in human intestinal fibroblasts from IBD patients
In accordance with published data and our above described findings, we and others have indicated a potent role of NLRP3 inflammasome activation in immune cells of the intestine.39,40 Nevertheless, increasing evidence suggests that the NLRP3 inflammasome plays an additional role in nonimmune cells, such as fibroblasts.41,42 So far, some studies have demonstrated a correlation between activated NLRP3 inflammasome and the profibrotic phenotype of fibroblasts, for example in tissue of the heart or lung,43,44 but there have been no studies in the intestine yet.
Therefore, we analysed NLRP3 expression in intestinal tissue sections and found a colocalization of NLRP3 and α-SMA, a wildly used marker for activated [myo-]fibroblasts. Quantification of double positive cells showed significantly more NLRP3/α-SMA-positive cells in inflamed compared to not inflamed tissue of IBD patients and control tissue [Figure 5A]. Since fibroblasts are the main mediators of intestinal fibrosis in IBD,45,46 we analysed the expression of NLRP3 in human intestinal fibroblasts. We found NLRP3 expression as well as ASC and caspase 1 expression in isolated fibroblasts from gut tissue of IBD patients and controls in immunoblot analysis [Figure 5C] and confirmed the NLRP3 expression with immunofluorescence staining [Figure 5B].
![NLRP3 is expressed in human intestinal fibroblasts of IBD patients. [A] Representative immunofluorescence staining for α-SMA and NLRP3 was performed on cryosections from intestinal inflamed tissue of IBD patients [n = 10], not inflamed tissue of IBD patients [n = 10], and controls [n = 10]. Scale bars represent 50 µm [upper row] and 5 µm [lower row]. Arrows indicate double positive cells for NLRP3 and α-SMA. Bar graph shows the mean numbers ± SEM of the double positive cells in three to six high power fields [HPFs]. Student’s t-test was applied for statistical analyses. *p ≤ 0.05. [B] Representative immunofluorescence staining for vimentin and NLRP3 was performed on isolated human intestinal fibroblasts of IBD patients [n = 3]. [C] Immunoblot analyses of NLRP3, ASC, and caspase 1 expression in human intestinal fibroblasts. Recombinant NLRP3 was used as a positive control. Data are representative of three independent experiments.](https://oup.silverchair-cdn.com/oup/backfile/Content_public/Journal/ecco-jcc/18/3/10.1093_ecco-jcc_jjad164/1/m_jjad164_fig5.jpeg?Expires=1750195593&Signature=m0RSDBPyVtE~65S4WbsUaO7nG9mBnX46hv9u3gqj3rhPJKRaJjFi0Lvp0hUcD~qD7pvb8MdOBNjriL27tBYZZniWSeMO4TbYaHPYfHVSLGAqQf91Ru7JEJv1IREGiVxdg0GzNEMctpLA1jPuWQAnqvPhx5YThkHsU9dEho3krcMEKS~vOQvhtG4yB9gMFindUD4c9~ICTBk4G886S1~K3plJjD3vb3eufYGki9D9ZepgcQerhWoYUe5Lfm-3ZclRePkNXB838zjc6rU4nmeiXIA-0FIsWal2oyqoFk3dmo2X2AeSLxGpu7n4xav~E6yxmWAvARhGVJk5J3-vWGJgTA__&Key-Pair-Id=APKAIE5G5CRDK6RD3PGA)
NLRP3 is expressed in human intestinal fibroblasts of IBD patients. [A] Representative immunofluorescence staining for α-SMA and NLRP3 was performed on cryosections from intestinal inflamed tissue of IBD patients [n = 10], not inflamed tissue of IBD patients [n = 10], and controls [n = 10]. Scale bars represent 50 µm [upper row] and 5 µm [lower row]. Arrows indicate double positive cells for NLRP3 and α-SMA. Bar graph shows the mean numbers ± SEM of the double positive cells in three to six high power fields [HPFs]. Student’s t-test was applied for statistical analyses. *p ≤ 0.05. [B] Representative immunofluorescence staining for vimentin and NLRP3 was performed on isolated human intestinal fibroblasts of IBD patients [n = 3]. [C] Immunoblot analyses of NLRP3, ASC, and caspase 1 expression in human intestinal fibroblasts. Recombinant NLRP3 was used as a positive control. Data are representative of three independent experiments.
3.6. NLRP3 inhibition leads to decreased proliferation of human intestinal fibroblasts
In IBD, excessive proliferating mucosal fibroblasts are the key driver in structure remoulding which leads to the development of fibrotic structures in the intestine.21,47 Therefore, proliferation of cultured intestinal fibroblasts after NLRP3 inhibition was investigated. First, we established stimulation conditions to archive a high activation status of these cells. The stimulation of intestinal fibroblasts for 9 days with the combination of IL-36γ and IL-β resulted in higher proliferation levels compared to the unstimulated cells whereas the single stimulation with one of these cytokines had no significant effect of the proliferation of the intestinal fibroblasts [Figure 6A]. Subsequent experiments were performed with IL-36γ in addition to IL-1β-stimulated fibroblasts. Importantly, α-SMA-positive intestinal fibroblasts from IBD patients were shown to express the IL-1 receptor [Supplementary Figure S4]. To define possible toxic effects of the NLRP3 inhibitor a dose–response curve was performed [Supplementary Figure S5]. We used an inhibitor concentration of 10 µM for the following experiments. Next, we assessed whether NLRP3 inhibitor treatment of the intestinal fibroblasts from IBD patients affects fibroblast proliferation. NLRP3 inhibition led to significantly decreased proliferation of intestinal fibroblast of IBD patients [Figure 6B], whereas proliferation of control fibroblasts was not affected [Figure 6C]. This is probably due to the fact that fibroblasts from controls were isolated from not inflamed tissue, and thus were not primed by a persistent proinflammatory milieu over a long time. Subgroup analysis of the patients revealed an effect of NLRP3 inhibition in both entities of IBD [Figure 6D]. Immunofluorescence staining with Ki67, a well-known proliferation marker, confirmed the reduced proliferation of the intestinal fibroblasts from IBD patients treated with NLRP3 inhibitor [Figure 6E, F]. To analyse the IL-1β-independent effects of NLRP3 inhibition, intestinal fibroblasts were stimulated with TNFα, LPS [TLR4 stimulation], and CpG ODN2006 [TLR9 stimulation] and treated with the NLRP3 inhibitor. The proliferation was not affected in any stimulation [Supplementary Figure S6], confirming NLRP3 inhibition did not lead to confounding effects in human intestinal fibroblasts.
![NLRP3 inhibition leads to decreased proliferation of human intestinal fibroblasts. [A] Isolated intestinal fibroblasts from IBD patients [n = 8] were stimulated for 9 days every 2 days with IL-36γ and IL-1β in serum-free media. Cell proliferation was analysed using BrdU staining. [B] Isolated intestinal fibroblasts from IBD patients [n = 16] were stimulated with IL-36γ and IL-1β and treated with the NLRP3 inhibitor [10 µM]. Cell proliferation was analysed using a BrdU staining. [C] Isolated intestinal fibroblasts from controls [n = 7] were stimulated with IL-36γ and IL-1β and treated with the NLRP3 inhibitor. Cell proliferation was analysed using BrdU staining. [D] Subgroup analysis of IBD patients. Proliferation of intestinal fibroblasts from CD patients [n = 10] and UC patients [n = 6] was determined using BrdU staining. [E] Representative immunofluorescence staining for vimentin and Ki67 was performed on intestinal fibroblasts from IBD patients [n = 6]. Scale bars represent 50 µm. Arrows indicate double positive cells for NLRP3 and Ki67. Bar graph shows the percentage ± SEM of double positive cells in three to six high power fields [HPFs]. Student’s t-test was applied for statistical analyses. *p ≤ 0.05; ***p ≤ 0.001.](https://oup.silverchair-cdn.com/oup/backfile/Content_public/Journal/ecco-jcc/18/3/10.1093_ecco-jcc_jjad164/1/m_jjad164_fig6.jpeg?Expires=1750195593&Signature=3~Hgi78uERR9oeDfuiwIkA8-MxME0tEfmvs5T937Xk2Wsven~BKqCX9B~rUpQHIjMmK7VVnvNUmWzAWOAg4DJalcELxp-xOudDbSApHuW6wq4V0xqy7o91goBrp58zkvYPH9qDVls~m5YhWZDjaHeJCo2-y9CT81Z~p49up6CcjqoNtD0rtn32wCtDbPAmF-vZ-U2cLvaS4s9wfYlS3fQR3T302ZOSL64Fqwd1vOtmJV1nx-PqAUpdcVVn3jn8dvQpe50kTfqf~MvV7WWgRxqGemvxy32pKBSbBtbyZdaStWTbcXZJIivZ8XxySc1n1ZfaCNGjLpWVupWDRMSYEGrg__&Key-Pair-Id=APKAIE5G5CRDK6RD3PGA)
NLRP3 inhibition leads to decreased proliferation of human intestinal fibroblasts. [A] Isolated intestinal fibroblasts from IBD patients [n = 8] were stimulated for 9 days every 2 days with IL-36γ and IL-1β in serum-free media. Cell proliferation was analysed using BrdU staining. [B] Isolated intestinal fibroblasts from IBD patients [n = 16] were stimulated with IL-36γ and IL-1β and treated with the NLRP3 inhibitor [10 µM]. Cell proliferation was analysed using a BrdU staining. [C] Isolated intestinal fibroblasts from controls [n = 7] were stimulated with IL-36γ and IL-1β and treated with the NLRP3 inhibitor. Cell proliferation was analysed using BrdU staining. [D] Subgroup analysis of IBD patients. Proliferation of intestinal fibroblasts from CD patients [n = 10] and UC patients [n = 6] was determined using BrdU staining. [E] Representative immunofluorescence staining for vimentin and Ki67 was performed on intestinal fibroblasts from IBD patients [n = 6]. Scale bars represent 50 µm. Arrows indicate double positive cells for NLRP3 and Ki67. Bar graph shows the percentage ± SEM of double positive cells in three to six high power fields [HPFs]. Student’s t-test was applied for statistical analyses. *p ≤ 0.05; ***p ≤ 0.001.
3.7. NLRP3 inhibition leads to decreased collagen production in human intestinal fibroblasts
As mentioned previously, activated proliferating fibroblasts produce large amounts of ECM, in particular collagen type I and type VI in the intestine. Showing the effect of a NLRP3 inhibition on proliferation, we further assessed underlying effects on collagen production. On a transcriptional level, NLRP3 inhibitor treatment did not change gene expression of intestinal fibroblasts [Supplementary Figure S7]. In contrast, we detected marked reduction of collagen type I and type VI production in intestinal fibroblasts of IBD patients and controls as a consequence of NLRP3 inhibition [Figure 7A]. Quantification of immunoblot analyses revealed significant differences in collagen type I and type VI production after NLRP3 inhibitor treatment in fibroblasts from IBD patients [Figure 7B] and controls [Figure 7C]. Immunofluorescence staining of collagen I and collagen VI confirmed these results. NLRP3 inhibition caused reduced collagen I production in IBD patients [Figure 7D, E]. Furthermore, we confirmed reduced collagen VI production by immunofluorescence staining in cultured fibroblasts from IBD patients [Figure 7F, G].
![NLRP3 inhibition leads to decreased collagen production in human intestinal fibroblasts. [A] Representative immunoblot analysis of IL-36γ- and IL-1β-stimulated and NLRP3 inhibitor- [10 µM] treated human intestinal fibroblasts from IBD patients and controls for collagen I and collagen VI. [B] For quantification, collagen I signals of IBD patients [n = 5] and controls [n = 3] were normalized to α-tubulin signal. Relative protein expression of collagen I is shown. [C] For quantification, the collagen VI signal of IBD patients [n = 5] and controls [n = 3] was normalized to the α-tubulin signal. Relative protein expression of collagen I is shown. [D] Representative immunofluorescence staining for vimentin and collagen I was performed on IL-36γ- and IL-1β-stimulated and NLRP3 inhibitor-treated intestinal fibroblasts from IBD patients [n = 5]. Scale bars represent 50 µm. [E] Bar graph shows the mean intensity ± SEM of collagen I staining in three to six high power fields [HPFs]. [F] Representative immunofluorescence staining for vimentin and collagen VI was performed on IL-36γ- and IL-1β-stimulated and NLRP3 inhibitor-treated intestinal fibroblasts from IBD patients [n = 6]. Scale bars represent 50 µm. [G] Bar graph shows the mean intensity ± SEM of collagen VI staining in three to six high power fields [HPFs]. Student’s t-test was applied for statistical analyses. *p ≤ 0.05; **p ≤ 0.01; ***p ≤ 0.001.](https://oup.silverchair-cdn.com/oup/backfile/Content_public/Journal/ecco-jcc/18/3/10.1093_ecco-jcc_jjad164/1/m_jjad164_fig7.jpeg?Expires=1750195593&Signature=KxyjRWWOI00wBAX6UptjKmRfq6n63hW-966wRAv2ZIic-5-s1WPWMDGmMjA~pmy6PDsdZG7zxcH3sYvC13GLIk~DYwWYKb5KgYt08E7AR8Gfy2InSeCZsOtGs~KdVMW8aEgF4ye~2GOH5DwbRFMGWeBSiUtzwL6NZyC0Yz7bXWNiCMUK7HbzQSUXenwGUyUuXa0ScD8Guuczwe5qhSoC5B3EjthVwMiz3cDa7u1hq1mJEfSgpDhszNHUmjV3WZAoBC9wmUPsMAUydkl~PjW86XWppXdr0L09~62nC6MsU-JowegNibi~ugu0eHIQ5m3Rm3A6elFVqYiKaYPUFRAmjg__&Key-Pair-Id=APKAIE5G5CRDK6RD3PGA)
NLRP3 inhibition leads to decreased collagen production in human intestinal fibroblasts. [A] Representative immunoblot analysis of IL-36γ- and IL-1β-stimulated and NLRP3 inhibitor- [10 µM] treated human intestinal fibroblasts from IBD patients and controls for collagen I and collagen VI. [B] For quantification, collagen I signals of IBD patients [n = 5] and controls [n = 3] were normalized to α-tubulin signal. Relative protein expression of collagen I is shown. [C] For quantification, the collagen VI signal of IBD patients [n = 5] and controls [n = 3] was normalized to the α-tubulin signal. Relative protein expression of collagen I is shown. [D] Representative immunofluorescence staining for vimentin and collagen I was performed on IL-36γ- and IL-1β-stimulated and NLRP3 inhibitor-treated intestinal fibroblasts from IBD patients [n = 5]. Scale bars represent 50 µm. [E] Bar graph shows the mean intensity ± SEM of collagen I staining in three to six high power fields [HPFs]. [F] Representative immunofluorescence staining for vimentin and collagen VI was performed on IL-36γ- and IL-1β-stimulated and NLRP3 inhibitor-treated intestinal fibroblasts from IBD patients [n = 6]. Scale bars represent 50 µm. [G] Bar graph shows the mean intensity ± SEM of collagen VI staining in three to six high power fields [HPFs]. Student’s t-test was applied for statistical analyses. *p ≤ 0.05; **p ≤ 0.01; ***p ≤ 0.001.
3.8. NLRP3 inhibition leads to increased induction of autophagy in human intestinal fibroblasts
Next, we checked whether cellular degradative mechanisms are affected by the inhibition of NLRP3. First, we found a decrease in cell death of IL-36γ- and IL-1β-stimulated fibroblasts compared to unstimulated control, whereas NLRP3 inhibitor treatment resulted in an induction of cell death [Figure 8A]. As cell death compromises several forms, which differ in characteristics and functions, we analysed the most relevant forms associated with the IBD. Immunoblot analysis of intestinal fibroblasts did not show any differences in the level of apoptosis caused by NLRP3 inhibitor treatment [Supplementary Figure S8]. We were not able to analyse proptosis in intestinal fibroblasts since signals were too weak. Autophagy defines the process in which cytosolic material, such as misfolded proteins or damaged cell organelles, is degraded. Recently, increasing evidence suggests that autophagy can also lead to a regulated cell death without involvement of other cell death pathways under certain circumstances.48–50 Alleviated autophagy is strongly associated with the development of IBD, including intestinal fibrosis.51,52 In our study we demonstrated an induction of autophagy in fibroblasts from IBD patients by NLRP3 inhibitor treatment [Figure 8B, C]. Hence, these analyses suggested that NLRP3 inhibition in intestinal fibroblasts affects not only proliferation and collagen production, but also the degenerative cellular mechanism of autophagy.
![NLRP3 inhibition leads to increased induction of autophagy in human intestinal fibroblasts. [A] Cell death of IL-36γ- and IL-1β-stimulated and NLRP3 inhibitor- [10 µM] treated intestinal fibroblasts from IBD patients [n = 11] was analysed. Bar graph shows the mean absorption ± SEM. [B] Representative immunoblot analysis of LC3BI and LC3BII protein expression of IL-36γ- and IL-1β-stimulated and NLRP3 inhibitor-treated human intestinal fibroblasts of IBD patients [n = 7] and controls [n = 3]. [C] For quantification LC3BI and LC3BII signals of IBD patients [n = 7] and controls [n = 3] were normalized to the α-tubulin signal. Bar graphs show the mean ± SEM ratio of LC3BII and LC3BI. Student’s t-test was applied for statistical analyses. *p ≤ 0.05; ***p ≤ 0.001.](https://oup.silverchair-cdn.com/oup/backfile/Content_public/Journal/ecco-jcc/18/3/10.1093_ecco-jcc_jjad164/1/m_jjad164_fig8.jpeg?Expires=1750195593&Signature=n87bJ1rjiwY4-rr6DTYEGkr-AVFWCUHXBcBNy5DmBKiw6OlOBTk5Xix0NhrO7T-PHOrbk6ZaCbCA4Ps7nyUQcfis1knBxI1NRLenpuYfLSzUcpmpFtd5jiOFRW4rDm5xgsNu6H8-G137ElEQvqN-Lipwd1GE0cqpDbMH3vNK0h7N~T4vpR7xtLoExl8tFmwen~CHP~Aq8MTtKAI8FoYsIstJVJBxhpg0c29FL9o26qq130Rdx18pdohxqhKD-wHdh7ABStLC6rb4J05dAWm-iDiOgk78xCDqS9mE-0TclVejjT5djnXMiCCERfBsyzSCRsgbyTCBznFkMChG5hnDow__&Key-Pair-Id=APKAIE5G5CRDK6RD3PGA)
NLRP3 inhibition leads to increased induction of autophagy in human intestinal fibroblasts. [A] Cell death of IL-36γ- and IL-1β-stimulated and NLRP3 inhibitor- [10 µM] treated intestinal fibroblasts from IBD patients [n = 11] was analysed. Bar graph shows the mean absorption ± SEM. [B] Representative immunoblot analysis of LC3BI and LC3BII protein expression of IL-36γ- and IL-1β-stimulated and NLRP3 inhibitor-treated human intestinal fibroblasts of IBD patients [n = 7] and controls [n = 3]. [C] For quantification LC3BI and LC3BII signals of IBD patients [n = 7] and controls [n = 3] were normalized to the α-tubulin signal. Bar graphs show the mean ± SEM ratio of LC3BII and LC3BI. Student’s t-test was applied for statistical analyses. *p ≤ 0.05; ***p ≤ 0.001.
4. Discussion
The crucial role of NLRP3 inflammasome activation in regulating processes of the innate immune system is well established. Published data suggest the involvement of an NLRP3 overactivation in the immunopathogenesis of many immune-related diseases, among them IBD.40,53 However, the exact contribution of NLRP3 in the immunopathogenesis and perpetuation of IBD is incompletely understood.
In this study, we demonstrated a decreased secretion of the proinflammatory cytokines IL-1β and IL-18 after NLRP3 inhibition by blood cells from IBD patients. As reported previously, IL-1β, the effector molecule of NLRP3 inflammasome activation, represents a very potent proinflammatory cytokine playing a central role in the pathogenesis of IBD.54 A pathologically increased IL-1β concentration in the intestinal mucosa seems to enhance the permeability of the epithelium and the production of other proinflammatory cytokines and chemokines.55,56 IL-1β-mediated intestinal inflammation results in the recruitment of additional immune cells. Furthermore, pathologically increased IL-1β production in the intestinal mucosa leads to the accumulation, survival, and proliferation of pathogenic CD4+ T cells, which have been identified as important mediators in the immunopathogenesis of IBD.4 Complementary to the functional role of IL-1β in the immunopathogenesis of IBD, a correlation of high IL-1β concentrations in intestinal tissues of IBD patients with disease activity as well as tissue lesions has been previously shown.57 In the present study, we described for the first time a significantly increased NLRP3 protein expression in inflamed intestinal tissue compared to not inflamed tissue from IBD patients and control tissue, demonstrating a correlation between increased NLRP3 protein expression and mucosal inflammatory activity. Moreover, we observed a significant reduced level of cleaved mucosal IL-1β after NLRP3 inhibitor treatment. This is relevant, given that IL-1β is an important mediator in intestinal inflammation of IBD patients.58 Moreover, it highlights NLRP3 inhibition as a potential target for future therapeutic approaches in IBD. Interestingly, the presence of predominantly IL-1β-driven intestinal inflammation in IBD is associated with nonresponsiveness to existing therapeutic options.16,17 Our findings support the concept that this subgroup of patients could benefit from NLRP3 inhibition. Furthermore, we assume the NLRP3 inhibition to be specific for IL-1β and probably IL-18 secretion and not for other proinflammatory cytokines of the IL-1 superfamily. In the context of potential immunosuppressive side effects, this is a desirable feature of selective NLRP3 inhibition as a therapeutic strategy. Suppressing mucosal IL-1β secretion in chronic intestinal inflammation by NLRP3 inhibition in comparison to the potential use of the IL-1 receptor antagonist anakinra might offer potential advantages. Inhibition of a hyperactive NLRP3 inflammasome would abolish the pathologically increased IL-1β secretion but would have no impact on the NLRP3-independent IL-1β secretion. In contrast, antagonizing the IL-1 receptor via anakinra would disable the entire IL-1 signalling cascade, which might be associated with heightened systemic immunosuppression-associated side effects. Furthermore, anakinra is applied subcutaneously, whereas the NLRP3 inhibitor is a small molecule, oral intake of which is favoured by many patients. So far, only one clinical trial targeting the IL-1 axis has been performed, where addition of anakinra to current standard of care with intravenous corticosteroid application in patients with acute severe UC did not reduce the need for rescue therapy or colectomy.59 Further trials in IBD patients are awaited.
So far, tissue-specific gene expression of NLRP3 in the intestine of IBD patients has not been studied in detail. Here, for the first time, single cell analysis of LPMCs from IBD patients, which are very heterogeneous in composition, identified NLRP3 gene expression in nearly all cell clusters. The study addressed in which cluster colocalization of NLRP3 and IL-1β, the downstream effector protein of the NLRP3 inflammasome activation, can be detected. Our data revealed an overlapping expression of NLRP3 and IL-1β in the classically activated macrophage cluster. These results are consistent with previously published data as CD14+ macrophages with a classically activated macrophage phenotype are effector cells in the proinflammatory immune response, characterized by a strong secretion of IL-1β, IL-6, and TNF-α.60 Our findings link the NLRP3 expression in heterogenous LPMCs from IBD patients and the proinflammatory IL-1β expression in classically activated macrophages. Furthermore, we demonstrated upregulation of the NLRP3 inflammasome protein expression of NF-κB-dependent signalling in unstimulated intestinal CD14+ monocytes/macrophages from IBD patients. Increased expression of the NLRP3 inflammasome indicates an enhanced activation of NLRP3 in human intestinal CD14+ monocytes/macrophages from IBD patients compared to controls, whereas components of other inflammasomes [e.g. NLRP1 and AIM2] have not differed. In addition, we detected a significantly increased colocalization of NLRP3 and CD163, a monocyte/macrophage marker, in inflamed tissue from IBD patients. These findings highlight the important role of NLRP3, particularly in monocytes and macrophages, in the perpetuation of IBD.
In the past the initial research of the NLRP3 inflammasome referred to immune cells. However, the involvement of NLRP3 in fibrotic processes has recently emerged.61 Pathological proliferation of connective tissue cells is also attributed to immunological processes and, depending on the progression of the fibrotic processes, might lead to an impaired organ function.62 Previously a link between the activated NLRP3 inflammasome and the profibrotic phenotype of fibroblasts in heart or lung tissue was shown.43,44 In accordance with this, we showed an increased co-expression of NLRP3 and α-SMA in inflamed intestinal tissue from IBD patients. α-SMA-positive cells represent an activated subpopulation of fibroblasts and are significant effector cells of fibrogenic activity in tissue, which might indicate involvement of NLRP3 in fibrotic processes of the intestine. In the context of fibrotic remodelling processes in intestinal tissue, the reciprocal interaction of cytokine-secreting immune cells and fibroblasts has already been reported.63
Proinflammatory and profibrotic cytokines, including IL-1β, IL-36, IL-18 and TGF-β, contribute to fibroblast activation and proliferation.25,64,65 We demonstrated that NLRP3 inhibition reduces the proliferation of activated fibroblasts. Activated proliferating fibroblasts produce large amounts of extracellular matrix triggered by persistent proinflammatory and profibrotic stimuli, which leads to pathological structure remodelling in the intestine and to the progression of intestinal fibrosis.22,24 So far, no proven pharmacological intervention targets the pathological production of intestinal collagens, strengthening our finding that NLRP3 inhibition resulted in a marked reduction of collagen I and collagen VI production of intestinal fibroblasts.
It has already been described that autophagy leads to collagen degradation.66 Interestingly, the mechanism of autophagy and the NLRP3 signaling pathway affect each other reciprocally. Depending on the cell type and tissue, autophagy and the NLRP3 signalling pathway correlate positively or negatively.67–70 In IBD, the induction of autophagy in intestinal fibroblasts leads to collagen degradation and might serve as a novel therapeutic strategy targeting intestinal fibrosis.71 Importantly, we demonstrated that NLRP3 inhibition in intestinal fibroblasts from IBD patients induces autophagy in these cells. In addition, we showed that fibroblasts underwent nonapoptotic cell death after NLRP3 inhibition. Therefore, we speculate that autophagy-dependent cell death might be induced.
In summary, our results highlight a crucial role of NLRP3 in the development and perpetuation of intestinal inflammation in IBD, indicating a potential new therapeutic approach of NLRP3 inhibition in IBD. Based on our findings we propose the following mechanism of NLRP3 inhibition in IBD [Figure 9]. Chronic intestinal inflammation is caused by persistent proinflammatory stimuli, which in turn leads to tissue damage, resulting in activation and proliferation of intestinal fibroblasts. The increased activity status results in autocrine signal transduction in fibroblasts, which maintains the activity. Consequently, pathological amounts of ECM components are produced. More collagen is synthesized than degraded, resulting in fibrotic structures and stenoses formation. On the one hand, NLRP3 inhibition blocks secretion of proinflammatory IL-1β and IL-18. As a result, IL-1β-driven intestinal inflammation is attenuated and therefore fibroblasts are less activated, leading to decreased proliferation of activated intestinal fibroblasts and reduced production of ECM components, such as collagens. Therefore, we suggest that this mechanism prevents the formation of fibrotic structures. In addition, NLRP3 inhibition induces autophagy in intestinal fibroblasts, presumably allowing degradation of already synthesized collagens. These findings suggest NLRP3 inhibition as a potential pharmacological target for IBD treatment, in particular to prevent fibrosis, structure remodelling in the intestine, and thereby intestinal stenosis formation.
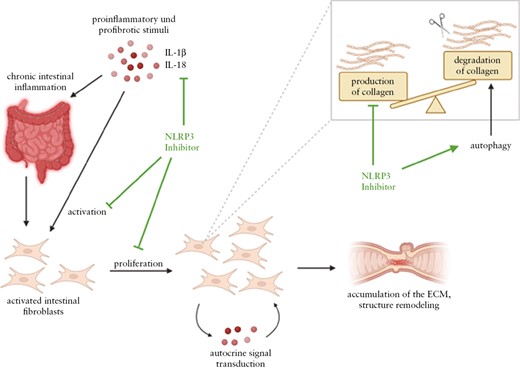
Molecular mechanism of NLRP3 inhibition in IBD. Chronic intestinal inflammation is induced by persistent proinflammatory stimuli, resulting in activation and proliferation of intestinal mesenchymal cells. Their increased activation status probably results in autocrine signal transduction in mucosal fibroblasts, which maintains the high activation status. Consequently, pathological amounts of extracellular matrix components are produced by the fibroblasts. Collagen synthesis predominates degradation of these proteins. First, the NLRP3 inhibitor inhibits the secretion of the proinflammatory cytokines IL-1β and IL-18 of intestinal immune cells. As a result, intestinal fibroblasts are less activated, leading to decreased proliferation. Therefore, the production of extracellular matrix components, as collagens, also decreases, resulting in less structure remodelling in the intestine. This prevents the formation of fibrotic structures. In addition, the NLRP3 inhibitor induces autophagy, presumably allowing degradation of already synthesized collagens. Created with BioRender.com
Funding
This work was funded by the FIBROTARGET project. The FIBROTARGET project has received funding from the European Union’s Horizon Europe Research & Innovation programme under grant agreement No. 101080523. Funded by the European Union. The views and opinions expressed, however, are those of the author[s] only and do not necessarily reflect those of the European Union or European Health and Digital Executive Agency [HADEA]. Neither the European Union nor the granting authority can be held responsible for them. This work was funded by the Deutsche Forschungsgemeinschaft [DFG] grant CRC1181 C02 and CRC/TRR241 [Project-ID375876048] C02 and IBDome and KFO 5024 B04 to R.A. DFG grant TRR305_B05 [project-ID 429280966] to E.N. and DFG grant FOR 2438-2 [project-ID 280163318] to E.N. The laser scanning microscope Leica Stellaris 8 was funded by DFG grant CRC1181 Z02.
Conflict of Interest
The authors declare that the research was conducted in the absence of any commercial or financial relationships that could be construed as a potential conflict of interest.
Acknowledgments
The authors are thankful for excellent support by the FACS Core Unit and the Optical Imaging Center [OICE] of the University Hospital of Erlangen.
Author Contributions
SW, ALV, LS, AW, SR, VSS, and EN performed the experiments. SW, ALV, SS, LS, AW, TR, AN, SZ, LF, AWO, SS, SR, AH, PE, CH, KW, RG, CN, VSS, EN, AE, CB, MN, and RA provided clinical samples, protocols, reagents, or designed experiments. SW, SS, MFN, and RA analysed and interpreted the data, and drafted the manuscript. All authors critically revised the manuscript for important intellectual content.
Data Availability
The data underlying this article are available in the NCBI’s GEO and can be accessed under accession numbers GSE230535, GSE230539, and GSE230419.
References
Author notes
Simone Weber and Selina Sitte contributed equally to this work.
Markus F Neurath and Raja Atreya contributed equally to this work.
Current address: Department of Pediatric Surgery, University Medicine Greifswald, Greifswald, Germany
