


Abstract
Home self-injection of the human anti-tumour necrosis alpha [anti-TNFα] monoclonal adalimumab complicates prospective serial-sampling studies. Although a recent study examined adalimumab levels and immunogenicity in Crohn’s disease [CD] patients, prospective real-world data from ulcerative colitis [UC] patients are lacking.
A three-monthly home-visit programme from induction was established prospectively for UC patients. Clinical scores were determined at each visit, and sera were obtained for assessment of drug and anti-adalimumab antibody levels. Calprotectin was measured using a smartphone-based app. This cohort was compared to a parallel prospective cohort of adalimumab-treated CD patients [POETIC1].
Fifty UC patients starting adalimumab [median follow-up 28 weeks] were compared to 98 adalimumab-treated CD patients [median follow-up 44 weeks]. Only 11/50 UC patients [22%] continued treatment to the end of the follow-up compared with 50/98 [51%] CD patients (odds ratio [OR] = 0.27, p = 0.001). Loss of response was significantly more common in UC patients [OR = 3.2, p = 0.001]. Seventeen patients [34%] in the UC cohort developed anti-adalimumab antibodies, 9/17 [52.9%] as early as week 2. There was no difference between patient cohorts in the overall development of anti-adalimumab antibodies [34% vs 30.6%, respectively, OR = 1.67, p = 0.67], nor was there a difference in early immunogenicity [OR = 1.39, p = 0.35]. There was no difference in low drug levels [<3 µg/mL] between the two cohorts [OR = 0.87, p = 0.83].
Loss of response to adalimumab therapy was significantly more common in the UC compared to the CD cohort and was driven by a higher rate of non-immunogenic, pharmacodynamic parameters.
1. Introduction
Adalimumab is a human monoclonal antibody designed to bind tumour necrosis factor [TNF]-α, thereby attenuating inflammation in auto-inflammatory disorders such as Crohn’s disease [CD] and ulcerative colitis [UC]. The efficacy of adalimumab in the treatment of moderate-to-severe UC has been proven in clinical trials and real-life studies.1–3 Specifically, the drug has proved successful in a randomized control trial [RCT] that examined the effect of adalimumab in adult patients clinically active on steroids or immunomodulator therapy in addition to biologics.4 Based on the results of the ENVISION I phase III trial, adalimumab has been approved for use in patients with UC aged 5–17 years.5
Despite the successful trials, data regarding optimal dosing in UC and patient selection remain inconclusive. The self-injected route of administration poses a challenge to the study of pharmacodynamics and immunogenicity among UC patients treated with adalimumab. Most currently available data are derived from cross-sectional studies in inflammatory bowel disease [IBD] and other auto-immune diseases that reported a single time-point measurement of drug and anti-adalimumab antibodies [AAAs]. This was either during induction or maintenance treatment, which limits the generalization of the findings.6–9 A recent Belgian trial found that many adalimumab-treated UC patients benefited from escalating their initial dosage of 40 mg adalimumab every other week to a weekly dosage of 40 mg subcutaneously.6,9 The large-scale phase III trial SERENE has further emphasized the potential of a weekly 40-mg dosage.10
The efficacy of adalimumab therapy is more established for CD than for either adult or paediatric UC patients. In accordance with the results of the Belgian trial, a large meta-analysis demonstrated that CD patients may also benefit from shorter intervals between treatments.11–13 Our recent evaluation of adalimumab drug levels and immunogenicity over time in CD patients revealed that AAAs arise earlier than previously appreciated and that they are associated with primary non-response, more than with secondary loss of response.14 However, whether the pharmacokinetics of adalimumab among UC patients differ from those of CD patients, and how they impact the clinical outcome remain unclear. This prospective study was designed to assess adalimumab drug and antibody levels and assess the relationship with clinical biomarker outcomes in a real-life cohort of UC patients. The secondary objective was to compare the pharmacodynamics of adalimumab in UC and CD patients.14
2. Methods
2.1. Patient population
UC patients treated with adalimumab at an initial dosage of 40 mg every other week were recruited prospectively from four medical centres in Israel between 2014 and 2021. Potential optimization of treatment by an increase of the drug regimen to weekly dosage of 40 mg adalimumab was based on the treating physician’s discretion.
Each patient enrolled in the study was visited at home by a physician at weeks 0, 2, and 14 of adalimumab therapy and every 12 weeks thereafter. Additional visits were performed upon clinical worsening or change in therapy. Each visit took place before adalimumab administration [at trough] and included a proactive update on medications and clinical interventions, a clinical score evaluation, and drawing blood for assessment of adalimumab and AAA levels. The home-visit programme continued for all patients until adalimumab therapy cessation or end of the study period, with at least 54 weeks of follow-up for each patient maintaining therapy.
Data collected during the trial included levels of sera adalimumab, AAAs, and stool calprotectin throughout weeks 2, 14, 28, 38, and 54, or until the end of follow-up or loss of clinical response. Clinical scores were obtained at each time-point as well as changes in therapeutic regimen, infections, and hospitalizations [where data were collected reactively]. Patients who lost clinical response were defined as undergoing ‘loss of response’, while patients who did not achieve any clinical remission were defined as non-responders.
The study was approved by the ethics committees of the participating centres and all patients signed an informed consent form.
2.2. Inclusion criteria
Inclusion criteria were a previously established diagnosis of UC as per endoscopy and histology, and individuals older than 18 years, naïve to adalimumab therapy.
2.3. Exclusion criteria
Exclusion criteria were patients who had undergone total proctocolectomy for UC and had pouchitis, and insufficient clinical/laboratory follow-up.
2.4. Clinical scores
Clinical status was determined by the simple clinical colitis activity index [SCCAI], with clinical remission defined as SCCAI < 2.5 points.15 Non-response was defined as cessation of adalimumab therapy by week 14 due to the lack of clinical response as defined above. Responders were defined as those reaching clinical remission by the end of follow-up with a minimal follow-up of 24 weeks.
2.5. Calprotectin measurements
Calprotectin was assessed based on a home stool smartphone-based kit [‘Calprosmart’ by ‘SVAR’, Norway]. In cases of exacerbations, calprotectin was assessed at the hospital using a quantum-blue enzyme linked immunosorbent assay [ELISA].16–18
2.6. Therapeutic drug monitoring
Serum samples were routinely and systematically collected at trough, and before adalimumab injections at weeks 0, 2, 14, 28, 38, and 54. An undetectable adalimumab level was defined if sera levels were <1 µg/mL. Adalimumab and AAA levels were measured by a drug-tolerant assay at Sheba Medical Center. Transient AAAs were defined as AAAs that appeared during the course of adalimumab therapy, but were not associated with clinical worsening, and then disappeared after no more than two consecutive measurements without intervention.
AAA levels were considered significant if ≥2 µg/mL [3SD from mean antibody levels in healthy controls].
2.7. Comparative analysis with the POETIC 1 cohort
Comparative data were drawn from the prospective cohort of CD patients comprising the POETIC 1 study. Like the CD cohort, the UC cohort in the POETIC 1 study were treated with 40 mg adalimumab every other week.14
The POETIC 1 study also included a parallel programme of home visits by physicians at induction and every 3 months. Additional visits were scheduled at events of relapse. At each visit, the patients’ clinical scores were determined, and sera were obtained for measurement of levels of drug, AAAs, and C-reactive protein [the last is not relevant for comparison for this study and is therefore not addressed here].14
2.8. Statistical analysis
Continuous variables were expressed as median and interquartile range [IQR]. A Mann–Whitney test was used to compare continuous variables and Fisher’s exact test was used when comparing categorical data. Multivariable analysis was performed using backward logistic regression. Kaplan–Meier curves were plotted to assess the temporal rate of events, and a log-rank test was computed for the comparison between survival-free durations.
All reported p values were two sided, and a p value of <0.05 was considered statistically significant. All statistics were performed with MedCalc software [version 12.2.1.0].
3. Results
Fifty UC patients starting adalimumab therapy were prospectively followed [median follow-up 28 weeks, IQR 12–54 weeks] and compared to 98 CD patients from the POETIC 1 study. The demographic and clinical parameters of the two cohorts are presented in Table 1. Multivariable analysis of variables statistically different between the cohorts at baseline [disease type, gender, age, and smoking], in association with loss of response to adalimumab was conducted and data are presented in Supplementary Table 1. There was no significant difference between the cohorts in baseline parameters, other than IBD subtype [p = 0.0045].
Clinical and demographic parameters of the Crohn’s disease [CD] [left] and ulcerative colitis [UC] [right] cohorts
| Parameter | UC cohort [N = 50] | CD cohort [N = 98] | Odds ratio | p-value |
|---|---|---|---|---|
| Gender male [n, %] | 24 [48] | 59 [60.2] | 2.26 | 0.014 |
| Age [median ± IQR, years] | 37 [34.0–46.9] | 35 [31.7–38.0] | — | 0.008 |
| Disease duration [median ± IQR, years] | 9.5 [6–18] | 8 [3–15] | — | 0.049 |
| Median age at diagnosis [median ± IQR, years] | 26 [21.0–40.5] | 23 [18–36] | — | 0.017 |
| Median weight at induction [median ± IQR, kg] | 67 [59.5–81.5] | 67 [59.3–79] | — | — |
| Median BMI at induction [median ± IQR] | 21.7 [19.4–26.3] | 22.8 [20.4–25.3] | — | — |
| Concomitant immunomodulator therapy [n, %] | 7 [14] | 24 [24.6] | 1.99 | 0.14 |
| Concomitant steroid therapy [n, %] | 3 [6] | 14 [14.3] | 2.61 | 0.14 |
| Extra-intestinal manifestations [n, %] | 17 [48] | 30 [30.6] | 0.85 | 0.67 |
| Smoking at induction [n, %] | 1 [3.0] | 20 [20.4] | 12.56 | 0.015 |
| Smoking at diagnosis [n, %] | 3 [10.3] | 21 [21.4] | 4.27 | 0.024 |
| Comorbidities [n, %] | 19 [55.8] | 21 [21.4] | 0.44 | 0.033 |
| Prior immunomodulator therapy [n, %] | 26 [54.1] | 61 [62.0] | 1.39 | 0.35 |
| Prior infliximab therapy [n, %] | 19 [39.5] | 35 [36.0] | 1.16 | 0.86 |
IQR, interquartile range; BMI, body mass index.
3.1. Adalimumab therapy in UC patients—prospective monitoring
The UC cohort was monitored for levels of drug, AAAs, and stool calprotectin as well as clinical scores from initiation of adalimumab therapy and through weeks 2, 14, 24, 38, and 54 of therapy or until the end of follow-up [ Supplementary Table 2]. Optimization of treatment by an increase of the drug regimen to weekly dosage of 40 mg adalimumab occurred in 36% [18/50] of patients, 40% [12/30] of non-responders vs 30% [6/20] of responders [p = 0.47] [Figure 1 and Table 2].
Clinical and demographic parameters of ulcerative colitis [UC] patients responding [right] and not responding to treatment [left]
| UC non-responders [primary and secondary] | UC responders | p-value | ||
|---|---|---|---|---|
| Number of UC patients, N [%] | 60% [30] | 40% [20] | — | |
| Location of disease at start of treatment | Local colitis [proctitis and extensive colitis] | 41% [11/27] | 66% [10/15] | 0.11 |
| Extensive colitis | 59% [16/27] | 33% [5/15] | 0.11 | |
| ± | Immunomodulators | 20% [6/30] | 5% [1/20] | 0.16 |
| Steroids | 10% [3/30] | — | — | |
| Shortening of adalimumab therapy* | 40% [12/30] | 30% [6/20] | 0.47 | |
| AAA at week 2 [%] | 26.6% [8/30] | 5% [1/20] | 0.08 | |
| AAA levels at week 2, median, IQR [µg/mL] | 0.95, 0.52–2.0 | 0.685, 0.44–0.92 | — | |
| AAA at end of follow-up | 43.4% [13/30] | 20% [4/20] | 0.09 | |
| Previous treatments | ||||
| Previous medication use | Immunomodulators | 53% [16/30] | 45% [9/20] | 1.39 |
| 5-Aminosalicylic acid | 93% [28/30] | 70% [14/20] | 0.04 | |
| Infliximab | 40% [12/30] | 35% [7/20] | 0.72 | |
| Vedolizumab | 23% [7/30] | 20% [4/20] | 0.78 | |
| Previous abdominal surgeries | 10% [3/30] | 10% [2/20] | 1.00 | |
*Adalimumab therapy regimen was shortened to 40 mg weekly as per the treating physician’s decision.
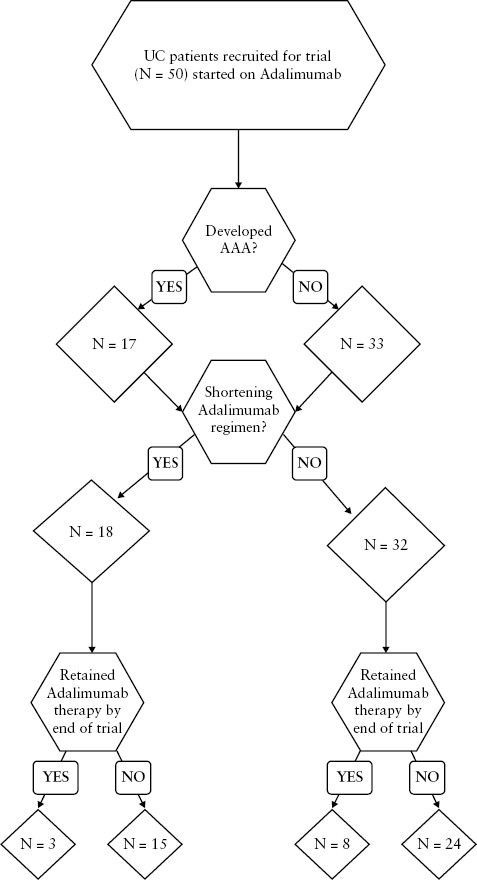
UC patient cohort flowchart.
There was a trend towards developing AAAs among non-responders as early as week 2 (26.6% [8/30] vs 5% [1/20] for responders, odds ratio [OR] = 6.90, p = 0.08). This trend continued until the end of follow-up for each patient [followed until AAA appearance or at least 24 weeks of therapy], with AAAs more frequent among non-responders compared to responders (43.4% [13/30] vs 20% [4/20], respectively, OR = 3.05, p = 0.09). The median AAA level was 7.21 µg/mL [IQR 3.98–23.07 µg/mL]. The median time to AAA appearance was 6 months.
3.2. Adalimumab immunogenicity and therapy outcome in UC vs CD patients
The prospective cohort of 50 UC patients was compared to a prospective cohort of 98 adalimumab-therapy CD patients [median follow-up 44 weeks, IQR 16–79 weeks]. Table 1 provides demographic and clinical parameters in both cohorts.
Week 2 trough levels did not differ significantly between UC and CD patients [p = 0.8, Supplementary Table 3]. There was also no difference in number of patients who presented with low trough levels, defined as trough <3 µg/mL in both cohorts (CD vs UC, 9.1% [9/98] and 8% [4/50] respectively, OR = 0.87, p = 0.83).
Despite this, both UC and CD cohort responders had higher adalimumab trough levels than non-responders, even at week 2 of treatment [UC week 2 trough level median 6.8 µg/mL vs 5.5 µg/mL in responders vs non-responders, respectively, p = 0.03; see interquartile graphical illustration in Figure 2]. Similar findings were observed for the CD cohort [week 2 trough level median 6.65 µg/mL vs 4.65 µg/mL in responders vs non-responders, respectively, p = 0.004]. A trough level at week 2 of <7.8and. 6.54 µg/mL could predict loss of response with 84.6% and 84.5% sensitivity in the UC and CD cohorts respectively (UC cohort area under the curve [AUC] = 0.73 p = 0.003, CD cohort AUC = 0.71 p < 0.001) [Figure 3].
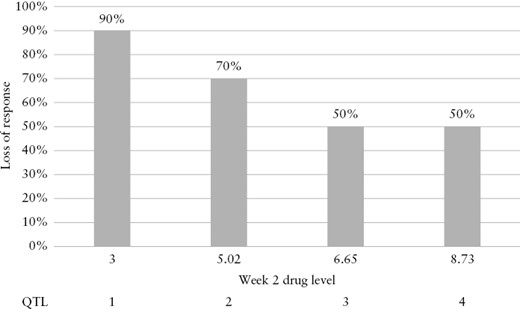
Quartile analysis of adalimumab concentration at week 2 vs loss of response.
![[A] Receiver operating characteristic [ROC] curve of trough levels at week 2 in the UC cohort, responders vs non-responders. [B] ROC curve of trough levels at week 2 in the CD cohort, responders vs non-responders.](https://oup.silverchair-cdn.com/oup/backfile/Content_public/Journal/ecco-jcc/18/3/10.1093_ecco-jcc_jjad156/1/m_jjad156_fig3.jpeg?Expires=1750349240&Signature=NoFK2IDyVQYhcVmIzW8vOaieOSv3~d6v3tbZVBpkgy5~8tBi5JvaX9KocwTYx3MiCnJIaSOoh4rGAwLkuuCYq~fNdguHPKzSy1pKRgyUsYV4~CXcrNkL306pbp6eO4Afl1zZEltW0qAtDoqhmktjyKGsG-njw9wNlZYBDfYTw1jZCiFUyVn8KGQHRI5NSY29dQSgLfp3KxZn1CW4Hl5MWSNEqWAJUjILZZKXZe2fZnUGnqTJ3Iju81RTYGuKrQQ-5fqddEQ92XBJ0JgVzaA9hZONQERPap~XInQRrDNNK31poKE-jDqsnvKCWh82VChkh8z6eEdIK9PyACm1qeQcYw__&Key-Pair-Id=APKAIE5G5CRDK6RD3PGA)
[A] Receiver operating characteristic [ROC] curve of trough levels at week 2 in the UC cohort, responders vs non-responders. [B] ROC curve of trough levels at week 2 in the CD cohort, responders vs non-responders.
In later weeks of the trial, there was a statistically significant difference in trough drug levels between the two cohorts over 24 weeks of therapy [Supplementary Table 3]. However, later, during maintenance therapy, a significant difference in serum drug levels was observed between the groups: trough levels at weeks 36, 48, and 54 were higher among UC patients than CD patients [Figure 4; Supplementary Table 3, Supplementary Figure 1].
![Adalimumab serum levels throughout therapy [weeks 2–54] in the UC and CD cohorts.](https://oup.silverchair-cdn.com/oup/backfile/Content_public/Journal/ecco-jcc/18/3/10.1093_ecco-jcc_jjad156/1/m_jjad156_fig4.jpeg?Expires=1750349240&Signature=NQaQ-f3RFQrT38FLsW5Bd9xLtO2Mcdts4uao5t6AS5zMKwjeMBDe~emLm9Yl2-xlshZtb3CYNoSQ2HFt1qzuCUecN3W48SJTgCFaZbMezlW9l9y9p2-WTgjmup4aOMhxKXr3oxa0j~qK82ulPMf4xLGTX0Q6wRoqPfzxeZqJ8DcFbNsEBbeCFv-o6Fs5ouTVw8QtPjBYvJR4z1Jh5WBajsz903f3mZVAsKZT99Z-rbT48oU8~K-7EhKfacgRP5r1naapw5wqkvbs6GaVnG0sP5DeetKXyeUxiUJfoG2jlk-QudaGclTzyq47~3QmH7o4FmTD0gKeXJvzlYwtVjHxPw__&Key-Pair-Id=APKAIE5G5CRDK6RD3PGA)
Adalimumab serum levels throughout therapy [weeks 2–54] in the UC and CD cohorts.
The frequency and levels of AAAs were also compared between the two IBD subtypes. There was no major difference in the number of patients producing antibodies in the two study cohorts [30.6% in CD patients vs 34% in UC patients, OR = 1.677, p = 0.67, Figure 5A]. In addition, the frequency of transient antibodies was similar in the two cohorts [OR = 2.11, p = 0.18].
![[A] Rate of anti-adalimumab antibody [AAA] development in the CD and UC cohorts. [B] Primary and secondary loss of response in UC vs CD patients.](https://oup.silverchair-cdn.com/oup/backfile/Content_public/Journal/ecco-jcc/18/3/10.1093_ecco-jcc_jjad156/1/m_jjad156_fig5.jpeg?Expires=1750349240&Signature=B2D5I6GSlX4o-hpJ5~UcQLk5sRvyN1rRAxYd8ifpt9Tqzz5XGe~NwRXhci~xlbvHTIwQOFjzrJUcCQk~ZWfy1iMEZB68n1iKxiKPQqZMjpySJ~9vu~LmZ8LKcmPR6YTd1Ykx8Y868rKZIgMnhijjawRR1w31SoixSkwUqWzu3DjjkhoA0rBqYW00Cb60FilUw7UhC~lSHhfetoqCTrm4p9SUqhLJ3Cssclkgtk5mpthTav1X7M4R1MPnkcl2c5Ul-BsjRXBe6ZZThI~0KeX5YycCayx6qcbRa1Op-gpHrzPA1aDfXzolcL60KxwnkR-XHLarpPwtEpBIHGx~ifQR8A__&Key-Pair-Id=APKAIE5G5CRDK6RD3PGA)
[A] Rate of anti-adalimumab antibody [AAA] development in the CD and UC cohorts. [B] Primary and secondary loss of response in UC vs CD patients.
There were significantly more primary non-responders on adalimumab therapy in the UC cohort compared to the CD cohort [UC 20/50 vs CD 11/98, OR = 5.27, p = 0.0001]. Similarly, secondary loss of response was significantly more frequent among UC patients compared to the CD cohort [60% vs 36% in UC and CD respectively, OR = 3.2, p = 0.001]. Loss of response was not only more prevalent in the UC cohort, but also tended to occur significantly earlier than in the CD patients [OR = 4.6, p = 0.0005, Supplementary Table 3; Table 3, Figure 5B]. Similarly, up to week 24, clinical remission was more common in the CD cohort [clinical remission—week 14: 59/90 vs 2/31, OR = 6.79, p = 0.0001; week 24: 53/74 vs 16/34, OR = 2.83, p = 0.015, for CD and UC respectively]. Nevertheless, this difference diminished during weeks 38–54, accompanied by a significant decrease in the number of patients maintaining therapy in the UC cohort [Supplementary Table 3; Figure 6].
Clinical remission rates for Crohn’s disease [CD] [left] and ulcerative colitis [UC] [right] patients throughout follow-up [54 weeks]
| % CD patients reaching remission [N] | % UC patients reaching remission [N] | Odds ratio | p-value | |
|---|---|---|---|---|
| Week 14 | 65% [59/90] | 21% [7/32] | 6.79 | 0.0001 |
| Week 24 | 71% [53/74] | 47% [16/34] | 2.83 | 0.015 |
| Week 38 | 57% [37/65] | 66% [10/15] | 0.66 | 0.49 |
| Week 54 | 76% [39/51] | 71% [10/14] | 1.3 | 0.69 |
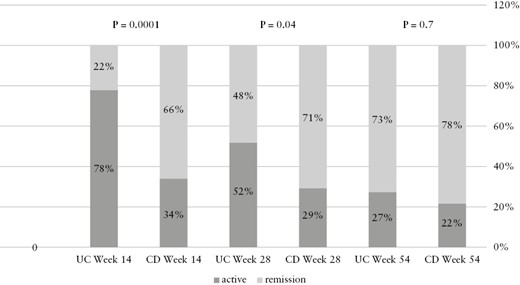
Clinical status in CD vs UC patients throughout therapy.
4. Discussion
The current study prospectively followed the clinical parameters, and the levels of drug, anti-drug antibodies, and inflammatory markers in 50 UC patients starting adalimumab therapy. This cohort was compared to a similarly treated prospective cohort of 98 CD patients. Both UC and CD cohort responders had higher adalimumab trough levels than non-responders, even by week 2 of treatment. Trough levels at week 2 of <7.8 and 6.54 µg/mL in UC and CD cohorts respectively could predict loss of response with over 84% sensitivity [Figure 2].
This correlates with a previous study that reported that adalimumab concentrations of ≥4.58 μg/mL at week 4 could predict a response of UC patients to adalimumab therapy by week 12.19 Similarly, another study demonstrated that patients who achieved short-term mucosal healing had higher adalimumab levels at week 4.20 Notably, a study that examined further endpoints of remission reported significantly higher mean serum adalimumab concentrations in patients who achieved not only clinical response [10.8 vs 8.0 μg/mL, p = 0.004] and remission [11.7 vs 8.3 µg/mL, p = 0.007], but also mucosal healing [11.0 vs 8.5 µg/mL, p = 0.010].21 This further endorses our suggestion that higher adalimumab induction levels may be required for optimal outcomes, especially in UC patients. Furthermore, since week 2 adalimumab trough levels appear to predict therapy outcome in UC patients, it may be beneficial to intensify adalimumab therapy as early as weeks 4 or 6 in UC patients with adalimumab levels <6 µg/mL.
AAAs appeared more frequently at week 2 of adalimumab therapy among non-responders compared to responders.2 The fact that early immunogenicity is a harbinger of future loss of response could potentially allow us to identify patients at risk even after the second administration of adalimumab and then intervene as appropriate [dose escalation/combination therapy]. Nevertheless, the loss of response noted in the current study cannot be solely attributed to formation of AAAs, as only 43% of patients who experienced loss of response exhibited significant levels of AAAs. In addition, the frequency of transient antibody levels was similar in responders and non-responders. This indicates that loss of response to adalimumab by UC patients cannot be attributed solely to factors related to immunogenicity. There was no significant difference in trough levels between the UC and CD cohorts during the first 6 months of therapy. Furthermore, there were no statistically meaningful differences in the frequency of previous anti-TNF therapy in the two cohorts [35% in the UC vs 39.5% in the CD populations, OR = 1.16, p = 0.86]. Neither was there any difference with regard to use of concomitant immunomodulator therapy and induction period immunogenicity. Thus, the differences in rates of response between the groups cannot be attributed to differences in baseline patient parameters. As rates of loss of response were significantly higher for the UC cohort [60% vs 36% for UC and CD, respectively, OR = 3.2, p = 0.001], we postulate that non-immunogenic factors related to UC pathology are responsible for the difference in outcomes. Perhaps a more intensive dose regimen [40 mg weekly] would yield better outcomes for the UC cohort, as suggested by the Leuven group and the SERENE trial.9,10
Analysis of trough adalimumab and antibody levels during the induction and maintenance periods detected no differences in the adalimumab pharmacokinetics in the two IBD conditions. However, from week 36 onwards until the end of the study at week 54, we detected a clear statistical difference, with median trough levels among the UC cohort reaching much higher values. This difference can be explained by the observation that significantly fewer UC patients remained in adalimumab therapy during weeks 36–54 with 30% [15/50] of the total cohort left at week 36 onwards vs 68% [34/50] at week 24. Only the few patients who achieved remission continued treatment past week 36. Hence, we postulate that the 30% of UC patients who continued adalimumab therapy beyond week 36 are a selected subgroup with favourable pharmacokinetics and response to adalimumab therapy.
It is of note that there was no significant difference between the two cohorts in the incidence of infliximab-naïve/experienced patients (36% [35/97] and 39.5% [19/48] infliximab-experienced patients in the CD and UC cohorts, respectively, OR = 1.16, p = 0.86). In addition, there was no significant difference in the incidence of concomitant immunomodulator therapy between the groups (CD vs UC 23.4% [23/98] and 14% [7/50], respectively, OR = 0.53, p = 0.18) nor was there any difference in prior use of immunomodulators (CD vs UC 54.1% [26/48] and 62% [61/98], respectively, OR = 1.39, p = 0.35).
There were a few statistically significant differences between the patients in the UC and CD cohorts. Notably, patients in the UC cohort were statistically significantly older than the CD patients [median 37 years, IQR 34.0–46.9 vs 35 years, IQR 31.7–38.0, p = 0.008]. As a result, there were also more comorbidities in the UC group [55.8 % vs 21.4% in the CD cohort, p = 0.033]. In addition, the UC cohort contained significantly more male patients than the CD population [60.2% vs 48%, respectively, p = 0.014]. In Israel, more males smoke than females [in our study 24.9% vs 12.6%, respectively], which could explain the discrepancy in smokers during diagnosis and on induction.22 This also accords with the finding that CD is associated with smoking, while UC diagnosis is associated with smoking cessation.23
This study has several limitations. First, even though the 50 UC patients represent a large prospective homogeneous cohort, some of the sub-analyses may be limited by cohort size. Second, all four medical centres that recruited patients for this trial were based in Israel, which could affect the heterogeneity of the patients. Nevertheless, there is previous evidence that studies of Israeli patients can be extrapolated to any Caucasian population. Another important limitation is that the effectiveness of treatment relies on clinical response without endoscopic evaluation. Lastly, there were significantly more patients who had been previously treated with infliximab among UC non-responders than among the responders. Although there was no statistically significant difference in the incidence of previous use of immunomodulators or other biologics, it is possible that the non-responders are more resistant to therapy to begin with, and therefore further patient selection could be affecting the study.
To conclude, non-response and loss of response were more common in UC patients treated with adalimumab than in CD patients, although no difference was observed with regard to pharmacokinetics. This indicates that a non-immunogenically based lack of response to adalimumab is more common among UC than CD patients. Conversely, the UC patients who did manage to continue treatment for 36 weeks entered stable clinical remission with favourable pharmacokinetics. Further studies will be required to demonstrate whether an early increase in dose on the one hand and prompt therapy switching in the event of a lack of-response on the other would yield better outcomes for adalimumab therapy in UC patients.
Funding
No funding was used in the study.
Conflict of Interest
This work was supported in part by the 7th Dr. Pinchas Borenstein ‘Talpiot’ Medical Leadership Program, the Chaim Sheba Medical Center [to B.U.], the ‘Talpiot’ Medcial Leadership Program, The Chaim Sheba Medical Center [to S.B.H.], and The Leona M and Harry B Helmsley Charitable trust [to S.H.B.].
Acknowledgments
Our thanks to the nursing team at the Gastroenterology unit at Sheba hospital for assisting with data collection.
Author Contributions
SH drafted the manuscript and was involved in analysis and interpretation of data. BU was involved in study conception, analysis and interpretation of data, and manuscript drafting. SBH conceived the study and guided the manuscript. TN, EB, AH, ES, DY, AA, DC, and UK participated in acquisition of data. CMA, YS, and EF participated in data acquisition and analysis. OHN, MY, and OP participated in laboratory analysis of the data.
Data Availability
The data underlying this article will be shared on reasonable request to the corresponding author.
