


Abstract
Ustekinumab is approved for the treatment of Crohn’s disease [CD]. Systematically registered prospective real-world data are scarce. We therefore aimed to study the effectiveness, safety and usage of ustekinumab for CD in everyday practice.
We prospectively enrolled CD patients initiating ustekinumab in regular care between December 2016 and January 2019. Clinical (Harvey Bradshaw Index [HBI]), biochemical (C-reactive protein [CRP] and faecal calprotectin [FCP]), extra-intestinal manifestations and, peri-anal fistula activity, ustekinumab dosage, concomitant medication use, and adverse events were documented at weeks 0, 12, 24, and 52. The primary outcome was corticosteroid-free clinical remission.
In total, 221 CD patients were included (98.6% anti-tumour necrosis factor [TNF] and 46.6% vedolizumab exposed) with a median follow-up of 52.0 weeks [interquartile range 49.3–58.4]. Corticosteroid-free clinical remission rates at weeks 24 and 52 were 38.2% and 37.1%, respectively. An initial dosing schedule of 8 weeks, compared to 12 weeks, correlated with a lower discontinuation rate [20.0% vs 42.6%, p = 0.01], but comparable corticosteroid-free clinical remission at week 52 (46.3% [q8w] vs 34.6% [q12w], p = 0.20). There was no clinical benefit of combination therapy after 52 weeks when compared to ustekinumab monotherapy [combi 40.6% vs mono 36.0%, p = 0.64]. At baseline, 28 patients had active peri-anal fistula, of whom 35.7% showed complete clinical resolution after 24 weeks. During follow-up we encountered six severe infections [3.5 per 100 patient-years], with all patients being on concomitant immunosuppressant therapies. Ustekinumab treatment discontinuation was observed in 75 [33.9%] patients mainly due to lack of response.
Ustekinumab is a relatively safe and effective treatment option for CD patients with prior failure of anti-TNF and anti-integrin therapies.
1. Introduction
Ustekinumab is a fully human monoclonal antibody targeting the p40 subunit of interleukin-12 and interleukin-23. It has been approved for the treatment of Crohn’s disease [CD] in the Netherlands since November 2016.1 The results of the registration trial [IM-UNITI] showed a 46.9% [vs 29.8% placebo] corticosteroid-free clinical remission rate after 44 weeks of treatment with no significant difference between the 8- and 12-weekly dosing interval. However, a large proportion of patients receiving ustekinumab in the induction studies [64.3% and 47.3% in UNITI 1 and UNITI 2, respectively] were not enrolled in the IM-UNITI maintenance trial due to lack of clinical response to induction therapy. Furthermore, to participate in the UNITI trials, patients had to fulfil over 20 inclusion and satisfy more than 30 exclusion criteria, illustrating a strict trial design that does not accurately reflect routine care.1,2 Therefore, robust real-world effectiveness and safety data are needed.
Real-world observational studies allow for assessment of effectiveness and safety of a treatment used in the general population. To date, the real-world experience of ustekinumab in terms of effectiveness and safety has been assessed in several studies.3–11 However, these studies were limited by short-term follow-up, small sample sizes, retrospective study designs, limited objective outcome parameters, and a variation in induction protocols not comparable with current standard care (e.g. subcutaneous [SC] injections, different doses within and between studies). Hence, systematic, uniform and prospective collected data are warranted in order to interpret the effectiveness and safety outcomes of new therapies. For this purpose, we developed the Dutch Initiative on Crohn and Colitis [ICC] Registry: a nationwide registry for inflammatory bowel disease [IBD] patients starting novel therapies in standard care with a systematic follow-up protocol.
The aim of the current study was to describe the effectiveness, safety and use of ustekinumab treatment in CD patients in a real-life setting using the ICC Registry. Secondly, we aimed to assess predictors of clinical response.
2. Methods
2.1. Study design and setting
The ICC Registry is a nationwide, observational registry with systematic, prospective follow-up of IBD patients starting designated IBD therapies in the Netherlands.12,13 Currently, eight academic centres and three non-academic centres participate in this registry, which started in 2014. The general aim of the ICC Registry is to evaluate the therapeutic effectiveness and safety of specific IBD therapies in a real-world setting. Enrolled patients follow a pre-defined schedule of out-patient visits designed to closely follow regular care. Visits are scheduled at initiation of therapy [baseline], weeks 12, 24, 52 and 104 or until medication is discontinued. Data collection is done using an electronic case report form [eCRF] with automated reminders to improve adherence to the protocol. The eCRF is filled out by the treating physician or IBD nurse at every visit. The ICC Registry platform is used to systematically document the effectiveness and safety of ustekinumab therapy in CD patients.
2.2. Participants
Following formal approval of ustekinumab by regulatory authorities, CD patients initiating this therapy in the Netherlands between November 2016 and January 2019 were enrolled at the participating centres. Patients ≥16 years old were eligible for inclusion with a confirmed clinical, endoscopic and/or histological diagnosis of CD. The decision to start ustekinumab therapy was at the discretion of the treating physician. There were no exclusion criteria. The initial intravenous [IV] infusion with ustekinumab at baseline was weight-based following label [260 mg < 55 kg, 390 mg between 55 and 85 kg, 520 mg > 85 kg]. The first subcutaneous [SC] induction dose was administered at week 8 with a 90 mg injection followed by a subsequent maintenance SC dosing of 90 mg every 8 or 12 weeks, at the discretion of the treating physician. All patients with a follow-up of at least 12 weeks measured from their initial ustekinumab infusion were included in the current study. Patients with clinical disease activity at baseline (e.g. Harvey Bradshaw Index [HBI] > 4) were used to determine the effectiveness outcomes while all enrolled patients were used to determine safety outcomes.
2.3. ICC Registry variables
Documented baseline characteristics included sex, age, weight, height, disease duration, disease behaviour and location according to the Montreal classification at diagnosis and maximum extent at inclusion, previous medication, disease severity [HBI ≤ 4 = remission, 5–7 = mild activity, 8–16 = moderate activity, >16 = severe activity], history of bowel-related surgery and co-morbidities. During the scheduled visits we systematically assessed clinical disease activity using the HBI and physician global assessment [PGA]. Furthermore, information about dosage and concomitant medication use was registered. Disease-related adverse events such as hospitalization, surgery and peri-anal surgery were documented. Medication-related adverse events were classified as probably, possibly and not related. Infections were classified as mild: no use of antibiotics or antiviral mediation necessary; moderate: oral antibiotic or antiviral medication; or severe: hospitalization or IV administrated antibiotics/antiviral medication. Routine laboratory tests were requested at each visit, including C-reactive protein [CRP] and faecal calprotectin [FCP].
2.4. Outcomes and definitions
The primary objective of this study was to determine the proportion of patients in corticosteroid-free clinical remission at week 52. Secondary effectiveness outcomes included: clinical response, clinical remission, biochemical remission, combined corticosteroid-free clinical and biochemical remission [combined end point], fistula response and remission, extra-intestinal manifestation [EIM] remission, ustekinumab treatment escalation, intestinal and peri-anal surgery, and discontinuation of ustekinumab. Corticosteroid-free clinical remission was compared between 12-weekly [q12w] and 8-weekly [or less] [q8w] treatment intervals, between anti-integrin naive and exposed patients, and between patients with and without concomitant immunosuppressive therapy [thiopurines or methotrexate] at baseline. Additionally, predictors of corticosteroid-free clinical remission at week 52 were determined. Clinical remission was defined as HBI ≤ 4 points. Clinical response was defined as a reduction of at least 3 points in HBI compared to baseline. Biochemical remission was defined as a CRP concentration ≤5 mg/L and a FCP level of ≤200 µg/g [when available]. Fistula remission was defined as complete clinical resolution of all peri-anal fistulas at physical examination. Fistula response was defined as a decrease of 50% in the number of actively draining peri-anal fistulas or a decrease in drainage [graded as: spontaneous drainage, drainage after soft manual pressure, and no drainage after manual pressure].14 EIMs that were documented included: arthralgia, uveitis, aphthous stomatitis, erythema nodosum and pyoderma gangrenosum. EIM remission was assessed by the treating physician. Reasons for treatment discontinuation were at the discretion of the treating physician. The safety outcomes included the number of drug-related adverse events, mild, moderate or severe infections [see definitions in previous paragraph], and disease-related hospitalizations per 100 patient-years.
Follow-up time was determined based on the date of the initial IV infusion with ustekinumab until the last visit used in the analysis. Patients who discontinued ustekinumab treatment due to a primary or secondary non-response, adverse events, or at patient request without long-term sustained remission were considered a treatment failure and classified as non-responders. Patients who discontinued ustekinumab treatment because of pregnancy or long-term sustained remission were considered censored cases. Patients with inadequate follow-up time for a specific visit, either responders or non-responders, were considered censored cases and were not included in the analysis of that visit. For example, a patient with 32 weeks of follow-up would have contributed to the 24-week analysis but not the 52-week analysis.
2.5. Statistical methods
Patients were analysed on an intention-to-treat basis. Continuous variables were presented as means with standard deviation [SD] or as median with interquartile range [IQR] depending on the normality of the underlying distribution. Variables were subsequently compared using a paired or independent T-test or Mann–Whitney U test. Categorical variables were presented as percentages and compared by using the chi-square or Fisher’s exact test. The Kaplan–Meier method was used to assess drug survival. Variables associated with week 52 corticosteroid-free clinical remission were explored using binary logistic regression. Multivariate analysis was performed on variables with p < 0.2 on univariate analysis using backward step-wise logistic regression. A two-sided p value of 0.05 or less was considered statistically significant. All data analyses were performed using IBM SPSS Statistics for Windows, version 24.0. [IBM].
2.6. Ethical consideration
The study was reviewed and approved by the Committee on Research Involving Human Subjects at the Radboudumc [institutional review board: 4076].
3. Results
3.1. Baseline characteristics
Patient baseline characteristics are detailed in Table 1. Among the 232 CD patients enrolled in the ICC Registry, 221 were followed for at least 12 weeks and were included in the analysis. Enrolled patients were followed for a median of 52.0 weeks [IQR 49.3–58.4]. Patients were predominantly female [60.2%] with a median disease duration of 12.3 years [IQR 7.5–19.2]. One-third of patients had ileocolonic disease [n = 77/221, 34.8%], and a penetrating disease phenotype was documented in 18.1% [n = 40/221] of the patients at maximum extent of their disease course. In total, 216 patients [97.7%] were previously exposed to thiopurines or methotrexate and 218 patients [98.6%] had failed at least one anti-tumour necrosis factor [anti-TNF] agent. In addition, 162 patients [73.3%] previously failed two or more anti-TNF agents and 103 [46.6%, only one patient was anti-TNF naïve] patients used vedolizumab before initiating ustekinumab treatment. A history of intestinal resections was documented in 137 patients [62.0%] and 47 [21.3%] had a history of peri-anal surgical interventions.
Baseline patient characteristics
| Baseline characteristics | N = 221 | |
|---|---|---|
| Agea | Median [IQR] | 38.2 [29.3–52.2] |
| Sex, male | N [%] | 88 [39.8] |
| Body mass indexa | Mean [SD] | 23.7 [5.0] |
| Disease duration, years | Median [IQR] | 12.3 [7.5–19.3] |
| Follow-up duration, years | Median [IQR] | 52.0 [49.3–58.4] |
| Disease locationb | ||
| Ileum | N [%] | 68 [30.8] |
| Colon | N [%] | 76 [34.4] |
| Ileocolonic | N [%] | 77 [34.8] |
| Upper GI tract involvementb | N [%] | 12 [5.4] |
| Disease behaviourb | ||
| Inflammatory disease | N [%] | 113 [51.1] |
| Stricturing disease | N [%] | 63 [28.5] |
| Penetrating disease | N [%] | 40 [18.1] |
| Unknown | N [%] | 5 [2.3] |
| Peri-anal diseaseb | N [%] | 37 [16.7] |
| Prior intestinal resections | N [%] | 137 [62.0] |
| Prior peri-anal interventions | N [%] | 47 [21.3] |
| Prior anti-TNF therapy | ||
| ≥1 | N [%] | 218 [98.6] |
| ≥2 | N [%] | 162 [73.3] |
| 3 | N [%] | 11 [5.0] |
| Prior vedolizumab | N [%] | 103 [46.6] |
| Prior anti-TNF and vedolizumab | N [%] | 102 [46.2] |
| Disease activitya | ||
| Harvey Bradshaw Index | Median [IQR] | 7 [4–11] |
| CRP, mg/L | Median [IQR] | 9 [3–20] |
| Faecal calprotectin, µg/g | Median [IQR] | 699 [211–1536] |
| Concomitant medicationa | ||
| Corticosteroids | N [%] | 35 [15.8] |
| Corticosteroids range | mg [IQR] | 20 [19–30] |
| Immunosuppressants | N [%] | 44 [19.9] |
| Both corticosteroids and immunosuppressants | N [%] | 12 [5.4] |
| Corticosteroids range | mg [IQR] | 25 [13–38] |
IQR, interquartile range; SD, standard deviation; GI, gastrointestinal; anti-TNF: anti-tumour necrosis factor; CRP, C-reactive protein.
aAt inclusion.
bMaximum extent until inclusion.
At baseline, clinical disease activity was seen in 153 CD patients [69.2%] with a median HBI of 10 [IQR 7–13], median CRP concentration of 9.0 mg/L [IQR 3.0–20.0] and median FCP level of 686 µg/g [IQR 205–1595] [Supplementary Table 1]. The majority [59.5%] of patients started ustekinumab as monotherapy, i.e. without concomitant immunosuppressive medication. Of the 68 patients without clinical disease activity [HBI < 5] at baseline, 86.8% [n = 59/68] showed disease activity based on active fistula, inflammatory biomarkers, endoscopy or radiology [Supplementary Table 2]. These patients were not included in the effectiveness analysis.
3.2. Corticosteroid-free clinical remission
Of the patients with clinical disease activity at baseline [HBI > 4], the proportion of patients in corticosteroid-free clinical remission at weeks 12, 24 and 52 was 24.2% [n = 37/153], 38.2% [n = 58/152] and 37.1% [n = 49/132], respectively [Figure 1]. Of the 57 patients in corticosteroid-free clinical remission at week 24, 58.8% [n = 30/51] remained so until week 52 [Figure 1].
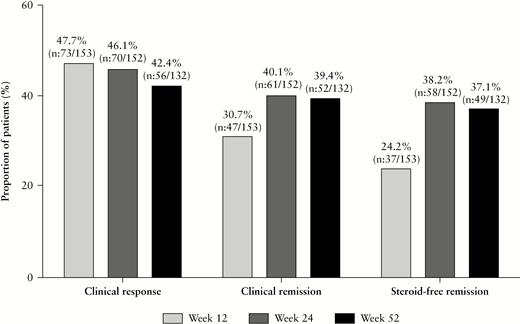
Proportion of patients with clinical response, clinical remission and corticosteroid-free clinical remission.
As sensitivity analysis we performed three additional analyses in patients with [a] endoscopic disease activity at baseline, [b] biochemical disease activity at baseline and [c] all patients [including those in clinical remission at baseline].
Endoscopic evaluation was performed in 107 patients at baseline, and all had endoscopic disease activity. Of these patients the corticosteroid-free clinical remission rate at weeks 12, 24 and 52 was 28.0% [n = 30/107], 39.3% [n = 42/107] and 37.8% [n = 37/98], respectively.
Biochemical disease activity was observed in 154 patients at baseline. Of these patients the corticosteroid-free clinical remission rate at weeks 12, 24 and 52 was 35.1% [n = 54/154], 45.8% [n = 70/153] and 44.6% [n = 58/130], respectively.
At baseline, 68 [30.8%] were in clinical remission [i.e. HBI ≤ 4]. When analysing all patients receiving ustekinumab regardless of clinical disease activity at baseline [n = 221], the proportion of patients in corticosteroid-free clinical remission at weeks 0, 12, 24 and 52 was 25.8% [n = 57/221], 35.7% [n = 79/221], 46.6% [n = 102/219] and 41.8% [n = 79/189], respectively.
Next, corticosteroid-free clinical remission rates were compared at different time points according to ustekinumab maintenance interval [q8w vs q12w], prior anti-integrin exposure and concomitant immunosuppressive therapy at baseline. Only patients with clinical disease activity at baseline were analysed.
3.2.1. Q12w vs q8w
Eighty-five patients started ustekinumab maintenance therapy on an q8w interval and 54 patients received ustekinumab on a q12w maintenance interval. Fourteen patients discontinued ustekinumab treatment before week 12 [11 primary non-response, two adverse events, one at request of patient] and were not included in the comparative analysis. Baseline characteristics were comparable between the subgroups. However, the HBI was significantly higher at week 12 for the q8w interval (q8w 6 [4–9] vs q12w 5 [3–8], p = 0.04) [Supplementary Table 3]. The proportion of patients in corticosteroid-free clinical remission at weeks 12, 24 and 52 was 21.2% [q8w] vs 35.2% [q12w] p = 0.07, 46.4% [q8w] vs 35.2% [q12w] p = 0.19, and 46.3% [q8w] vs 34.6% [q12w], p = 0.20, respectively [Figure 2A].
![Proportion of patients in corticosteroid-free clinical remission: [A] 12 weekly vs 8 weekly maintenance interval; [B] anti-TNF exposure alone vs anti-TNF and anti-integrin exposed at baseline; [C] concomitant immunosuppressants [thiopurines or methotrexate] at baseline vs ustekinumab monotherapy at baseline.](https://oup.silverchair-cdn.com/oup/backfile/Content_public/Journal/ecco-jcc/14/1/10.1093_ecco-jcc_jjz119/2/m_jjz119f0002.jpeg?Expires=1749095183&Signature=ZDhaQ7mW5cDW7I-tVp~9RtHR58GuJo0NEWqJ0otivyAclfWu0GqucowYbsqZEufPOSkNlvAkATJvFU54jFEdbjwmie7RkI6etw7SWpcTwdqDpgvxIawCqDvFQ69wmjVhzsR5iurCsq7APgjCA~-CgRzdBCAu6VxpJlm~ie5YutAqE87I3wlJuNHghh6XIQSZvoEyYZXadWTSbKLq5wW9Upn9ftfO1P4H-jaKJPSWHosS5e0eBlmtvHfFvil7iSONAkCrxWdg1u2AcUlRGV7VJSNfSGxNq0nUBFWGI5YyQ4fYQX6G-8xctlDmIibMGD9lr07PGCD~hRuefyb1ky87cA__&Key-Pair-Id=APKAIE5G5CRDK6RD3PGA)
Proportion of patients in corticosteroid-free clinical remission: [A] 12 weekly vs 8 weekly maintenance interval; [B] anti-TNF exposure alone vs anti-TNF and anti-integrin exposed at baseline; [C] concomitant immunosuppressants [thiopurines or methotrexate] at baseline vs ustekinumab monotherapy at baseline.
Twenty-two per cent [n = 19/85, one due to pregnancy] of the patients on a q8w interval discontinued ustekinumab treatment after a median treatment duration of 30.6 weeks [IQR 19.7–40.4] while 42.6% [n = 23/54] of the patients on a q12w interval discontinued treatment after a median treatment duration of 30.1 weeks [IQR 20.4–43.3] [p = 0.02] [Figure 4B]. Lack of response was the main reason for treatment discontinuation in both groups [Supplementary Table 4]. Adverse events between the groups were comparable [Supplementary Table 5].
3.2.2. Anti-TNF exposure alone vs anti-TNF and anti-integrin exposure
Before starting ustekinumab, 75 patients [50%] were exposed to both anti-TNF and vedolizumab while 75 patients were only exposed to anti-TNF. Baseline characteristics were comparable between the subgroups, except for the number of anti-TNF therapies in the medical history [≥2 anti-TNFs: anti-TNF exposed 68.0% vs anti-TNF/integrin exposed 82.6%, p = 0.04] and FCP level at baseline (anti-TNF exposed 506 µg/g [IQR 93–1303] vs 746 µg/g [IQR 417–1800] anti-TNF/integrin exposed, p = 0.04) [Supplementary Table 6]. At week 52, there was a non-significant difference in the proportion of patients in corticosteroid-free clinical remission (anti-TNF exposed 42.9% [n = 27/63] vs anti-TNF/integrin exposed 31.3% [n = 21/67], p = 0.17) [Figure 2B]. There was also a non-significant difference in discontinuation rate between the groups (anti-TNF exposed 30.7% [n = 23/75] vs anti-TNF/integrin exposed 42.7% [n = 32/75], p = 0.13). Lack of response was the main reason for discontinuation of ustekinumab treatment [anti-TNF exposed 65.2%, anti-TNF/integrin exposed 78.1%].
3.2.3. With or without concomitant immunosuppressants
At baseline, 33 patients [21.6%] initiated ustekinumab while on concomitant immunosuppressants [thiopurines or methotrexate], and 120 [78.4%] started ustekinumab as monotherapy. Baseline characteristics were significantly different regarding prior anti-integrin exposure (combi 33.3% [n = 11/33] vs mono 54.2% [n = 65/120] p = 0.03) and HBI (combi 8 [IQR 6–11] vs mono 10 [IQR 7–13] p = 0.048) [Supplementary Table 7]. At week 52, there was no significant difference between corticosteroid-free clinical remission (combi 40.6% [n = 13/32] vs mono 36.0% [n = 36/100] p = 0.64) [Figure 2C]. There was no significant difference in discontinuation rate between the two groups (combi 42.4% [n = 14/33] vs mono 35.0% [n = 42/120] p = 0.43).
3.3. Clinical response and remission
The proportion of patients with a clinical response to ustekinumab therapy at weeks 12, 24 and 52 was 47.7% [n = 73/153], 46.1% [n = 70/152] and 42.4% [n = 56/132], respectively [Figure 1]. The proportion of patients in clinical remission at weeks 12, 24 and 52 was 30.7% [n = 47/153], 40.1% [n = 61/152] and 39.4% [n = 52/132], respectively [Figure 1].
3.4. Biochemical disease activity
The proportion of patients in biochemical remission at weeks 12, 24 and 52 was 23.9% [n = 32/135], 24.6% [n = 30/122] and 26.4% [n = 32/121], respectively. When missing data were imputed as non-responders, the proportion of patients in biochemical remission at weeks 12, 24 and 52 was 20.9% [n = 32/153], 19.7% [n = 30/152] and 24.2% [n = 32/132] , respectively. The median CRP concentration of patients treated with ustekinumab at weeks 0, 12, 24 and 52 was 9 mg/L [IQR 3–20], 5 mg/L [IQR 2–12], 6 mg/L [IQR 2–12] and 4 mg/L [IQR 2–9], respectively [Figure 3A]. The median FCP level at weeks 0, 12, 24 and 52 was 686 µg/g [IQR 205–1596], 405 µg/g [IQR 144–1017], 222 µg/g [IQR 85–697] and 176 µg/g [IQR 65–688], respectively [Figure 3B]. FCP was available for 71.0% of patients to determine biochemical remission.
![[A] Median C-reactive protein concentration with interquartile range. [B] Median faecal calprotectin concentration with interquartile rage.](https://oup.silverchair-cdn.com/oup/backfile/Content_public/Journal/ecco-jcc/14/1/10.1093_ecco-jcc_jjz119/2/m_jjz119f0003.jpeg?Expires=1749095183&Signature=RB6tTS65s1EOyOpabyqWzLWZbNJ887aIxNCLjtOGz8noWChQWkkmOXzvNp39VWKFzNGxUpkaWWURBSpeLXzDhim1t1u5mxLdutZPF~OSZeohrTruLD6pUxBDOWOtmXaoSP6DR85JK1yQD~H9aMszw50t2aPh8b8s5vJ4I3MoU0GR35cS4qQKrubkNpJ3O6Y8SockCxbqdovWU7y7hfP~9ex8GnXanwT20RS7805-ZuTEAzM8dk-Pslfs7ohI-IHnKLYdG1gacN-Cuspwq3ZJK11SFCyQMfbeHnSqjhYz02mKo5~-PDwhq0kBUVA1RK4yeG3MGoCsUarP5ByWPr00lA__&Key-Pair-Id=APKAIE5G5CRDK6RD3PGA)
[A] Median C-reactive protein concentration with interquartile range. [B] Median faecal calprotectin concentration with interquartile rage.
3.5. Combined end point
Of the 153 patients with clinical disease activity at baseline, the proportion of patients in combined corticosteroid-free clinical and biochemical remission at weeks 12, 24 and 52 was 5.2% [n = 7/135], 13.9% [n = 17/122] and 18.2% [n = 22/121], respectively.
3.6. Clinical factors associated with corticosteroid-free clinical remission
Univariate and multivariate predictors of week 52 corticosteroid-free clinical remission are detailed in Table 2. In the multivariate analysis only body mass index [BMI] per point (odds ratio [OR] 0.91; 95% confidence interval [CI] 0.83–1.00) was associated with lower rates of corticosteroid-free clinical remission at week 52. Disease location and behaviour were not associated with corticosteroid-free clinical remission. Upper-gastrointestinal tract involvement showed a numerical trend towards increased response, but not reaching statistical significance as a univariable predictor [OR 3.72; 95% CI 0.89–15.6]. However, this difference was less pronounced when assessed as a multivariable predictor [OR 3.87; 95% CI 0.63–23.60]. Only three patients were anti-TNF naïve, and hence this parameter could not be assessed for prediction of response to therapy. Comorbidities did not have a significant effect on corticosteroid-free clinical remission at week 52.
Univariable and multivariable predictors for corticosteroid-free remission at 52 weeks
| Univariable analyses | Multivariable analyses | |||||
|---|---|---|---|---|---|---|
| OR | 95% CI | p value | OR | 95% CI | p value | |
| Age at inclusion | 1.01 | 0.98–1.03 | 0.95 | |||
| Weight, kg | 0.98 | 0.96–1.00 | 0.11 | |||
| BMI per point | 0.92 | 0.84–1.00 | 0.05 | 0.91 | 0.83–1.00 | 0.05 |
| Sex | ||||||
| Male | Ref | |||||
| Female | 0.84 | 0.44–1.93 | 0.84 | |||
| Disease duration | 0.98 | 0.95–1.01 | 0.23 | |||
| Disease locationa | 0.55 | |||||
| Ileum | Ref | |||||
| Colon | 1.66 | 0.64–4.30 | 0.30 | |||
| Ileocolonic | 1.53 | 0.61–3.83 | 0.37 | |||
| Upper GI tract involvementa | ||||||
| No | Ref | |||||
| Yes | 3.72 | 0.89–15.6 | 0.07 | 3.87 | 0.63–23.6 | 0.14 |
| Disease behavioura | 0.58 | |||||
| Inflammatory disease | Ref | |||||
| Stricturing disease | 0.96 | 0.40–2.31 | 0.92 | |||
| Penetrating disease | 1.79 | 0.74–4.33 | 0.20 | |||
| Peri-anal disease | ||||||
| No | Ref | |||||
| Yes | 1.01 | 0.98–1.04 | 0.69 | |||
| Active fistula | ||||||
| No | Ref | |||||
| Yes | 2.11 | 0.79–5.62 | 0.14 | 1.77 | 0.50–6.24 | 0.37 |
| Prior intestinal resections | ||||||
| No | Ref | |||||
| Yes | 0.82 | 0.40–1.69 | 0.59 | |||
| Anti-integrin exposure | ||||||
| No | Ref | |||||
| Yes | 0.57 | 0.28–1.17 | 0.13 | 0.45 | 0.18–1.16 | 0.10 |
| Clinical disease activityb | 0.19 | 0.19 | ||||
| Mild [HBI 5–7] | Ref | |||||
| Moderate [HBI 8–16] | 0.49 | 0.21–1.11 | 0.09 | 0.37 | 0.12–1.08 | 0.07 |
| Severe [HBI > 16] | 0.42 | 0.11–1.61 | 0.21 | 0.46 | 0.06–3.55 | 0.46 |
| Biochemical disease activityb | ||||||
| CRP, mg/L | 1.00 | 0.99–1.02 | 0.88 | |||
| Leucocytes, ×109/L | 0.94 | 0.84–1.05 | 0.28 | |||
| Faecal calprotectin, µg/g | 1.00 | 1.00–1.00 | 0.27 | |||
| Concomitant medicationb | ||||||
| Corticosteroids | 0.71 | 0.30–1.66 | 0.43 | |||
| Immunosuppressant | 1.22 | 0.54–2.75 | 0.64 |
OR, odds ratio; CI, confidence interval; BMI, body mass index; GI gastrointestinal; HBI, Harvey Bradshaw Index; CRP, C-reactive protein.
aMaximum extent until inclusion.
bAt baseline.
3.7. Peri-anal manifestations
At baseline, 28 patients [12.7%] had one or more active peri-anal fistulas. Seventeen [60.7%] patients had spontaneous drainage and 11 [39.2%] patients had drainage after gentle manual pressure. After 12 weeks of treatment, four patients [14.3%] had complete clinical remission of all peri-anal fistulas while four [14.3%] patients showed a response based on decrease in fistula drainage. After 24 weeks of treatment, ten patients [35.7 %] had complete resolution of all fistulas while four patients [14.3%] showed clinical response. Four patients underwent peri-anal procedures during follow-up. One patient underwent seton placement and was followed for 24 weeks without a decrease in fistula drainage. One patient developed an active draining fistula after 24 weeks of ustekinumab treatment with active luminal disease and was consequently treated with a seton placement; drainage did not decrease during follow-up. The third patient with an active draining fistula at baseline was treated for 8 months without fistula response to ustekinumab treatment. The last patient underwent a seton placement when treatment was discontinued. Two additional patients reported anal fissures at baseline, one of whom responded to ustekinumab treatment. All four patients with new peri-anal abscesses at baseline achieved remission during follow-up.
3.8. Extra-intestinal manifestations
At baseline, 56 [25.3%] patients experienced EIMs: 44 patients reported arthralgia, three uveitis, seven aphthous stomatitis and two erythema nodosum. During the entire follow-up period remission was achieved in 24 [54.5%] patients with arthralgia, all patients with uveitis [100%], all patients with aphthous stomatitis [100%] and one with erythema nodosum [50%]. During follow-up a total of 48 [21.7%] patients developed new EIMs: 37 patients developed arthralgia, four uveitis, four aphthous stomatitis and three erythema nodosum. Of the newly developed EIMs, 12 [32.4%] patients with arthralgia, one [25%] with aphthous stomatitis and two [66.7%] with erythema nodosum achieved remission during follow-up.
3.9. Safety profile
The entire cohort of 221 patients were included in our safety analysis [including patients with HBI < 5 at baseline] and were followed for approximately 196 patient-years. Eight patients discontinued ustekinumab treatment due to adverse events [4.1 per 100 patient-years] after a median treatment duration of 18.1 weeks [IQR 0.57–34.5]. Detailed information is shown in Table 3. The serious adverse events requiring treatment discontinuation were: four cases of severe arthralgia, one infusion reaction, one vasculitis, one severe headache and one patient with recurrent infections. During follow-up we encountered nine probably related [4.6 per 100 patient-years] and 31 possibly related [15.8 per 100 patient-years] adverse events. Headaches, cutaneous rash and arthralgia were the most commonly described adverse events. Additionally, we documented six severe infections [3.1 per 100 patient-years] in patients all treated with concomitant corticosteroids, immunosuppressants or both [Supplementary Table 7], 25 moderate infections [12.7 per 100 patient-years] and 39 mild infections [19.9 per 100 patient-years] [Table 3]. One 59-year-old female patient with an extensive medical history was treated for 12 months with ustekinumab when she was diagnosed with a malignancy [peritoneal carcinoma]. She died shortly after due to an abdominal sepsis after a colonoscopic perforation. One patient discontinued ustekinumab due to pregnancy. At week 25 of her pregnancy she received her last SC injection. After an uncomplicated pregnancy she gave birth to a healthy child.
Adverse events
| Adverse events | Total follow-up years: 196.1 |
|---|---|
| Possibly related | 31 [15.8 per 100 patient-years] |
| Cutaneous rash | 10 |
| Headache | 6 |
| Arthralgia | 3 |
| Gastrointestinal | 2 |
| Vascular event | 2 |
| Hair loss | 2 |
| Fatigue | 1 |
| Panic attacks | 1 |
| Dry mouth | 1 |
| Severe hypocalcaemia and hypomagnesaemia | 1 |
| Nervous system event | 1 |
| Eye condition | 1 |
| Probably related | 9 [4.6 per 100 patient-years] |
| Cutaneous rash | 3 |
| Arthralgia | 2 |
| Headache | 1 |
| Injection reactions | 1 |
| Eye condition | 1 |
| Hair loss | 1 |
| Serious adverse events | 8 [4.1 per 100 patient-years] |
| Arthralgia | 4 |
| Infusion reaction | 1 |
| Vasculitis | 1 |
| Recurrent infections | 1 |
| Severe headache | 1 |
| Mild infections | 39 [19.9 per 100 patient-years] |
| Upper respiratory tract | 16 |
| Flu-like symptoms | 10 |
| Gastrointestinal | 6 |
| Soft tissue | 3 |
| Cold sore | 3 |
| Urinary tract | 1 |
| Moderate infections | 25 [12.7 per 100 patient-years] |
| Urinary tract | 7 |
| Upper respiratory tract | 7 |
| Skin | 3 |
| Soft tissue | 3 |
| Lower respiratory tract | 3 |
| Gynaecological | 1 |
| Flu-like | 1 |
| Severe infections | 6 [3.1 per 100 patient-years] |
| Gastrointestinal | 4 |
| Central catheter | 1 |
| Herpes zoster | 1 |
In total, 46 patients required hospitalization [23.5 per 100 patient-years] during ustekinumab treatment. Six patients were hospitalized while starting ustekinumab treatment. The effectiveness outcomes of the patients who were hospitalized at baseline were not significantly different from the non-hospitalized cohort. During follow-up 14 patients required surgery, nine patients continued ustekinumab treatment of whom five maintained steroid-free clinical remission until the end of follow-up, and three patients with endoscopic evaluation after 6 months showed endoscopic remission. Four patients underwent surgery and continued ustekinumab treatment but follow-up was too short to assess the effectiveness outcomes. Five other patients discontinued ustekinumab treatment perioperatively [lack of response: 3, adverse events: 2].
3.10. Maintenance interval between ustekinumab injections
After the initial IV treatment the first SC dose of 90 mg was administered to 216 patients [97.7%] at week 8, while three patients [1.4%] received their first SC dose at week 4, one patient [0.5%] at week 12, and one patient [0.5%] did not receive a single SC injection. At week 12 [Figure 4A, B], 65.0% [n = 132/203] continued their maintenance interval at one SC injection every 8 weeks or less [q4w: 2, q6w: 2, q7w: 1]. At week 24, 77.3% [n = 133/172] were injected every 8 weeks or less [q4w: 3, q6w: 2, q7w: 1]. At week 52, 85.2% [n = 98/115] received the injection every 8 weeks or less [q4w: 11, q6w: 5, q7w: 1]. At week 52, 11 patients were on a q4w interval and 72.7% were in corticosteroid-free clinical remission at that time point. In total, 31 patients underwent dose escalation from q12w to q8w interval. Of these patients, 17 achieved or maintained steroid-free clinical remission during follow-up. During follow-up seven patients received IV re-induction with a 42.9% recapture response rate. Four patients with extensive surgical and medical history and limited remaining treatment options received an IV re-induction with a subsequent q4w interval but failed to achieve remission. Three patients with a loss of response [one after 24 weeks, two after 1 year] received successful IV re-induction and maintained remission during follow-up.
3.11. Ustekinumab drug survival
Cumulative ustekinumab drug survival is detailed in Figure 4. Of 221 patients, 75 [33.9%] discontinued ustekinumab after a median treatment duration of 24.6 weeks [IQR 15.9–37.8]. The main reasons for discontinuing treatment were lack of response [70.7%, n = 53], adverse events [10.7%, n = 8] and loss of response [8.0%, n = 6] [Table 4]. The probability of remaining on ustekinumab treatment after 52 weeks was 62.9% [Figure 5A]. There were no discontinuations because of stable remission.
Discontinuation visit
| Discontinuation visit | N = 75 | |
|---|---|---|
| Treatment duration, weeks | Median [IQR] | 24.6 [15.9–37.8] |
| Reason for discontinuation | ||
| Lack of response | N [%] | 53 [70.7] |
| Loss of response | N [%] | 6 [8.0] |
| Adverse events | N [%] | 8 [10.7] |
| Pregnancy | N [%] | 1 [1.3] |
| Request of patient | N [%] | 6 [8.0] |
| Other | N [%] | 1 [1.3] |
![[A] Ustekinumab interval changes from a starting maintenance interval of q8w during follow-up. [B] Ustekinumab interval changes from a starting maintenance interval of q12w during follow-up.](https://oup.silverchair-cdn.com/oup/backfile/Content_public/Journal/ecco-jcc/14/1/10.1093_ecco-jcc_jjz119/2/m_jjz119f0004.jpeg?Expires=1749095183&Signature=VlLVJhStZnks6p9C6ODY30zoFFhHbVNkr6Jifo96Ra0UlBJQ22dJCvn4uhqA7CalkxnAigwum-Yz4HPlvjiPLOlH2F1rUS4H11n4lv4d0fkIEg4VBvaG94ZXANtgb0AUb0mMXyiCAq--tnSO37EHTh5KnmCcqGXbfH12jfiWm~ib~0~LGTO5k5Ym8t~Js-Z~Jww1UdKdzsC4i2aISINSiFb-PYoEtDqCZyjI0HaKBWJsSsOc4pUEe2k0Z7an6st7UoIM7hW1-UCx520KduEv6243IWvFY7B95XuGyZ4qp6~saIw~9dYDjUBIoykhC2z8jpgYSekYVjiZnEhCA6bLkA__&Key-Pair-Id=APKAIE5G5CRDK6RD3PGA)
[A] Ustekinumab interval changes from a starting maintenance interval of q8w during follow-up. [B] Ustekinumab interval changes from a starting maintenance interval of q12w during follow-up.
![[A]: Kaplan–Meier survival curve demonstrating ustekinumab drug persistence. [B] Kaplan–Meier survival curve demonstrating ustekinumab drug persistence with a q12w compared to q8w maintenance interval. [C] Kaplan–Meier survival curve demonstrating ustekinumab drug persistence with one or two and with or without vedolizumab in their medical history.](https://oup.silverchair-cdn.com/oup/backfile/Content_public/Journal/ecco-jcc/14/1/10.1093_ecco-jcc_jjz119/2/m_jjz119f0005.jpeg?Expires=1749095183&Signature=ETKaU3XAKOGYi7aNQBo2oCJO~AS6rfJyM8FuTCFsWs2k56Er8EYv-utY9OvQAiHczSwXwqccmMke4Jktj2IDrQ4URXFYfkvpgq-FEVex96VQh1TMZY31sY7cpZyFtEkDLcg9Atjx3cTOC58cFpzG1FvEe0Bn7IVShnVT8WVxye9O07FI6Wp4tpYGaXwtAlXVmGVl9TanuUAS7tBUdGD0zuCYot73Fz6uM6fhvaVg5rnuqtsP9ag87idMYqS~Egd-yWmoKfvdGVgI1pl9X7S42ZWbe4Eph2WogBoQD76Dpt8fdilCdQgS4EJFxyTaTCCeDDM4QojI8OOsbfpZFUkywA__&Key-Pair-Id=APKAIE5G5CRDK6RD3PGA)
[A]: Kaplan–Meier survival curve demonstrating ustekinumab drug persistence. [B] Kaplan–Meier survival curve demonstrating ustekinumab drug persistence with a q12w compared to q8w maintenance interval. [C] Kaplan–Meier survival curve demonstrating ustekinumab drug persistence with one or two and with or without vedolizumab in their medical history.
4. Discussion
We assessed real-world effectiveness, safety and dosing of ustekinumab treatment for CD patients in the ICC registry, a prospective multicentre registry in the Netherlands. This cohort of biological-experienced patients [99% anti-TNF, 47% vedolizumab] showed corticosteroid-free clinical remission rates after 24 and 52 weeks of ustekinumab treatment of 38% and 37%, respectively. A q8w maintenance interval at week 12 correlated with a lower discontinuation rate during follow-up compared to a q12w interval. Eighty-five per cent of the patients received a q8w interval at week 52. After 24 weeks of treatment, 36% achieved clinical remission of peri-anal fistulas. Ustekinumab treatment was relatively safe with few serious adverse events and all severe infections occurred in patients receiving concomitant treatment with immunosuppressant medication.
In our cohort after 52 weeks, 39, 37 and 18% of the patients were in clinical, corticosteroid-free clinical remission, and combined corticosteroid-free clinical and biochemical remission, respectively. In comparison, in the IM-UNITI registration trial, 53% achieved clinical and 47% achieved corticosteroid-free clinical remission at week 44.1 However, only patients with a clinical response [43%, n = 396/912] at week 8 were included in the latter analysis1 as a consequence of the trial design, in contrast to our real-life cohort that analysed all patients initiating ustekinumab with clinical disease activity at baseline. Interestingly, in our cohort, 31% were in clinical remission according to HBI scores at baseline. These patients would not have been able to participate in the UNITI studies. Nonetheless, this subgroup of patients demonstrated baseline disease activity as indicated by biochemical or endoscopic inflammation prior to starting ustekinumab.
Other retrospective observational cohort studies showed comparable clinical effectiveness results [n = 162, 27.9% corticosteroid-free clinical remission at week 52,10n = 45 35% clinical remission at week 129]. A Canadian cohort [n = 62] showed higher effectiveness [66.1 and 50.0% clinical and corticosteroid-free clinical remission at week 264]. This discrepancy could in part be explained because the included patients did not have a history of anti-integrin exposure and were predominantly on a q4w interval [77.4%]. We observed 11 patients on a q4w interval at week 52. The corticosteroid-free clinical remission rate was 72.7%, although this result should be interpreted with caution because this is a highly selected group of patients, escalating to a q4w interval while able to continue therapy until week 52. A retrospective real-life Belgian cohort with higher prior vedolizumab exposure [69.7%] and higher biochemical disease activity at baseline [CRP 16.2 mg/L] showed lower effectiveness rates after 52 weeks [25.7% clinical remission and 24.3% corticosteroid-free clinical remission].11 Another clinically relevant observation was that although most patients achieved corticosteroid-free clinical remission already at week 12 [24%, n = 37], some only reached remission at week 24 [15%, n = 23]. This indicates that the onset of clinical effects of ustekinumab may require more time beyond the formal induction phase for a subgroup of patients.
The present study underlines that ustekinumab is a relatively safe treatment. The rates of serious adverse events [4.1 per 100 patient-years] and severe infections [3.1 per 100 patient-years] were similar to those observed in the IM-UNITI trial and other real-world cohorts.1,7,15 It is important to note that all patients with severe infections were on concomitant immunosuppressant therapies, while combination therapy did not provide clinical benefit based on corticosteroid-free clinical remission rates in our study. These results indicate that ustekinumab monotherapy rather than combination therapy should be considered when initiating therapy in CD patients, although further studies are warranted to confirm these findings.
We assessed multiple factors that may contribute to the effectiveness of ustekinumab in CD. Although the difference in therapeutic efficacy between a q8w and q12w interval in the IM-UNITI trial1 was not significant, a large proportion of patients in other real-world cohorts6,8 and in our cohort did receive a q8w interval [85% at week 52]. The pharmacokinetic study of the IM-UNITI trial did show a three-fold higher median trough concentration in the q8w group compared to the q12w group [2.0–2.2 µg/ml vs 0.6–0.8 µg/ml], but this difference did not translate to a higher proportion of clinical remission.16 Because the IM-UNITI trial involved a relatively low proportion of anti-TNF-exposed patients and no prior anti-integrin exposure, our cohort represents a more therapy refractory population, and a therapeutic window of ustekinumab trough levels in this setting needs to be determined. A Belgian prospective study of 86 anti-TNF- and anti-integrin-exposed patients suggested that a maintenance trough level cut-off of at least 1.9 µg/mL was needed for endoscopic response.17 However, this was only achieved in half of the patients while all patients were on a q8w interval. Battat et al. [n = 56, 77% on a q4w interval] previously suggested an even higher maintenance target of 4.5 µg/mL.4 We recognize that further real-world pharmacokinetic studies are needed to explain these findings and to assess the value of therapeutic drug monitoring in ustekinumab treatment. The outcome of this future research could have considerable consequences, because the cost would increase significantly with a dose escalation of one-third [or higher] during the maintenance interval. This information, in addition to the comparative effectiveness to other second-line biologicals, is important to determine the position of ustekinumab in the treatment algorithm for CD.
We also assessed prior exposure to anti-integrin therapy and found no significant impact on the corticosteroid-free clinical remission rate at week 52. However, the relatively small sample size of the anti-TNF exposed cohort and both the anti-TNF- and anti-integrin-exposed subcohorts do not allow for firm conclusions. It is well known that the clinical response to a second or third anti-TNF agent is lower compared to the first anti-TNF agent and that the response rate in part depends on the reason for failing the first anti-TNF.18,19 Furthermore, post-hoc analysis of randomized controlled trials have shown lower clinical response rates in patients who are anti-TNF experienced when compared to anti-TNF naive for both anti-integrin and anti-IL12/23 therapies.1,20 Failure with multiple biologicals and especially with multiple classes of biologicals might be a surrogate for a more refractory population. Our results show that it is still potentially beneficial to start ustekinumab as a third-line biological and to achieve clinical remission despite prior failure of multiple biologicals, including anti-integrins.
Clinical response and remission of peri-anal fistulas were observed in 14.3 and 35.7% of patients, respectively, after 24 weeks of treatment. Evidence for fistula closure with ustekinumab is scarce. Sands et al. showed a non-significant improvement of peri-anal fistulas after 8 weeks of treatment with ustekinumab compared to placebo in the CERTIFI, UNITI-1 and UNITI-2 studies (fistula resolution: ustekinumab 24.7% [n = 37/1306] vs placebo 14.1% [n = 10/588], p = 0.07).21 Other real-world cohorts showed fistula response rates of up to 66% after 6 months of treatment in six, 12 and 18 patients.6,7,22 The clinical outcomes for peri-anal fistulas in our cohort are promising but require further confirmation in controlled studies.
A beneficial effect of ustekinumab treatment on EIMs was seen in 35 of the total of 56 [62.5%] patients with reported EIMs at baseline. However, 48 patients developed new EIMs during follow-up. Eight of 37 arthralgias and one aphthous stomatitis developed in patients who were in clinical remission. This finding would favour ongoing disease activity in the majority of patients as an explanation for the development of arthralgia. This is supported by the assessment of the treating physician who reported arthralgia as either an anticipated EIM or adverse event. However, disease activity assessment based on endoscopy was not available for all patients. In addition, arthralgia as an adverse event, or due to tapering of corticosteroids, could not be excluded in all patients. To the best of our knowledge this is the first cohort of CD patients reporting the effect of ustekinumab treatment on EIMs in a real-world setting. Further studies are warranted to better understand the position of ustekinumab therapy for patients with active EIMs.
Our study has several strengths. The prospective follow-up with a substantial cohort size and a nationwide coverage enabled us to create a representative cohort that reflects daily care. The characteristics of our cohort [anti-TNF and anti-integrin experienced] allowed us to document clinically relevant effectiveness and safety outcomes with ustekinumab beyond trial protocols. Finally, ustekinumab route and dosing in our cohort were standardized according to the label in contrast to prior published cohorts with heterogeneous dosing protocols. Our study also has some limitations. Despite the nationwide design of our cohort, most enrolled patients are treated in tertiary referral centres. Referral centre bias may limit the external validity of our observations when incorporating these findings into clinical practice. Another limitation lies in the lack of systematic information regarding endoscopic remission. Since this is an observational cohort not all centres performed endoscopy systematically to assess response. Most centres perform endoscopy or imaging only if information from non-invasive biomarkers is inconclusive, furthermore the time points of endoscopy differ. Selection bias would therefore probably be present when reporting these data. The comparison of effectiveness between specific subgroups should be interpreted with care because there was no correction for bias and potential confounders. However, because the baseline characteristics were largely comparable, these exploratory analyses may be used for future randomized research to determine the true effect of different treatment strategies. Lastly, this is an ongoing registry which still actively recruits patients. Therefore, not all patients were followed for the same time period. We intended to limit this bias by censoring the patients with inadequate follow-up time both with and without clinical response.
In conclusion, ustekinumab showed clinical effectiveness and was relatively safe in a real-life cohort of biological-exposed CD patients. A substantial proportion of the patients achieved corticosteroid-free clinical remission, inflammatory biomarker reduction and clinical peri-anal fistula closure. A q8w interval was associated with a reduced discontinuation rate, while concomitant use of immunosuppressants did not have a significant impact on the therapeutic effectiveness of ustekinumab in our cohort. These result underline the value of ustekinumab in managing refractory CD patients. However, further research is warranted to determine the precise place of ustekinumab in the treatment algorithm of CD.
Funding
No specific funding was received for this study. The data were generated as part of routine work of the participating organizations.
Conflict of Interest
V.B.C.B. has no conflicts of interest to declare. A.E.vdM. – dJ. has served on advisory boards, or as speaker or consultant for Takeda, Tramedico, AbbVie, and has received grants from Takeda. C.J.vdW. has served on advisory boards and/or received financial compensation from the following companies: MSD, FALK Benelux, Abbott laboratories, Mundipharma Pharmaceuticals, Janssen, Takeda and Ferring during the last 3 years. M.L. has served as speaker and/or principal investigator for: Abbvie, Celgene, Covidien, Dr. Falk, Ferring Pharmaceuticals, Gilead, GlaxoSmithKline, Janssen-Cilag, Merck Sharp & Dohme, Pfizer, Protagonist therapeutics, Receptos, Takeda, Tillotts, Tramedico. He has received research grants from AbbVie, Merck Sharp & Dohme, Achmea healthcare and ZonMW. G.D. received unrestricted research grants from Abbvie, Takeda and Ferring Pharmaceuticals. Advisory boards for Mundipharma and Pharmacosmos. Received speakers fees from Takeda and Janssen Pharmaceuticals. B.O. speaker: Ferring, MSD, Abbvie. Advisory boards: Ferring, MSD, Abbvie, Takeda, Pfizer, Janssen. Research grants: Abbvie, Ferring, Takeda, Pfizer, MSD, Dr. Falk N.K.H.dB. has served as a speaker for AbbVie, Takeda and MSD. He has served as consultant and principal investigator for Takeda and TEVA Pharma B.V. He has received [unrestricted] research grants from Dr. Falk and Takeda. S.vdM. has no conflicts of interest to declare. A.G.L.B. has served as speaker and/or participant on advisory boards for: Abbvie, Merck Sharp & Dohme, Takeda, Vifor Pharma, Mundipharma. J.M.J. has served on advisory boards, or as speaker or consultant for Abbvie, Amgen, Ferring, Fresenius, Janssen, MSD, Pfizer, Takeda. J.J.L.H. reports personal fees from advisory boards for Takeda Nederland B.V., personal fees from advisory boards for Lamepro B.V., outside the submitted work. R.T. has no conflicts to declare D.J.dJ. received consulting fees from Synthon, Pharma, Abbvie, and MSD, and travel fees from Falk Pharma, Takeda, Abbvie, MSD, Ferring, Vifor Pharma, and Cablon Medical. M.J.P. reports grants from the European Union, non-financial support from Ferring, grants from Falk, others from MSD, outside the submitted work. F.H. has served on advisory boards, or as speaker or consultant for Abbvie, Celgene, Janssen-Cilag, MSD, Takeda, Celltrion, Teva, Sandoz and Dr Falk, and has received unrestricted grants from Dr Falk, Janssen-Cilag, Abbvie.
Author Contributions
No additional writing assistance was used for this manuscript. V.B., A.M., C.W., M.L., G.D., B.O., N.B., M.P., F.H. contributed to the design of the study. All authors collected data; V.B., M.P. and FH analysed the data. V.B., M.P. and F.H. drafted the manuscript. All authors critically revised the manuscript for important intellectual content. All authors have approved the final version of the manuscript.
References
Author notes
Shared authorship.
