


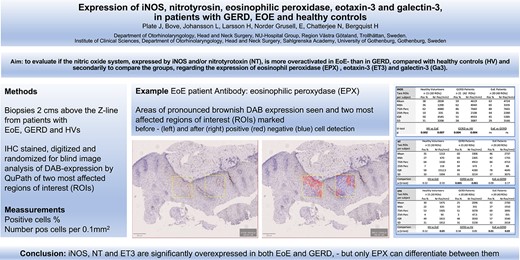
Summary
Eosinophilic esophagitis (EoE) and gastroesophageal reflux disease (GERD) share many histopathological features; therefore, markers for differentiation are of diagnostic interest and may add to the understanding of the underlying mechanisms. The nitrergic system is upregulated in GERD and probably also in EoE. Esophageal biopsies of patients with EoE (n = 20), GERD (n = 20), and healthy volunteers (HVs) (n = 15) were exposed to antibodies against inducible nitric oxide synthase (iNOS), nitrotyrosine, eosinophilic peroxidase, eotaxin-3, and galectin-3. The stained object glasses were randomized, digitized, and blindly analyzed regarding the expression of DAB (3,3′-diaminobenzidine) by a protocol developed in QuPath software. A statistically significant overexpression of iNOS was observed in patients with any of the two inflammatory diseases compared with that in HVs. Eotaxin-3 could differentiate HVs versus inflammatory states. Gastroesophageal reflux patients displayed the highest levels of nitrotyrosine. Neither iNOS nor nitrotyrosine alone were able to differentiate between the two diseases. For that purpose, eosinophil peroxidase was a better candidate, as the mean levels increased stepwise from HVs via GERD to EoE. iNOS and nitrotyrosine are significantly overexpressed in patients with EoE and GERD compared with healthy controls, but only eosinophil peroxidase could differentiate the two types of esophagitis. The implications of the finding of the highest levels of nitrotyrosine among gastroesophageal reflux patients are discussed.
INTRODUCTION
The most common cause of esophagitis is gastroesophageal reflux disease (GERD), followed by eosinophilic esophagitis (EoE). Histopathologically, the classical signs are shared, while symptoms differ, as esophageal dysfunction is more prominent in EoE.1
Nitric oxide (NO) is needed for maintaining normal peristalsis.2,3 In GERD patients, the upregulation of iNOS has been reported to increase mucosal defense.4,5
The esophagus and the lungs share their embryological origin, and expired NO (FeNO) is an important marker for inflammatory activity in asthma, but regarding EoE, the results have been disappointing.6 In the esophagus, the expression of iNOS reflects the activation of the NO system.7 Another more stable end product of NO is 3-nitrotyrosine (NT), which reflects a more longstanding nitrergic drive.8
The purpose of comparing EoE to GERD and to healthy volunteers (HVs) is to search for improved differential diagnostics, but more importantly, to expand our understanding of the underlying mechanisms.
Another proinflammatory marker is galectin-3 (Ga-3), which has been linked with eosinophil recruitment.9 Also other eosinophil cell-specific markers, such as eosinophilic peroxidase (EPX) and eotaxin-3 (ET-3), may be of interest.10,11
The aim of the study was primarily to determine whether the NO system, as expressed by iNOS or NT, is more activated in EoE than in GERD patients compared with HVs. Secondarily, to compare the groups regarding the expression of EPX, ET-3, and Ga-3.
METHODS
The material consisted of biopsies from the lower esophagus 2 cm above the z-line derived from each of the three categories (HVs, GERD patients, and EoE patients). These biopsies were saved from earlier studies.12,13 The ambition was to include 20 biopsies from each category. To allow for some expected ‘fall outs’, we randomly selected 72 cases from our biobank register (24 from each category). These were then randomized (https://stattrek.com/statistics/random-number-generator.aspx) and blinded with respect to category during later image analysis. Two biopsies from each group were kept from blinding for use as controls and for determining adequate dilutions of antibodies. Some biopsies, mainly in the HV category, could not be retrieved from the freezer; a few were damaged during the process of embedding, cutting, and staining; and some were of insufficient size to allow for all five cuts (five antibodies).
The GERD and EoE groups consisted of patients referred for esophagogastroduodenoscopy due to symptoms that were suggestive of EoE or GERD. These patients had to abstain from proton pump inhibitor (PPI) treatment for at least 2 weeks before the examination. Subjects were classified as suffering from GERD if they had typical symptoms, endoscopic and/or histopathologic esophagitis, and an eosinophil count of less than 15 eosinophils per high power field (hpf). If only microscopic esophagitis was observed, a pathologic 24-hour pH-metry was demanded. The diagnosis of EoE was assigned if subjects had a history of esophageal dysfunction and at least 15 eosinophils/hpf.
The HV group
Consist of patients referred for surgery under general anesthesia who gave their consent to undergo esophagogastroscopy with biopsies (Table 1). The inclusion criteria were as follows: no ongoing or former symptoms affecting the upper gastrointestinal tract, no ongoing PPI or other acid-reducing treatment and no systemic disease.
Healthy volunteers (n = 15)
| Age at biopsy | Men | ENT surgery | Elective laparascopic cholecystect. | Orthognat. corrective surgery | |||
|---|---|---|---|---|---|---|---|
| Number | 6 | 7 | 6 | 2 | |||
| Range | 21–75 | ||||||
| Median | 51 | ||||||
| Mean | 50 | ||||||
| SD | 15 | ||||||
| GERD patients (n = 20 EPX; n = 21 iNOS) | |||||||
| Age at biopsy | Men | NERD pH pos | GERD A | GERD B | GERD C | GERD D | |
| Number | 8 | 4 | 11 | 4 | 0 | 1 | |
| Range | 25–71 | ||||||
| Median | 51 | ||||||
| Mean | 49 | ||||||
| SD | 14 | ||||||
| EoE patients (n = 20) | |||||||
| Age at biopsy | Men | Eosinophils per HPF | Dysphagia score | EoEHSS stage | EoEHSS grade | ||
| Number | 18 | ||||||
| Range | 18–80 | 15–150 | 0.0–0.9 | 0.1–0.9 | |||
| Median | 42 | 31 | 0.41 | 0.20 | |||
| Mean | 45 | 45 | 0.42 | 0.34 | |||
| SD | 18 | 38 | 0.34 | 0.31 | |||
After the exclusions mentioned above, 16 appropriate valid biopsies remained, of which one subject developed myeloma and was excluded because concomitant eosinophilia might occur. Among HVs, 15 images were available for analysis of all antibodies.
The GERD group
Two biopsies were used as references, including tapering antibody dilutions. Another, in its EPX-stained version, escaped for some unclear reason, the automatic nightly digitalizing process (run as a single badge). One biopsy included only the epithelium of the gastric type and was excluded. For the GERD group, this left us with 20 images regarding EPX and 21 regarding the other antibodies.
The EoE group
Two biopsies were used as references, as described above. One biopsy could not be retrieved, and another escaped automatic digitalization, leaving us with 20 images for both EPX and iNOS and 19 for ET and Gal.
The antibodies used are:
Monoclonal mouse-raised human EPX Antibody (EPO104) NBP2-32844-0.1 mg (www.novusbio.com/NBP2-32844),
Monoclonal rabbit-raised human, mouse, rat iNOS (NOS2) antibody (K13-A) NBP1-33780-0.1 mL (www.novusbio.com/NBP1-33780),
Monoclonal mouse-raised human NT antibody (EM-30) NBP1-96130, 0.1 mg (www.novusbio.com/NBP1-96130),
Polyclonal rabbit-raised ET-3 (CCL26) antibody (https://www.avivasysbio.com/sd/tds/html_datasheet.php?sku=OACD05609),
Monoclonal rat raised human, mouse galectin 3 antibody (eBioM3/38 [M3/38]), eBioscience.
The glasses were treated according to the two-step polymer method (EnVision FLEX, High pH, Dako Omnis), a visualizing system to detect primary mouse or rabbit antibodies through DAB+ Chromogen.
Approximately 280 IHC-stained object-glasses were photographed and used as high-resolution digitalized images for semiquantitative image analysis by a protocol with three scripts (see link below) in the opensource software QuPath v 0.4.2.14
In collaboration with coauthor Dr Chatterjee at The Centre for Cellular Imaging at the University of Gothenburg, a protocol for semi-quantifying the grade of DAB (3,3′-diaminobenzidine) stain was developed (https://www.protocols.io/blind/7EB76A466D8611EE8A230A58A9FEAC02). The results from the analysis are expressed both as the percentage of positive cells within a region of interest (ROI) and as the number of ‘positive’ cells per mm2 within this ROI. Cells with an ‘intensity’ (within a DAB color spectrum) exceeding a certain arbitrary limit are considered ‘positive’.
As EoE is considered a ‘patchy’ disease, we chose to count positive cells within an ROI consisting of a square with an area of 0.1 mm2 that could be placed over an area ‘by eye’ considered a ‘peak’ area showing maximal ‘brownish’ DAB staining (Figure 1 and 2). It should be placed to include all epithelial layers whenever possible. The size of the ROI was arbitrarily chosen to be small enough for localizing the area with ‘peak’ pathology and large enough to include representative parts of the epithelium. The ROI is approximately half the size of our high-power field, measuring 0.19–0.21 mm2. We similarly measured over the next most affected ROI. Hence, Tables 2–5 with suffix ‘a’ include two separate ROIs (‘peak’ and ‘subpeak’). Tables 2–5 with suffix ‘c’ represent the means of the two ROI readings.
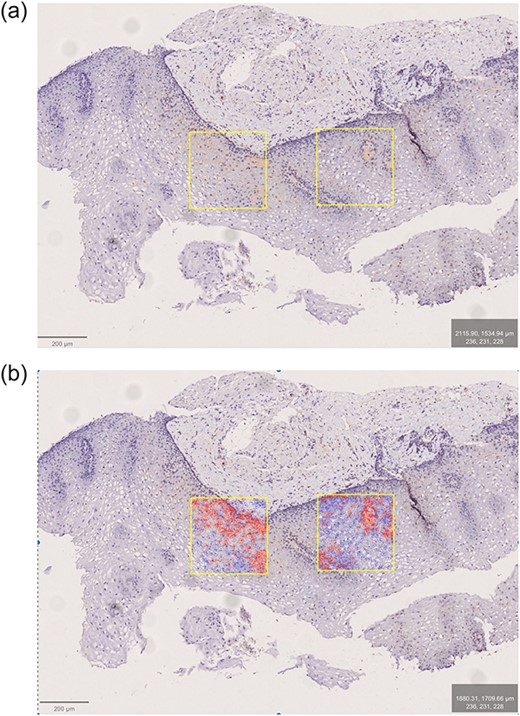
EoE patient. Antibody: eosinophilic peroxydase (EPX). The two most affected ROIs marked before (a) and after (b) positive cell detection.
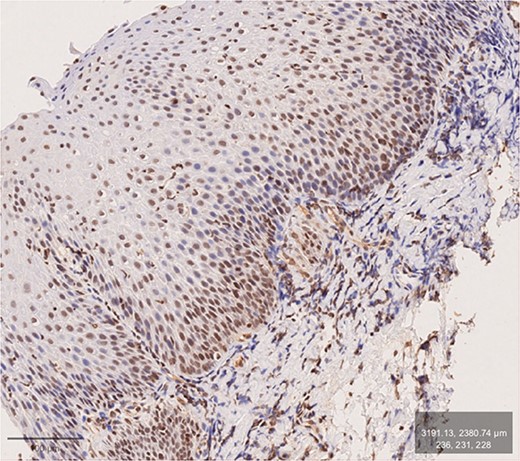
GERD patient. Antibody: inducible nitric oxide synthase (iNOS). Brownish DAB-stain of basal layers and adjoining submucosa. Distinct DIS (mainly in middle layers).
Statistics
For comparisons between groups, the Mann–Whitney U test for comparison of independent samples as two-tailed with a significance level of 5% was used.
The study was approved by the Regional Ethics Committee of Göteborg, Etikprövningsnämnden (EPN) (DNr 818-17).
RESULTS
Demographic data
The age and sex distribution (Table 1) did not differ significantly between HVs and GERD patients, while the mean age of EoE patients was approximately 5 years younger. Men were overrepresented in the EoE group. Most GERD patients were in LA Group A, representing relatively mild degrees of inflammation.
Inducible nitric oxide synthase (iNOS)
Two separate ROIs per patient
A stepwise increase in mean values (MV) and % positive cells from HV via GERD to EoE was observed (Table 2a). A highly significant difference was observed between both GERD and EoE patients in comparison with HVs.
INOS, two ROIs per subject
| iNOS Two ROIs per subject | Healthy volunteers | GERD patients | EoE patients | |||
|---|---|---|---|---|---|---|
| n 15 (30 ROIs) | n 21 (42 ROIs) | n 20 (40 ROIs) | ||||
| Pos % | Nr Pos/mm2 | Pos % | Nr Pos/mm2 | Pos % | Nr Pos/mm2 | |
| Mean | 38 | 2838 | 59 | 4619 | 63 | 4724 |
| Mdn | 36 | 1200 | 62 | 4040 | 65 | 3335 |
| 75th Perc | 62 | 4880 | 86 | 7040 | 89 | 7665 |
| 25th Perc | 10 | 335 | 35 | 2108 | 44 | 2280 |
| IQR | 50 | 4545 | 51 | 4933 | 45 | 5385 |
| SD | 31 | 3208 | 28 | 3087 | 29 | 3146 |
| Comparison | HV vs. EoE | GERD vs. HV | EoE vs. GERD | |||
| P (U-test) | 0.002 | 0.007 | 0.004 | 0.004 | ns | ns |
Peak ROI values
The stepwise increase in MV between groups was confirmed, but the difference between GERD and EoE patients in comparison to HVs did not reach statistical significance (Table 2b).
INOS, one peak ROI per subject
| iNOS One peak ROI per subject | Healthy volunteers | GERD patients | EoE patients | |||
|---|---|---|---|---|---|---|
| n 15 | n 21 | n 20 | ||||
| Pos % | Nr Pos/mm2 | Pos % | Nr Pos/mm2 | Pos % | Nr Pos/mm2 | |
| Mean | 46 | 3611 | 65 | 5408 | 66 | 5349 |
| Mdn | 43 | 2440 | 65 | 4830 | 69 | 4555 |
| 75th Perc | 76 | 5400 | 92 | 8170 | 91 | 8070 |
| 25th Perc | 17 | 805 | 41 | 2210 | 49 | 2740 |
| IQR | 59 | 4595 | 51 | 5960 | 41 | 5330 |
| SD | 33 | 3475 | 27 | 3415 | 29 | 3341 |
| Comparison | HV vs. EoE | GERD vs. HV | EoE vs. GERD | |||
| P (U-test) | 0.07 | 0.12 | 0.06 | 0,11 | ns | ns |
Mean ROI values
We confirmed the stepwise increase from HV via GERD to EoE (Table 2c). The difference observed above in Table 2a between each esophagitis group and HVs is slightly observable.
INOS, mean of 2 ROIs per subject
| iNOS Mean of 2 ROIs per subject | Healthy volunteers | GERD patients | EoE patients | |||
|---|---|---|---|---|---|---|
| n 15 | n 21 | n 20 | ||||
| Pos % | Nr Pos/mm2 | Pos % | Nr Pos/mm2 | Pos % | Nr Pos/mm2 | |
| Mean | 39 | 2838 | 59 | 4619 | 63 | 4724 |
| Mdn | 29 | 1285 | 59 | 4000 | 65 | 3780 |
| 75th Perc | 62 | 4225 | 86 | 7385 | 87 | 7210 |
| 25th Perc | 17 | 805 | 35 | 2045 | 49 | 2464 |
| IQR | 45 | 3420 | 51 | 5340 | 38 | 4746 |
| SD | 30 | 3068 | 27 | 2922 | 29 | 3043 |
| Comparison | HV vs. EoE | GERD vs. HV | EoE vs. GERD | |||
| P (U-test) | 0.03 | 0.07 | 0.04 | 0.06 | ns | ns |
Nitrotyrosine
The mean expression of NT seems to be most pronounced among GERD patients, with a significant difference compared to HVs. (Table 3a–3c).
| NT Two ROIs per subject | Healthy volunteers | GERD patients | EoE patients | |||
|---|---|---|---|---|---|---|
| n 15 (30 ROIs) | n 21 (42 ROIs) | n 20 (40 ROIs) | ||||
| Pos % | Nr Pos/mm2 | Pos % | Nr Pos/mm2 | Pos % | Nr Pos/mm2 | |
| Mean | 35 | 1213 | 60 | 3306 | 46 | 2737 |
| Mdn | 27 | 670 | 66 | 2305 | 42 | 1755 |
| 75th Perc | 64 | 1630 | 83 | 4953 | 84 | 4713 |
| 25th Perc | 7 | 118 | 34 | 673 | 7 | 68 |
| IQR | 58 | 1512,5 | 49 | 4280 | 78 | 4645 |
| SD | 33 | 1694 | 31 | 3214 | 37 | 3075 |
| Comparison | HV vs. EoE | GERD vs. HV | EoE vs. GERD | |||
| P (U-test) | 0.22 | 0.10 | 0.003 | 0.001 | 0.09 | 0.17 |
NT, one peak ROI per subject
| NT One peak ROI per subject | Healthy volunteers | GERD patients | EoE patients | |||
|---|---|---|---|---|---|---|
| n 15 | n 21 | n 20 | ||||
| Pos % | Nr Pos/mm2 | Pos % | Nr Pos/mm2 | Pos % | Nr Pos/mm2 | |
| Mean | 39 | 1667 | 63 | 3818 | 50 | 2948 |
| Mdn | 29 | 850 | 71 | 3180 | 45 | 2135 |
| 75th Perc | 73 | 2495 | 85 | 5880 | 85 | 4820 |
| 25th Perc | 9 | 275 | 41 | 1300 | 16 | 95 |
| IQR | 64 | 2220 | 44 | 4580 | 69 | 4725 |
| SD | 34 | 2181 | 30 | 3330 | 37 | 3257 |
| Comparison | HV vs. EoE | GERD vs. HV | EoE vs. GERD | |||
| P (U-test) | 0.35 | 0.47 | 0.047 | 0.02 | 0.25 | 0.18 |
NT, mean of 2 ROIs per subject
| NT Mean of 2 ROIs per subject | Healthy volunteers | GERD patients | EoE patients | |||
|---|---|---|---|---|---|---|
| n 15 | n 21 | n 20 | ||||
| Pos % | Nr Pos/mm2 | Pos % | Nr Pos/mm2 | Pos % | Nr Pos/mm2 | |
| Mean | 34 | 1213 | 60 | 3313 | 46 | 2737 |
| Mdn | 23 | 495 | 67 | 2355 | 39 | 2013 |
| 75th Perc | 64 | 2193 | 82 | 4125 | 85 | 4583 |
| 25th Perc | 7 | 180 | 38 | 985 | 10 | 65 |
| IQR | 57 | 2013 | 44 | 3140 | 74 | 4518 |
| SD | 32 | 1312 | 31 | 3169 | 37 | 3092 |
| Comparison | HV vs. EoE | GERD vs. HV | EoE vs. GERD | |||
| P (U-test) | 0.30 | 0.32 | 0.02 | 0.02 | 0.25 | 0.29 |
Eosinophilic peroxidase (EPX)
Two separate ROIs per patient
Show a stepwise increase in mean values from HV via GERD to EoE (Table 4a). The number of positive detections (cells) was significantly higher among both EoE and GERD patients than among HV patients. The percentage of positive cells was significantly higher in EoE than in GERD.
EPX, Two ROIs per subject
| EPX Two ROIs per subject | Healthy volunteers | GERD patients | EoE patients | |||
|---|---|---|---|---|---|---|
| n 15 (30 ROIs) | n 20 (40 ROIs) | n 20 (40 ROIs) | ||||
| Pos % | Nr Pos/mm2 | Pos % | Nr Pos/mm2 | Pos % | Nr Pos/mm2 | |
| Mean | 30 | 1475 | 25 | 2096 | 42 | 2700 |
| Mdn | 22 | 635 | 10 | 355 | 37 | 1910 |
| 75th Perc | 53 | 1905 | 51 | 3078 | 69 | 3895 |
| 25th Perc | 4 | 90 | 3 | 47,5 | 12 | 355 |
| IQR | 49 | 1815 | 48 | 3030 | 57 | 3540 |
| SD | 31 | 1812 | 31 | 3158 | 32 | 2618 |
| Comparison | HV vs. EoE | GERD vs. HV | EoE vs. GERD | |||
| P (U-test) | 0.12 | 0.03 | 0.34 | 0.81 | 0.01 | 0.03 |
Peak ROI values
Confirm the stepwise increase in mean values between groups and show a significant difference comparing percent positive cells between HV and GERD (Table 4b).
EPX, One peak ROI per subject
| EPX One peak ROI per subject | Healthy volunteers | GERD patients | EoE patients | |||
|---|---|---|---|---|---|---|
| n 15 | n 20 | n 20 | ||||
| Pos % | Nr Pos/mm2 | Pos % | Nr Pos/mm2 | Pos % | Nr Pos/mm2 | |
| Mean | 35 | 1766 | 29 | 2576 | 46 | 3004 |
| Mdn | 28 | 860 | 14 | 570 | 45 | 2430 |
| 75th Perc | 55 | 2375 | 54 | 5360 | 69 | 4273 |
| 25th Perc | 5 | 155 | 5 | 97,5 | 15 | 685 |
| IQR | 72 | 2220 | 49 | 5263 | 54 | 3588 |
| SD | 33 | 2088 | 33 | 3563 | 33 | 2713 |
| Comparison | HV vs. EoE | GERD vs. HV | EoE vs. GERD | |||
| P (U-test) | 0.3 | ns | 0.01 | ns | ns | ns |
Mean ROI values
Confirm the stepwise increase in means from HV via GERD to EoE, but no significance is reached in any parameter between the groups (Table 4c).
EPX, Mean of 2 ROIs per subject
| EPX Mean of 2 ROIs per subject | Healthy volunteers | GERD patients | EoE patients | |||
|---|---|---|---|---|---|---|
| n 15 | n 20 | n 20 | ||||
| Pos % | Nr Pos/mm2 | Pos % | Nr Pos/mm2 | Pos % | Nr Pos/mm2 | |
| Mean | 30 | 1475 | 25 | 2096 | 42 | 2700 |
| Mdn | 19 | 740 | 10 | 435 | 40 | 2035 |
| 75th Perc | 48 | 1980 | 43 | 4040 | 68 | 4648 |
| 25th Perc | 4 | 90 | 3 | 62,5 | 13 | 455 |
| IQR | 44 | 1890 | 40 | 3978 | 55 | 4193 |
| SD | 31 | 1780 | 31 | 3094 | 32 | 2574 |
| Comparison | HV vs. EoE | GERD vs. HV | EoE vs. GERD | |||
| P (U-test) | ns | ns | ns | ns | ns | ns |
Eotaxin-3
The mean values were generally higher in the two patient groups than in the HV group (Table 5a–5c). However, only by counting two ROIs per subject did these differences reach significance, while no significance was obtained when comparing the two patient groups to each other (Table 5a).
ET, Two ROIs per subject
| ET Two ROIs per subject | Healthy volunteers | GERD patients | EoE patients | |||
|---|---|---|---|---|---|---|
| n 15 (30 ROIs) | n 21 (42 ROIs) | n 19 (38 ROIs) | ||||
| Pos % | Nr Pos/mm2 | Pos % | Nr Pos/mm2 | Pos % | Nr Pos/mm2 | |
| Mean | 10 | 740 | 29 | 2429 | 26 | 2121 |
| Mdn | 1 | 10 | 16 | 725 | 14 | 680 |
| 75th Perc | 12 | 600 | 53 | 4563 | 50 | 2540 |
| 25th Perc | 0 | 0 | 0 | 13 | 0 | 10 |
| IQR | 12 | 600 | 52 | 4550 | 50 | 2530 |
| SD | 16 | 1396 | 33 | 3140 | 29 | 3238 |
| Comparison | HV vs. EoE | GERD vs. HV | EoE vs. GERD | |||
| P (U-test) | 0.02 | 0.02 | 0.01 | 0.01 | ns | ns |
ET, One peak ROI per subject
| ET One peak ROI per subject | Healthy volunteers | GERD patients | EoE patients | |||
|---|---|---|---|---|---|---|
| n 15 | n 21 | n 19 | ||||
| Pos % | Nr Pos/mm2 | Pos % | Nr Pos/mm2 | Pos % | Nr Pos/mm2 | |
| Mean | 12 | 835 | 32 | 2843 | 30 | 2498 |
| Mdn | 1 | 30 | 17 | 840 | 21 | 1290 |
| 75th Perc | 21 | 925 | 62 | 4700 | 51 | 3275 |
| 25th Perc | 0 | 5 | 1 | 40 | 3 | 25 |
| IQR | 21 | 920 | 61 | 4660 | 48 | 3250 |
| SD | 17 | 1467 | 34 | 3529 | 30 | 3483 |
| Comparison | HV vs. EoE | GERD vs. HV | EoE vs. GERD | |||
| P (U-test) | ns | 0.05 | ns | ns | ns | ns |
ET, Mean of 2 ROIs per subject
| ET Mean of 2 ROIs per subject | Healthy volunteers | GERD patients | EoE patients | |||
|---|---|---|---|---|---|---|
| n 15 | n 21 | n 19 | ||||
| Pos % | Nr Pos/mm2 | Pos % | Nr Pos/mm2 | Pos % | Nr Pos/mm2 | |
| Mean | 10 | 740 | 27 | 2429 | 26 | 2121 |
| Mdn | 1 | 15 | 13 | 725 | 14 | 570 |
| 75th Perc | 13 | 583 | 40 | 4180 | 43 | 2530 |
| 25th Perc | 0 | 3 | 1 | 20 | 2 | 13 |
| IQR | 13 | 580 | 39 | 4160 | 41 | 2518 |
| SD | 15 | 1411 | 32 | 3091 | 29 | 3263 |
| Comparison | HV vs. EoE | GERD vs. HV | EoE vs. GERD | |||
| P (U-test) | ns | ns | ns | ns | ns | ns |
Galectin-3
Regarding Gal-3, no significant difference between groups was observed in any of the analyses (therefore not depicted).
DISCUSSION
In accordance with our hypothesis, we found that iNOS was overexpressed in both EoE and GERD patients compared with that in HVs, but the expected difference between the two diseases was unsupported. There are few studies on the expression of NO via quantification of iNOS in esophageal biopsies, but in a small controlled study on active EoE patients, a significant overexpression of iNOS, which improved significantly after treatment, was found.15
Regarding NT, the mean values were higher in the disease groups than in the HVs. However, this overexpression of NT only reached statistical significance among GERD patients. Therefore, the suggestion of an even more pronounced NO activation among EoE patients in comparison to GERD patients is not supported by our results. Rather, GERD patients seem to stand out more than EoE patients regarding the overexpression of NT (Table 4a–4c). At first sight, this finding may be somewhat unexpected. It would, however, be plausible if GERD could be considered as a more constantly occurring inflammatory disease, while EoE is characterized as being a more short-lived relapsing inflammatory disease. This might reflect a more constant prevailing anatomic cause in GERD, while the grade of inflammation in EoE may vary by environment and diet. Furthermore, an overexpression of enzymatic NO production among GERD patients is in accordance with earlier human experimental controlled trials.5,16
Overall, our results are somewhat disappointing regarding the benefit of iNOS or NT as tools to differentiate between EoE and GERD.
Regarding EPX, a stepwise increase in the mean number of positive cell counts per mm2 was confirmed moving from HV, via GERD, to EoE. However, a pathognomonic association with EoE was not confirmed. This result conflicts with studies with similar IHC techniques.17,18 However, one of these studies was performed in children with eosinophilic gastritis and duodenitis, where the number of eosinophils counted is much higher.17 A controlled, but not randomized, study on EoE patients showed that EPX/mm2 correlated with the number of eos/hpf and could identify subjects with EoE.19 As these two last-mentioned studies, with a similar technique as ours, have obtained plausible results, there is reason to believe that the method itself should be able to work.
In the choice between eotaxin-1 or 3, we chose the latter, as it is reported to be more specific for epithelial cells than for smooth muscular cells.19 In our results regarding Eotoxin-3, the two disease states seem to differ somewhat from HVs, but the specificity for EoE over GERD is not supported. In another study, eotaxin was particularly useful for predicting responders.20 This result is opposed by a study configured in a similar way as ours but that conducted its analysis with two ‘blinded’ pathologists, which revealed a high specificity of EO-3 etaxin-3 for EoE.21 Therefore, perhaps it is difficult for the automatized systems to outperform the diagnostic ability of the experienced human eye. Then again, pathologists might be biased by other pathognomonic tissue appearances in EoE.
When this study was designed, galectin-3 was reported to be significantly upregulated in the EoE compared to the controls.9,22 We therefore included this tentative EoE marker, obviously without any significant findings. Based on today’s knowledge, galectin-10, a marker of regulatory eosinophils, would be a better choice.23
Among the strengths of our study is the automatized calculation using the same script with the same settings and within the same sized areas (ROIs) for the calculation of every image. A downside is the subjective placement. This problem is, however, counteracted by having the images randomized and blinded. Hence, the problem of subjective placing of ROIs should not add any systematic error, but subjective placing may increase the variability. Generally, the significance found in our study is more prominent when the double-number regions are counted. This finding suggests that the limited size in combination with considerable variability may imply a risk for type 2 error.
This study mainly confirms findings regarding iNOS and EPX and makes some noteworthy speculations regarding NT. However, it leaves clinicians without any new sharp diagnostic tools for differentiating and monitoring the two kinds of esophagitis.
CONCLUSION
When measured as two separate ROIs in each histologic specimen, iNOS, NT, and ET-3 succeeded in differentiating between the healthy and inflammatory states. GERD patients displayed the highest levels of NT, differing significantly from HVs. Neither iNOS, nor NT alone, was able to differentiate between EoE and GERD. Therefore, Eosinophil Peroxidase is a better candidate. Our findings should be externally validated in new and larger patient groups.
ACKNOWLEDGMENTS
Biomedical Scientist Hannah Johansson, Department of Clinical Pathology, Trollhättan, Regional Laboratory Medicine, Sahlgrenska University Hospital, for preparing the biopsies and IHC staining.
Associate Professor Johan Mölne, Department of Pathology, Sahlgrenska University Hospital, for digitalizing the material.
The Centre for Cellular Imaging, University of Gothenburg, and the National Microscopy Infrastructure, NMI (VR-RFI 2019-00217) for assistance in image analysis.
For communication with the editorial office: John Plate, MD, Department of Otorhinolaryngology, Head and Neck Surgery, NU-Hospital Group, NAL Hospital, Larketorpsvagen 20, 461 73 Trollhattan, Sweden. Email workplace: [email protected], E-mail private: [email protected], Telephone workplace (exchange): +46 10 435 00 00, Telephone private: +46 70 433 99 89.
Specific author contributions: John Plate (Data curation, Formal analysis, Validation, Writing—review & editing), Mogens Bove (Conceptualization, Data curation, Formal analysis, Methodology, Supervision, Validation, Visualization, Writing—original draft, Writing—review & editing), Helen M. Larsson (Investigation, Supervision, Writing—review & editing), Elisabeth Norder Grusell (Investigation, Validation, Writing—review & editing), Nabanita Chatterjee (Methodology, Software, Analysis, Validation, Visualization, Writing—review & editing), Leif E. Johansson (Validation, Writing—review & editing), and Henrik Bergquist (Conceptualization, Resources, Project administration, Supervision, Visualization, Writing—review & editing)
