


Abstract
Esophagectomy is a complex operation with significant morbidity and mortality. Previous studies have shown that sub-specialization is associated with improved esophagectomy outcomes. We hypothesized that disparities would exist among esophagectomy patients regarding access to thoracic surgeons based on demographic, geographic, and hospital factors. The Premier Healthcare Database was used to identify adult inpatients receiving esophagectomy for esophageal and gastric cardia cancer, Barrett’s esophagus, and achalasia from 2015 to 2019 using ICD-10 codes. Patients were categorized as receiving their esophagectomy from a thoracic versus non-thoracic provider. Survey methodology was used to correct for sampling error. Backwards selection from bivariable analysis was used in a survey-weighted multivariable logistic regression to determine predictors of esophagectomy provider specialization. During the study period, 960 patients met inclusion criteria representing an estimated population size of 3894 patients. Among them, 1696 (43.5%) were performed by a thoracic surgeon and 2199 (56.5%) were performed by non-thoracic providers. On multivariable analysis, factors associated with decreased likelihood of receiving care from a thoracic provider included Black (OR 0.41, p < 0.001), Other (OR 0.21, p < 0.001), and Unknown race (OR 0.22, p = 0.04), and uninsured patients (OR 0.53, p = 0.03). Urban hospital setting was associated with an increased likelihood of care by a thoracic provider (OR 4.43, p = 0.001). In this nationally representative study, Nonwhite race, rural hospital setting, and lower socioeconomic status were factors associated with decreased likelihood of esophagectomy patients receiving care from a thoracic surgeon. Efforts to address these disparities and provide appropriate access to thoracic surgeons is warranted.
INTRODUCTION
Advanced surgical training is commonplace with many surgeons pursuing fellowship training to sub-specialize in a specific field.1 Previous studies across different surgical fields suggest a relationship between surgical sub-specialization and improved outcomes of complex surgical procedures.2–7 Among patients receiving thoracic surgery, specialty training has been shown to be an independent predictor of lower mortality after esophageal resection.8 These and other outcome relationships have led to recommendations that esophagectomies be regionalized to improve patient outcomes.9
The current US healthcare system is fragmented and disparities and access to providers, including specialty care, are well documented.10–12 Healthy People 2020, a 10-year agenda created to improve the Nation’s health, cites improving access to healthcare as one of its main priorities over the next decade.13 In addition to the inequities observed on a national scale, social and racial disparities affecting access to care have also been documented in thoracic surgery.14,15
In North America, a specialist esophageal surgeon is often synonymous with thoracic surgeon. Given the known advantages to provider specialization, the purpose of this study was to determine if disparities in access to thoracic surgeon specialization exist among esophagectomy patients in the USA. We used a nationally representative database to determine whether social, racial, or regional differences are present among esophagectomies being performed by thoracic surgeon providers. We hypothesized that disparities would exist regarding access to thoracic surgeons among esophagectomy patients.
METHODS
Data source
This study used the Premier Healthcare Database (PHD) to analyze disparities and access to thoracic surgeon specialization among patients receiving esophagectomy. The PHD is a nationally representative database that contains de-identified clinical data from more than a thousand participating hospitals, capturing patient billing records, costs, and coding histories. It is comprised of data from more than one billion patient encounters, which equates to approximately 25% of all inpatient admissions in the USA. The database is maintained by Premier, Inc. (Washington, D.C.) and contains hospital admissions (patient demographic characteristics), hospital characteristics, surgeon characteristics, payer information, Diagnosis Related Groups (DRGs), primary and secondary International Classification of Diseases (ICD) diagnosis and procedure codes, current procedural terminology codes, and resource utilization (hospital length-of-stay and in-hospital mortality).
Patient selection
The PHD was queried for all adult inpatients age |$\ge$|18 who underwent an elective esophagectomy for esophageal or gastric cardia cancer, Barrett’s esophagus, or achalasia. Procedure codes and diagnosis codes were determined using ICD-10 version coding. All adult inpatient admissions between fourth quarter 2015 and 2019 were included. Patients were excluded if type of surgeon performing the operation was unknown, if discharge status was unknown, if a patient had a non-elective admission type, or if the patient’s visit status was not inpatient. Patients were categorized by the provider specialty performing the esophagectomy: thoracic surgery, general surgery, cardiovascular surgery, or surgical oncology. If patients had multiple provider specialties listed, the most specialized provider category was used (thoracic > cardiovascular > surgical oncology > general surgery). For the purposes of this study, provider type was analyzed as thoracic versus non-thoracic.
Outcome measures
The outcome of interest was whether the esophagectomy provider was categorized as thoracic surgery specialization. The secondary outcome measures were hospital length-of-stay and in-hospital mortality.
Statistical analysis
Hospital and patient characteristics associated with thoracic surgeon specialization were compared using bivariable analysis. Elixhauser comorbidity score was generated from ICD-10 coding to estimate comorbidities using software from the Healthcare Cost and Utilization Project (HCUP). Survey methodology was used to correct for sampling error. Patient level weighting derived from the PHD was used to estimate a nationally representative sample. Categorical variables were compared using survey weight-adjusted Pearson’s |$\chi$|2 test. A temporal trend analysis was also performed of esophagectomy provider type over the study period.
Explanatory variables that were significant from the bivariable analysis were included in a survey-weighted multivariable logistic regression analysis to determine whether there were social, regional, and racial differences in provider specialization performing esophagectomy.
Statistical analysis was performed using STATA MP (Version 16.0, Statacorp, College Station, TX). Statistical significance was set at a P-value ≤0.05. Since all patient-related data in the PHD is aggregated, de-identified and HIPAA-compliant, this study was determined to be exempt from Institution Review Board review.
RESULTS
During the study period, the PHD included 960 patients who met inclusion criteria, representing an estimated population size of 3894 patients. Among them, 1696 (43.5%) were performed by a thoracic surgeon, while the remaining 2199 (56.5%) were performed by non-thoracic providers: 1289 (33.1%) general surgery, 182 (12.4%) cardiovascular, 427 (11.0%) surgical oncology. Figure 1 represents trends in esophagectomy by provider type during the study period. The proportion of esophagectomies performed by thoracic surgeons increased from 2015 to 2019 (42.3% to 47.4%), whereas the proportion performed by general surgeons decreased (43.0% vs. 29.5%).
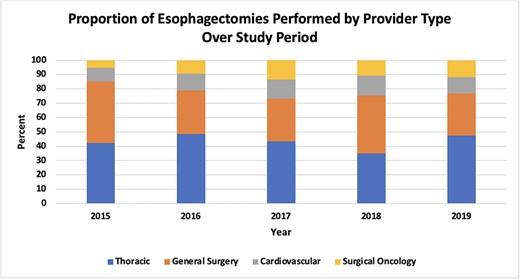
Trends in esophagectomy by provider type (thoracic surgeon vs. general surgeon vs. cardiovascular surgeon vs. surgical oncologist) in the Premier Healthcare Database from 2015 to 2019.
On bivariable analysis, several differences existed between the two groups (Table 1). Patients who were uninsured (2.9% vs. 6.2%, p = 0.03), identified as Other race (1.7% vs. 8.0%, p = 0.004), received care in a rural hospital setting (3.1% vs. 13.3%, p = 0.02), or had metastatic cancer (13.0% vs. 19.6%, p = 0.02) were significantly less likely to undergo esophagectomy by a thoracic provider. In contrast, patients of White race were significantly more likely to receive care by a thoracic provider (91.2% vs. 85.7%, p = 0.004).
Bivariable analysis of patient and hospital characteristics compared by thoracic provider type versus non-thoracic provider type among patients who underwent an esophagectomy in the Premier Healthcare Database from 2015 to 2019
| Thoracic provider (n = 1696) | Non-thoracic provider (n = 2199) | P-value | |
|---|---|---|---|
| Age |$\ge$|65 | 874 (51.5%) | 1108 (50.4%) | 0.73 |
| Male sex | 1362 (80.3%) | 1752 (79.7%) | 0.80 |
| Race Asian Black White Other Unknown | 43 (2.6%) 77 (4.6%) 1547 (91.2%) 29 (1.7%) 0 (0%) | 32 (1.5%) 76 (3.5%) 1883 (85.7%) 175 (8.0%) 31 (1.4%) | 0.004 |
| Insurance type Medicare Medicaid Managed Other (includes uninsured, charity) | 862 (50.8%) 204 (12.0%) 581 (34.3%) 49 (2.9%) | 1061 (48.3%) 183 (8.3%) 819 (37.2%) 136 (6.2%) | 0.03 |
| Hospital size (# of beds) <300 300–499 |$\ge$|500 | 232 (13.7%) 386 (22.7%) 1078 (63.6%) | 249 (11.3%) 698 (31.7%) 1252 (56.9%) | 0.51 |
| Hospital region Midwest Northeast South West | 370 (21.8%) 427 (25.2%) 565 (33.3%) 335 (19.7%) | 685 (31.2%) 226 (10.3%) 889 (40.5%) 398 (18.1%) | 0.18 |
| Hospital location Rural Urban | 53 (3.1%) 1643 (96.9%) | 292 (13.3%) 1907 (86.7%) | 0.02 |
| Teaching hospital (vs. not) | 1078 (63.6%) | 1524 (69.3%) | 0.51 |
| Comorbidities Congestive heart failure Cardiac arrhythmias Pulmonary circulation disorders Peripheral vascular disease Chronic pulmonary disease Renal failure Liver disease Metastatic cancer Coagulopathy Obesity Weight loss Hypertension, complicated | 76 (4.5%) 666 (39.3%) 59 (3.5%) 35 (2.0%) 511 (30.1%) 132 (7.8%) 63 (3.7%) 221 (13.0%) 51 (3.0%) 200 (11.8%) 533 (31.4%) 168 (9.9%) | 144 (6.6%) 842 (38.3%) 101 (4.6%) 37 (1.7%) 666 (30.3%) 113 (5.2%) 87 (3.9%) 431 (19.6%) 100 (4.5%) 339 (15.4%) 697 (31.7%) 187 (8.5%) | 0.20 0.79 0.41 0.66 0.96 0.15 0.85 0.02 0.33 0.08 0.95 0.48 |
Data are presented as n (%) or mean (SE).
To address potential confounding, multivariable logistic regression was performed using backwards selection from bivariable analysis (Table 2). Factors associated with decreased likelihood of receiving care by a thoracic provider included Black (OR 0.36, p < 0.001), Other (OR 0.21, p < 0.001), and Unknown (OR 0.15, p = 0.02) race as well as patients who were uninsured (OR 0.53, p = 0.03). Patients who received care in the Northeast region of the country (OR 2.53, p = 0.03) or at an urban hospital setting (OR 4.43, p = 0.001) were significantly more likely to receive care by a thoracic surgeon.
Multivariable logistic regression of factors associated with receiving care from a thoracic surgeon among patients who underwent an esophagectomy in the Premier Healthcare Database from 2015 to 2019
| Odds Ratio | 95% Confidence Interval | P-value | |
|---|---|---|---|
| Race White Asian Black Other Unknown | ref 0.67 0.36 0.21 0.15 | 0.34–1.32 0.24–0.55 0.11–0.42 0.04–0.70 | 0.24 <0.001 <0.001 0.02 |
| Insurance type Managed Medicare Medicaid Other (includes uninsured, charity) | ref 0.86 0.90 0.53 | 0.68–1.08 0.65–1.25 0.30–0.93 | 0.20 0.53 0.03 |
| Hospital size (# of beds) |$\ge$|500 <300 300–499 | ref 0.63 0.64 | 0.28–1.41 0.32–1.30 | 0.26 0.22 |
| Hospital region Midwest Northeast South West | ref 2.53 1.15 1.48 | 1.09–5.86 0.59–2.24 0.56–3.94 | 0.03 0.69 0.43 |
| Hospital location Rural Urban | ref 4.43 | 1.89–10.43 | 0.001 |
| Teaching hospital (vs. not) | 1.01 | 0.52–1.95 | 0.99 |
For secondary outcomes, there was no difference in length of hospitalization (17.4d thoracic vs. 14.9d non-thoracic, p = 0.40) or in-hospital mortality (3.9% thoracic vs. 5.3% non-thoracic, p = 0.32) between the two groups.
DISCUSSION
An esophagectomy is an operation that carries a high risk of patient morbidity and mortality16,17 and often requires care by specialized thoracic surgeons. In this study, we found significant social, racial, and regional disparities that predicted which patients were more or less likely to be treated by a thoracic surgeon. Patients who were Nonwhite had lower socioeconomic status or received care at a rural hospital setting were significantly less likely to undergo an esophagectomy by a thoracic surgeon. Furthermore, over our 5-year study period, almost half (43.5%) of patients underwent an esophagectomy by a non-thoracic surgeon. Bringing awareness to the disparities that exist will help to create change so that all esophagectomy patients have equal opportunity and access to specialty surgical care.
These disparities identified in our study are not unique to thoracic surgery and have also been studied across many other surgical sub-specialties including colorectal and vascular surgery.18–20 In particular, racial minority groups have been shown to have inferior perioperative outcomes with unequal access to appropriate healthcare resources being cited as a significant modifiable factor attributing to this phenomenon.18 Furthermore, a recently published study looking at the influence of race, insurance status, and rurality found that among lung and colorectal cancer patients, uninsured status was the largest predictor of receipt of surgery.20 As access to care is one of the few modifiable factors that can be targeted to close the gap on these disparities, greater effort needs to be placed on making specialty surgical care available to all.
Previous studies suggest that specialty training improves outcomes in patients undergoing esophagectomy. In an analysis of Medicare patients, Dimick et al.8 found that when adjusting for other patient and hospital factors, specialty training in thoracic surgery was an independent predictor of lower mortality after esophageal resection for cancer. Based on these findings, best practices for esophageal cancer care include referral to specialized centers with thoracic surgeons on staff. Although our study found that patients who received care by a thoracic surgeon had a trend toward lower in-hospital mortality, this was not statistically significant. Reasons for this discordance include that we were unable to control for other factors in our study such as clinical stage, neoadjuvant treatment, and type of esophagectomy performed.
Not only does surgical specialty training improve outcomes for esophagectomy, but surgeon volume should also be an important consideration.21,22 In an expert review, Chang9 discussed that complex cancer resections such as esophagectomy should be referred to centers with specialization in esophageal cancer care, with the most important factor for referral being high operative volume. Within the PHD, we found that averaged over the 5-year study period, thoracic surgeons had the highest annual rate of esophagectomy performance in the country.
Our study has several limitations. This is a retrospective review of a large national database. Furthermore, the PHD lacks granular data surrounding clinical staging, neoadjuvant treatment, and intraoperative and surgical data which did not allow us to compare important oncologic and survival outcomes between the two groups. This lack of data may also have affected our secondary outcomes of length-of-stay and in-hospital mortality as not all procedures coded as esophagectomy are equal regarding postoperative morbidity and mortality rates. Although we believe that provider specialty was accurately reported within the database based on each surgeon’s training and credentials, there may exist some variability in the definition of each surgical subspecialty. Another important limitation of our study is that it may underestimate the disparities identified in this paper. Patients who did not have access to a specialty provider may not have been offered surgery, which is inferior and non-standard of care for esophageal cancer patients. Lastly, we do not have data regarding individual surgeon volume which may play an important role in outcomes as higher case volume has been shown to be related to better short-term and oncologic outcomes among esophagectomy patients.
CONCLUSIONS
In this study of a nationally representative database, factors associated with a decreased likelihood of esophagectomy patients receiving care from a thoracic provider included Nonwhite race, lower socioeconomic status, and receipt of care in a rural hospital setting. As studies have shown improved outcomes with provider sub-specialization for complex surgical procedures such as esophagectomy, efforts to address these disparities and provide appropriate access to thoracic surgeons is warranted for best practices to improve patient outcomes.
DISCLOSURES
CWT reports that he is a consultant and recipient of a grant for Zimmer Biomet. CWT is also a consultant for SigMedical, Atricure and Medtronic. SGW is a consultant for Intuitive and Bristol Meyer Squibbs. None of these relationships have affected our work. The other authors have no conflicts of interest to declare.
DATA AVAILABILITY
Study data are not openly available. The authors are willing to share data upon reasonable request at the corresponding authors.
