


Summary
The 2011 National Comprehensive Cancer Network guidelines first incorporated the results of the landmark CROSS trial, establishing induction therapy (chemotherapy ± radiation) and surgery as the treatment standard for locoregional esophageal cancer in the United States. The effect of guideline publication on socioeconomic status (SES) inequalities in cancer treatment selection remains unknown.
Patients diagnosed with Stage II/III esophageal cancer between 2004 and 2013 who underwent curative treatment with definitive chemoradiation or multimodality treatment (induction and surgery) were identified from the Surveillance, Epidemiology and End Results (SEER)-Medicare registry. Clinicopathologic characteristics were compared between the two therapies. Multivariable regression analysis was used to adjust for known factors associated with treatment selection. An interaction term with respect to guideline publication and SES was included Of the 2,148 patients included, 1,478 (68.8%) received definitive chemoradiation and 670 (31.2%) induction and surgery. Guideline publication was associated with a 16.1% increase in patients receiving induction and surgery in the low SES group (21.4% preguideline publication vs. 37.5% after). In comparison, a 4.5% increase occurred during the same period in the high SES status group (31.8% vs. 36.3%). After adjusting for factors associated with treatment selection, guideline publication was associated with a 78% increase in likelihood of receiving induction and surgery among lower SES patients (odds ratio 1.78; 95% confidence interval (CI): 1.05,3.03).
Following the new guideline publication, patients living in low SES areas were more likely to receive optimal treatment. Increased dissemination of guidelines may lead to increased adherence to evidence-based treatment standards.
INTRODUCTION
Esophageal cancer has historically been considered a highly lethal disease; however, new developments in medical and surgical treatment have resulted in an increase in all-stage 5-year overall survival (OS) from 4.9% to 18.8% over the past four decades.1 While surgical resection remains fundamental to curative treatment, induction therapy with the addition of chemotherapy and/or radiation has been demonstrated to improve survival in patients with locally advanced esophageal cancer.2 Although the literature strongly supports the benefits of induction therapy and surgery over definitive chemoradiation, significant inequalities remain in receipt of evidence-based treatment by patients in the United States with devastating effects on patient survival.3–6
We previously demonstrated that race and socioeconomic status (SES) were linked to both differences in modality of care delivered and risk for low-quality cancer care, as defined by adherence to evidence-based national treatment guidelines.7,8 In 5072 surveillance, epidemiology and end results (SEER)-Medicare patients with locoregional esophageal cancer, 35% of patients received no treatment at all and 75% of the patients who were treated received inappropriate care consisting of chemotherapy and/or radiation alone.7 Minority and low SES patients have a reduced likelihood of receiving aggressive treatment despite improved survival demonstrated with surgical intervention.5-7,9 Observed inequalities in utilization of induction therapy and surgical resection may be attributed in part to clustering of low SES patients in healthcare systems that have decreased use of evidence-based care processes.10
Over the last 15 years, multiple well-designed randomized controlled studies demonstrated the benefits of neoadjuvant chemoradiation therapy, which resulted in subsequent physician adaptation of this approach into clinical practice; however, it was the Dutch CROSS trial that established a clear national treatment standard for locally advanced esophageal cancer in the United States.11,12 This randomized control trial demonstrated a 34% improvement in 5-year OS in patients treated with concurrent neoadjuvant chemoradiation therapy compared to surgery alone. These findings were determined to be strong enough evidence to recommend the standard use of neoadjuvant chemoradiation for locoregional disease; as such, in 2011 the National Comprehensive Cancer Network (NCCN) first definitively incorporated the results of this trial into their standard treatment algorithm for locoregionally advanced esophageal cancer.13
The effect of published guidelines on observed SES disparities in treatment selection in the United States remains unknown. Increased dissemination of evidence-based treatment standards may reduce current gaps in the quality of care delivered to undertreated populations. The purpose of the current analysis was to evaluate the impact of changes in treatment guidelines on disparities in treatment selection for locoregionally advanced esophageal cancer in the United States.
MATERIALS AND METHODS
We utilized the SEER registry linked to Medicare claims data to identify primary cases of esophageal cancer. The SEER registry is a population-based database that includes incident cancer cases covering almost 30% of the US population.14 This registry collects information pertaining to site and extent of disease, sociodemographic characteristics, and survival. Patients aged 65 and older who are living in SEER registry regions have linked Medicare fee-for-service (FFS) billing claims, which provides additional data regarding healthcare utilization. Medicare is health insurance that is provided by the United States government to all individuals aged 65 and older, as well as individuals with select disabilities or end-stage renal disease. It is composed of several services, including Medicare FFS Parts A and B, which cover hospital and outpatient services, respectively.15 Alternatively, individuals may enroll in a Health Maintenance Organization (HMO) plan, in which hospital and outpatient coverage is provided by a private company that contracts with Medicare. HMOs are networks of providers and hospitals that are outside of Medicare FFS but accept Medicare payment. As such, any treatment provided by an HMO may not appear within Medicare FFS claims. Due to the de-identified nature of the data, this study was deemed exempt by the Institutional Review Board at Memorial Sloan Kettering Cancer Center.
Patients diagnosed with incident primary esophageal cancer between 2004 and 2013 were identified from the SEER-Medicare linked database using ICD-O-3 codes (Appendix 1). The study cohort was restricted to patients diagnosed with nonmetastatic stage II or III (AJCC 6th edn.) esophageal adenocarcinoma or squamous cell carcinoma (SCC) who received definitive chemoradiation or induction (chemotherapy ± radiation) and surgery, which are considered the only curative treatments for esophageal cancer (Appendix 2). Our methodology for classification of treatment modality utilizing SEER data has been described previously.7 We excluded patients with upper esophageal cancer as currently they are recommended to receive nonoperative management. Patients who were not continuously covered by Medicare parts A and B or were enrolled in an HMO from one year prior through one year following diagnosis were also excluded to ensure complete claims and accurately account for treatment given.
Univariate analyses were performed using chi-square tests. A multivariable logistic regression model was applied in order to identify factors associated with receipt of induction and surgery compared to definitive chemoradiation. Variables that were significant in the univariate analyses or of clinical interest were included in the model. The model was adjusted for histology (adenocarcinoma, squamous cell), AJCC stage (6th edn; II, III), aged at diagnosis (66–69, 70–74, 75–79, 80+ years), race (white, black, other), marital status (married, not married/unknown), Charlson Comorbidity Index in the year prior to diagnosis (0, 1, 2+ comorbidities), and residence (metro, non-metro). An interaction term with respect to publication of the 2011 NCCN guidelines (pre-/postguideline publication) and census-level education (22- < 80% completing high school, ≥80% completing high school) as a proxy for SES was included to determine if the potential effect of treatment guidelines varied across education level.
Census-level education (% high school completion) and census-level median income were both initially considered for use as a proxy for SES. Census-level education was strongly correlated with census-level median income, but education was more strongly associated with treatment selection than income in a univariate analysis and was chosen as the proxy for SES. Education was initially grouped into quartiles based on the percent in a census district completing high school (22- < 80%, 80- < 88%, 88- < 93% and 93%–100%). Because the difference between the bottom of the second quartile and the top of the fourth quartile was so small, we collapsed the upper three quartiles to compare with the lowest education group. Though of interest, there were too few non-white patients to evaluate for the interaction term between race and the publication of the NCCN guidelines in 2011. Adjusted odds ratios (OR) and 95% confidence intervals (CI) are presented. All computations were performed in SAS v9.4 (Cary, NC).
RESULTS
We identified 5967 patients aged 66 years and older with incident stage II or III esophageal adenocarcinoma or SCC. Of those, 2090 were excluded for either incomplete Medicare coverage (n = 512) or HMO enrollment (n = 1614). Patients with incomplete information on education (n = 17) were also excluded. An additional 1712 patients were also excluded because they did not receive treatment with curative intent. Our final study cohort included 2148 patients treated with definitive chemoradiation (68.8%; n = 1478) or induction and surgery (31.2%; n = 670).
Most patients were male (77.0%) and white (88.9%) (Table 1). Tumors were most frequently localized in the distal esophagus and gastroesophageal junction (GEJ; 73.6%) and had adenocarcinoma histology (71.4%). Use of induction and surgery increased over the study period from 25.0% in 2004 to 37.7% in 2013. Overall use of induction and surgery significantly increased from 29.5% to 36.6% after the publication of the NCCN guidelines (P = 0.0025). Surgery and induction use increased in the low SES group by 16.1% after publication of the NCCN guidelines (21.4% preguideline publication vs. 37.5% after). In comparison, a 4.5% increase occurred during the same period in the high SES status group (31.8% to 36.3%; Fig. 1).
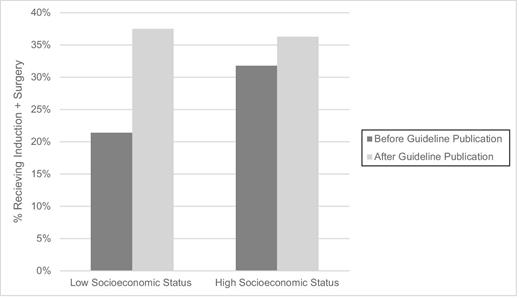
Change in use of induction and surgery by socioeconomic status.
Characteristics of patients with esophageal cancer treated with induction and surgery or chemoradiation (n = 2148)
| Characteristics | Overall (n = 3191) n (column%) | Definitive chemoradiation (n = 1478) n (row%) | Induction and surgery (n = 670) n (row%) | Chi-square P-value |
|---|---|---|---|---|
| Year of diagnosis | 0.0805 | |||
| 2004 | 192 (8.9%) | 144 (75.0%) | 48 (25.0%) | |
| 2005 | 178 (8.3%) | 133 (74.7%) | 45 (25.3%) | |
| 2006 | 221 (10.3%) | 152 (68.8%) | 69 (31.2%) | |
| 2007 | 189 (8.8%) | 125 (66.1%) | 64 (33.9%) | |
| 2008 | 193 (9.0%) | 139 (72.0%) | 54 (28.0%) | |
| 2009 | 208 (9.7%) | 143 (68.8%) | 65 (31.3%) | |
| 2010 | 226 (10.5%) | 159 (70.4%) | 67 (29.6%) | |
| 2011 | 224 (10.4%) | 155 (69.2%) | 69 (30.8%) | |
| 2012 | 257 (12.0%) | 166 (64.6%) | 91 (35.4%) | |
| 2013 | 260 (12.1%) | 162 (62.3%) | 98 (37.7%) | |
| Histology | <0.0001 | |||
| Adenocarcinoma | 1534 (71.4%) | 960 (62.6%) | 574 (37.4%) | |
| Squamous cell | 614 (28.6%) | 518 (84.4%) | 96 (15.6%) | |
| AJCC stage | 0.2543 | |||
| Stage II | 1131 (52.7%) | 766 (67.7%) | 365 (32.3%) | |
| Stage III | 1017 (47.3%) | 712 (70.0%) | 305 (30.0%) | |
| Grade (at diagnosis) | <0.0001 | |||
| Well or moderately differentiated | 839 (39.1%) | 579 (69.0%) | 260 (31.0%) | |
| Poorly differentiated/undifferentiated | 986 (45.9%) | 641 (65.0%) | 345 (35.0%) | |
| Unknown grade | 323 (15.0%) | 258 (79.9%) | 65 (20.1%) | |
| Tumor location | <0.0001 | |||
| Distal esophagus and gastroesophageal junction (GEJ) | 1581 (73.6%) | 998 (63.1%) | 583 (36.9%) | |
| Esophagus NOS | 162 (7.5%) | 137 (84.6%) | 25 (15.4%) | |
| Middle third/thoracic | 405 (18.9%) | 343 (84.7%) | 62 (15.3%) | |
| Age at diagnosis (years) | <0.0001 | |||
| 66–69 | 597 (27.8%) | 323 (54.1%) | 274 (45.9%) | |
| 70–74 | 611 (28.4%) | 391 (64.0%) | 220 (36.0%) | |
| 75–79 | 517 (24.1%) | 374 (72.3%) | 143 (27.7%) | |
| 80+ | 423 (19.7%) | 390 (92.2%) | 33 (7.8%) | |
| Sex | <0.0001 | |||
| Male | 1654 (77.0%) | 1087 (65.7%) | 567 (34.3%) | |
| Female | 494 (23.0%) | 391 (79.1%) | 103 (20.9%) | |
| Race | <0.0001 | |||
| White | 1910 (88.9%) | 1285 (67.3%) | 625 (32.7%) | |
| Black | 140 (6.5%) | 124 (88.6%) | 16 (11.4%) | |
| Other | 98 (4.6%) | 69 (70.4%) | 29 (29.6%) | |
| Charlson comorbidity index | <0.0001 | |||
| 0 | 1116 (52.0%) | 718 (64.3%) | 398 (35.7%) | |
| 1 | 549 (25.6%) | 381 (69.4%) | 168 (30.6%) | |
| 2+ | 483 (22.5%) | 379 (78.5%) | 104 (21.5%) | |
| Residence | 0.0059 | |||
| Nonmetro | 344 (16.0%) | 215 (62.5%) | 129 (37.5%) | |
| Metro | 1804 (84.0%) | 1263 (70.0%) | 541 (30.0%) | |
| Geographic region | 0.3124 | |||
| West | 822 (38.3%) | 578 (70.3%) | 244 (29.7%) | |
| Northeast | 552 (25.7%) | 379 (68.7%) | 173 (31.3%) | |
| Midwest | 307 (14.3%) | 198 (64.5%) | 109 (35.5%) | |
| South | 467 (21.7%) | 323 (69.2%) | 144 (30.8%) | |
| Marital status | <0.0001 | |||
| Not married/unknown | 747 (34.8%) | 586 (78.4%) | 161 (21.6%) | |
| Married | 1401 (65.2%) | 892 (63.7%) | 509 (36.3%) | |
| Census-level income | 0.0089 | |||
| <$50,000 | 811 (37.8%) | 590 (72.7%) | 221 (27.3%) | |
| $50,000− <$100,000 | 1086 (50.6%) | 722 (66.5%) | 364 (33.5%) | |
| $100,000+ | 251 (11.7%) | 166 (66.1%) | 85 (33.9%) | |
| Census-level education, % completing high school | 0.0007 | |||
| ≥80% in census district completing HS | 1687 (78.5%) | 1131 (67.0%) | 556 (33.0%) | |
| <80% in census district completing HS | 461 (21.5%) | 347 (75.3%) | 114 (24.7%) |
Patients with SCC were less likely to receive induction and surgery than those with adenocarcinoma (15.6% vs. 37.4%, respectively; P < 0.0001). Distal esophageal and GEJ tumors were more likely to be treated with induction and surgery than tumors in the middle third (36.9% vs. 15.3%, respectively). Use of induction and surgery decreased with increasing age and number of comorbidities. Only 7.8% of patients aged 80+ underwent induction and surgery, as compared to 45.9% of patients aged 66–69 years. White patients were more likely to receive induction and surgery than black patients (32.7% vs. 11.4%, respectively). Married patients were also more likely to receive induction and surgery therapy than unmarried patients and patients with unknown marital status (36.3% vs. 21.6%, respectively P < 0.0001; Table 1).
In a multivariable logistic regression analysis modeling the odds of induction and surgery, there was a significant effect of publication of the 2011 NCCN guidelines among patients living in low SES areas: after 2011, low SES patients were 78% more likely to undergo induction and surgery than before (OR 1.78, 95% CI 1.05–3.03). In high SES areas, the effect was mitigated (OR 1.20, 95% CI 0.93–1.55; Table 2). Black patients were 48% less likely to receive induction and surgery than white patients (OR 0.52, 95% CI 0.29–0.93). Patients who were not married or had an unknown marital status were less likely to receive induction and surgery compared to married patients (OR 0.59, 95% CI 0.47–0.74). Increasing age was associated with decreased likelihood of induction and surgery; patients over 80 were 91% less likely to receive induction and surgery compared to patients aged 66–69 (OR 0.09, 95% CI 0.06–0.13).
Multivariable adjusted logistic regression for treatment with induction and surgery
| Characteristics | Odds ratio (95% confidence interval) |
|---|---|
| Histology | |
| Adenocarcinoma | 1.00 (Reference) |
| Squamous cell | 0.48 (0.35, 0.65) |
| AJCC Stage | |
| Stage II | 1.00 (Reference) |
| Stage III | 0.78 (0.64, 0.96) |
| Age at diagnosis (years) | |
| 66–69 | 1.00 (Reference) |
| 70–74 | 0.63 (0.49, 0.80) |
| 75–79 | 0.43 (0.33, 0.57) |
| 80+ | 0.09 (0.06, 0.13) |
| Sex | |
| Male | 1.00 (Reference) |
| Female | 0.84 (0.64, 1.11) |
| Race | |
| White | 1.00 (Reference) |
| Black | 0.52 (0.29, 0.93) |
| Other | 1.27 (0.76, 2.11) |
| Marital status | |
| Married | 1.00 (Reference) |
| Not married/Unknown | 0.59 (0.47, 0.74) |
| Charlson comorbidity index | |
| 0 | 1.00 (Reference) |
| 1 | 0.84 (0.66, 1.07) |
| 2+ | 0.51 (0.39, 0.67) |
| Tumor location | |
| Esophagus NOS | 1.00 (Reference) |
| Distal esophagus and gastroesophageal junction (GEJ) | 2.52 (1.57, 4.05) |
| Middle third/thoracic | 1.38 (0.80, 2.38) |
| Residence | |
| Metro | 1.00 (Reference) |
| Non-metro | 1.31 (0.99, 1.72) |
| Year with respect to NCCN Guideline publication | |
| Low SES (< 80% in census district) | |
| Pre-NCCN Guideline publication | 1.00 (Reference) |
| Post-NCCN Guideline publication | 1.78 (1.05, 3.03) |
| High SES (> = 80% in census district) | |
| Pre- NCCN Guideline publication | 1.00 (Reference) |
| Post- NCCN Guideline publication | 1.20 (0.93, 1.55) |
DISCUSSION
The use of induction and surgery, and especially neoadjuvant chemoradiation, has been demonstrated to improve survival in locoregional esophageal cancer. However, there remain significant socioeconomic disparities in treatment selection and outcomes in the United States.4 The basis of these inequalities is multifactorial and likely formulated by the complex relationship between the patient, provider and healthcare system.10 One possible explanation is that lower SES patients receive lower quality care; this may reflect decreased incidence of physician adherence to evidence-based processes and/or lack of resources in hospitals in less affluent areas.8,16,17
In this study, we analyzed the impact of incorporation of the results of the landmark CROSS trial into published national guidelines on treatment selection for patients with locally advanced esophageal cancer. To our knowledge, this is the first United States study to examine the impact of national guideline publication on esophageal cancer treatment selection. Utilizing the SEER-Medicare database, we demonstrated that patients living in lower SES areas were less likely to receive induction and surgery. Our results suggested that the 2011 NCCN guidelines had a remarkable impact on treatment choices. Although there were too few patients who received surgery alone to include in this analysis, following inclusion of the results of the CROSS trial into the guidelines there was a 78% increase in the likelihood of lower census level SES receiving treatment with induction and surgery than definitive chemoradiation. While the observed inequalities in cancer treatment are most troubling, these data suggest that improving dissemination of the latest research through guidelines may reduce differences in therapeutic decision-making and improve outcomes in currently undertreated populations.
Our study demonstrated a dramatic difference in treatment utilization between SES groups, as defined by education at the census level. Most of the current literature on inequalities in esophageal cancer treatment and outcomes in the United States has focused on race.3,5,17,18 Current 5-year OS for black patients is approximately half that of whites (11.7 vs. 22.3%).1 The underlying etiology is not clearly understood but likely results from a complicated interaction between patient and access related factors. Minority patients have been demonstrated to present with more advanced stage tumors due to delayed diagnosis.5,18 Additionally, minority patients are less likely to receive aggressive curative treatment, such as surgery, despite improved survival with surgical resection.6,19,20 Failure to undergo appropriate therapy may be associated with differences in quality of care as demonstrated by lower incidence of oncology and surgical referrals amongst minorities.3,10,17 Limited available studies have suggested similar findings in low SES patients.21,22 However, SES may be at least as important to the evaluation of barriers to care. Erhunmwunsee et al. recently demonstrated that when controlling for other prognostic factors, race did not significantly contribute to improved outcomes while SES (as measured by income and education) did; this suggests that observed racial discrepancies in esophageal cancer survival may actually reflect low SES.4
After publication of the NCCN guidelines, use of induction and surgery in low SES patients increased and became comparable to rates in high SES patients (from 21.4% to 37.5% in low SES and from 31.8% to 36.3% for high SES). While the reason for the subsequent change is unascertainable from an administrative database, a possible explanation may be due to an increased distribution and adaptation of evidence-based practices by institutions treating low SES patients. In a Dutch study from 2015, the authors observed that the use of induction and surgery by academic hospitals preceded nonacademic facilities by 1 year.11 It has been demonstrated that low SES patients with esophageal cancer are less likely to receive aggressive cancer treatment (i.e. surgery) and this is perhaps the reason that leads to worse outcomes; in fact, adjustment for the use of esophagectomy in this population has been shown to attenuate the observed worse survival.4,9,22 Similarly, increased postoperative mortality has been observed in low SES patients undergoing cancer surgery but the difference is lessened when hospital factors are taken into account.4,15 One possible contributing explanation for these observations is in the quality of institutions where patients receive care. We previously demonstrated that patient risk factors for receipt of low-quality esophageal cancer care included lower education level, non-white race, and older age.8 Furthermore, preferential referrals to low-volume hospital and low resource centers may result in inadequate tumor staging, operations by less experienced surgeons and reduced use of evidence-based adjunct therapies.23 Widespread availability of results of major clinical trials prior to formal incorporation into guidelines may encourage faster uptake of evidence-based therapies by institutions serving low SES patients.
SES may further impact treatment selection as a result of associated patient health and social factors. This study demonstrated that patients with increased comorbidities were less likely to receive surgical therapy. The relationship between presence of comorbidities and morbidity after esophagectomy has previously been described and may make physicians more reluctant to refer patients for surgery.24 Low SES patients diagnosed with cancer have an increased rate of comorbidities, which may also contribute to the observed worse postoperative outcomes in this population.25 More experienced centers may be better able to provide perioperative support for patients who are sicker at baseline; however, multimorbidity has been associated with reduced access to high volume centers for esophagectomy, which may perpetuate the difference in treatment selection.26 We demonstrated that unmarried patients/patients with unknown marital status were more likely to receive chemoradiation alone, consistent with previous reports of delayed diagnosis and undertreatment of esophageal cancer in this population.27 The absence of social support may influence patient decision-making in terms of reduced inclination to select more aggressive treatments. The etiology of this observation is multifactorial; while the high clinician suspicion is important, patient cultural attitudes about medical care may also contribute.5 Miscommunication between patients and providers may subsequently affect subsequent care decisions.27 While controlling for the above factors as well as age—which are known to influence therapy selection for esophageal cancer—we were still able to demonstrate a significant association between year of guideline publication and treatment of low SES patients.
This study has several limitations. First, we were only able to include patients than 66 and older in this analysis. The median age of esophageal cancer diagnosis is 67 years according to current SEER data and 59.8% of new cases diagnosed occur in patients older than 65, which supports the relevance of our current study population.1 Second, the SEER Medicare database may fail to capture all patient factors that may influence treatment selection. We had to make assumptions with respect to indication for treatment given the limitations of using administrative data. Third, the SEER-Medicare database is primarily composed of white patients. When compared to the entire population aged 65 and older in the United States, the distributions of age and sex of individuals within the SEER-Medicare database are similar age and sex however, the database captures a higher percentage of urban and affluent patients and a lower percentage of non-white individuals.28 This prevented us from evaluating racial differences with respect to publication of NCCN guidelines. However, observed racial differences in outcomes may in fact reflect socioeconomic factors.3,29 Additionally, we cannot exclude the impact of referral patterns on differences in treatment selection difference in treatment patterns is partially explained by referral patterns. However, it is unlikely that referral patterns changed substantially and differentially among high and low SES patients over the study period to entirely account for the observed effects. Lastly, the SEER database is limited in that it provides only census-level, rather than patient-level, education information. Education and income have both been used as surrogates for SES within the literature; a potential advantage of using education is that it is determined early in life, influences occupation and has thus been strongly associated with the subsequent onset of health problems.4,30 It is possible that we would have observed a larger effect size with respect to SES, except that the SEER-Medicare cohort includes only patients with Medicare.
In summary, our study showed that dissemination of the results of a landmark trial through incorporation into national guidelines may play an important role in current disparities in cancer care. Following the guideline publication, patients living in low SES areas were more likely to receive recommended treatment, with induction and surgery. These results suggest that guidelines may lead to increased equality in adherence to evidence-based standards.
ACKNOWLEDGMENTS
This study was supported, in part, by the National Institutes of Health/National Cancer Institute Cancer Support Grant P30 CA008748. Tamar Nobel is supported, in part, by a grant from the American Cancer Society.
Notes
Specific author contributions: Tamar Nobel, Arianna Barbetta, Anne Lidor, and Daniela Molena contributed to the conception and design of the work. Tamar Nobel, Arianna Barbetta, David Jones, Daniela Molena, Renee Gennarelli, and Jessica Lavery contributed to the interpretation of data. Renee Gennarelli and Jessica Lavery contributed to the analysis and interpretation of data. Tamar Nobel, Jessica Lavery, and Daniela Molena wrote the manuscript with critical revision from all other authors. All authors are in agreement to be accountable for ensuring the accuracy and integrity of the work.
References
ICD codes
| ICD-O-3 | |
|---|---|
| Esophageal cancer | |
| C15.0 | Cervical esophagus |
| C15.1 | Thoracic esophagus |
| C15.2 | Abdominal esophagus |
| C15.3 | Upper third of esophagus |
| C15.4 | Middle third of esophagus |
| C15.5 | Lower third of esophagus |
| C15.8 | Overlapping lesion of esophagus |
| C15.9 | Esophagus, NOS |
| C16.0 | Cardia, NOS |
| Surgery | |
| 42.33 | Endoscopic excision or destruction of lesion or tissue of esophagus |
| 42.32 | Local excision of other lesion or tissue of esophagus |
| 42.41 | Partial esophagectomy |
| 42.5 | Intrathoracic anastomosis of esophagus |
| 42.51–42.56 | Partial esophagectomy |
| 42.58 | Intrathoracic esophageal anastomosis with other interposition |
| 42.59 | Other intrathoracic anastomosis of esophagus |
| 42.42 | Total esophagectomy |
| 42.6 | Antesternal anastomosis of esophagus |
| 42.61–42.69 | Total esophagectomy |
| 42.40 | Esophagectomy, not otherwise specified |
| 42.1 | Esophagostomy |
| 42.10–42.12 | Esophagostomy, not otherwise specified |
| 42.19 | Other external fistulization of esophagus |
| 43.4 | Local excision or destruction of lesion or tissue of stomach |
| 43.41–43.42 | Endoscopic excision/destruction of gastric lesion |
| 43.49 | Other destruction of lesion or tissue of stomach |
| 43.5 | Partial gastrectomy with anastomosis to esophagus |
| 43.6 | Partial gastrectomy with anastomosis to duodenum |
| 43.7 | Partial gastrectomy with anastomosis to jejunum |
| 43.8 | Other partial gastrectomy |
| 43.81 | Partial gastrectomy with jejunal transposition |
| 43.89 | Open and other partial gastrectomy |
| 43.9 | Total Gastrectomy |
| 43.91 | Total gastrectomy with intestinal interposition |
| 43.99 | Other total gastrectomy |
| 44.3 | Gastroenterostomy without gastrectomy |
| 44.31 | High gastric bypass |
| 44.38 | Laparoscopic gastroenterostomy |
| 44.39 | Other gastroenterostomy |
Treatment groups
| Treatment groups | |
|---|---|
| Definitive chemoradiation | Chemotherapy within first 180 days after diagnosis |
| Radiation within first 365 days after diagnosis | |
| Induction and surgery | Chemo in first 180 days and/or radiation in first 180 days |
| Surgery in first 180 days |
| Treatment groups | |
|---|---|
| Definitive chemoradiation | Chemotherapy within first 180 days after diagnosis |
| Radiation within first 365 days after diagnosis | |
| Induction and surgery | Chemo in first 180 days and/or radiation in first 180 days |
| Surgery in first 180 days |
