


Abstract
Recent revolutionary advancements in sequencing technologies have made it possible to obtain mass quantities of genome-scale sequence data in a cost-effective manner and have drastically altered molecular biological studies. To utilize these sequence data, genome-wide association studies (GWASs) have become increasingly important. Hence, there is an urgent need to develop a visualization tool that enables efficient data retrieval, integration of GWAS results with diverse information and rapid public release of such large-scale genotypic and phenotypic data. We developed a web-based genome browser TASUKE+ (https://tasuke.dna.affrc.go.jp/), which is equipped with the following functions: (i) interactive GWAS results visualization with genome resequencing data and annotation information, (ii) PCR primer design, (iii) phylogenetic tree reconstruction and (iv) data sharing via the web. GWAS results can be displayed in parallel with polymorphism data, read depths and annotation information in an interactive and scalable manner. Users can design PCR primers for polymorphic sites of interest. In addition, a molecular phylogenetic tree of any region can be reconstructed so that the overall relationship among the examined genomes can be understood intuitively at a glance. All functions are implemented through user-friendly web-based interfaces so that researchers can easily share data with collaborators in remote places without extensive bioinformatics knowledge.
1. Introduction
The advent of high-throughput sequencing has accelerated large-scale data production, exemplified by the 1,000 human genomes project,1 the 1,001 Arabidopsis genomes project,2 the maize HapMap project3 and the recently completed 3,000 rice genomes project.4,5. Therefore, there is an urgent need to meet the demand for efficient visualization of genome-wide resequencing data and analytical results of such sequences. In particular, the results obtained from genome-wide association studies (GWASs) utilizing large-scale genome-wide polymorphism data and phenotypic traits have increased drastically in number and have contributed to understanding various biological phenomena. GWASs are recognized as a powerful method for identifying genes or genomic regions responsible for a trait of interest and are used widely in medical science to study the causative loci of cancer, diabetes, drug susceptibility, etc.6 GWAS is also utilized in other fields, including agronomy, allowing the causal genes of yield, disease tolerance, abiotic stress response and many other traits to be isolated.7–12
Since GWASs generally require a considerable number of genome-wide polymorphic sites obtained from more than one hundred samples, manual validation of the resultant data is quite laborious. Generally, the results from a GWAS are presented by a Manhattan plot, which is a static plot of association P-values against physical genomic positions. While this visualization method is simple and easy, it is not convenient for precisely exploring causal regions of phenotypic variation. Interpretation of GWAS results, such as summary statistics of P-values in combination with phenotypic data of individuals, variant frequencies, effects of variants, annotations of genes and linkage disequilibrium (LD) blocks, is necessary. To date, several computer programs that aim to prioritize single nucleotide polymorphisms (SNPs) and visualize GWAS results with gene annotation information and that are equipped with functions to investigate SNPs in an interactive, manipulatable manner have been developed.13–17 Since these programs depend heavily on information generated by an external variant caller, it is quite possible that large insertions and deletions (indels) and copy number variations (CNVs) that are frequently undetected by such callers are overlooked, although these variants are rather important candidate causal variants for phenotypes of interest.18 Therefore, a genome-scale viewer that displays large gaps beyond the extent of variant callers would be of great use.
Another issue is large-scale genomic data sharing with the public. Some valuable projects provide data sets of published GWASs as a catalogue of summary statistics, variant information and annotation information obtained from multiple sources for major model species such as humans,19 Arabidopsis20 and Asian rice.21 However, these platforms are specific to certain genomes, and published GWAS data for other species are not easily accessible and reusable. Thus, a platform for quick visualization and sharing of GWAS data that can be utilized easily for any genomic study is needed.
Here, we present TASUKE+, which simultaneously displays GWAS results and polymorphisms in hundreds of genomes in one window such that researchers can easily explore causal variants with phenotypic information, various types of annotation and phenotypic effects of genes. TASUKE+ shows either precise SNP/indel data with read depth information at the nucleotide level or a genomic overview of several megabases in one window. Therefore, users are able to perceive large structural variants missed by variant caller programs with depth information. TASUKE was originally developed as a program for visualizing and sharing data via the web so that users could share their own resequencing data with collaborators, the public or both immediately after publication of the paper through user-friendly interfaces.22 TASUKE has been adopted as a platform to display the genome resequencing data of several projects.23–25 Since the first release of TASUKE, a considerable number of improvements have been made (Supplementary Table S1). The current version of TASUKE+ is equipped with some new major functions, such as GWAS result visualization, data export, external links to other databases, molecular phylogenetic analysis and PCR primer design. In particular, the latter should be useful for experiments including replication analysis in GWASs. To illustrate a practical application of TASUKE+, a GWAS of 7 agronomical traits in 176 rice varieties26 are presented.
2. Materials and methods
2.1. Platform and data to be imported
A schematic view of the TASUKE+ system is shown in Fig. 1. The input files for TASUKE+ are those in commonly used formats, such as a FASTA file of the reference genome used for resequencing data mapping and variant calling, variant call format (VCF) files for each sample created by SAMtools27 or GATK28 and BAM files (optional) containing alignments of the reads. Annotation files in general feature format (GFF) and files related to GWASs, including results files in the qqman format29 (chromosome name, chromosome position and P-value) and phenotypic information for each sample, are also optional. TASUKE’s user interface was developed as a web application of HTML5. The web storage feature and the canvas element of HTML5 are used for rapidly displaying massive information from a large genomic region. A MySQL database is used for backend data management on a Linux server on which Apache and PHP can be run. One of the useful functions of data management is that a part of the database can be shared by a specific group. When users have two or more projects involving resequencing or a GWAS, they can put their data into a single MySQL database for TASUKE+, select a small part of the data and release this part independently of the rest of the data. Moreover, if users obtain new data, the data can be added to the existing database with the same procedure as that of brand-new system installation. The data to be displayed can be selected from both old and new data sets in a flexible manner by writing a configuration file. In addition, multiple TASUKE+ browsers depicting different data sets can be easily launched from a single backend database.

Schematic view of the TASUKE+ system. Data from genome resequencing (fasta, VCF and BAM files) and a GWAS (qqman format and phenotype data files) are added to a MySQL database with annotation information (GFF) on a backend Linux server running Apache and PHP programs. The server environments and default values for parameters of visualization can be specified in a configuration file (Conf). Genomic views and analytical functions are provided through general web browsers. The web storage feature and the canvas element of HTML5 are used for rapidly displaying massive information from a large genomic region.
To prepare a MySQL database and data files for TASUKE+, several Perl scripts are provided. For details, see https://tasuke.dna.affrc.go.jp/installation.html.
2.2. Reanalysis of rice GWAS data
The data obtained from the rice GWAS employing 176 temperate japonica varieties included single nucleotide variants and phenotypic data for 7 traits.26 The traits heading date, panicle length, awn length, plant height, panicle number per plant, leaf blade width and spikelet number per panicle were obtained from the same paper. We retrieved the resequencing data from the DNA Data Bank of Japan (DDBJ) Sequence Read Archive.30 The low-quality bases and adapter sequences in each read were removed by using Trimmomatic 0.36.31 The reads were mapped to the IRGSP-1.0 Nipponbare reference genome32 by BWA-mem (v0.7.15) with the default setting,33 and local realignment was conducted by using GATK 3.7.28 After removing PCR duplicates with Picard 2.9.0 (http://picard.sourceforge.net), the variants were called for each sample by using the GATK HaplotypeCaller and GenotypeGVCFs with the default setting. As a result, 822,655 SNPs were detected. The effect of each variant site was annotated by SnpEff.34 Rice genome annotation information from the RAP database (RAP-DB)23 and MSU release 732 was used for the SnpEff analysis, and this information was included in the annotation track of TASUKE+. For the GWAS, VCF files were converted to a PLINK format file by using PLINK v1.9.35 After removing sites with a minor allele frequency of <0.05, 406,224 SNPs were retained, and data imputation was conducted using Beagle version 3.3.2.36 Then, a GWAS was performed with the linear mixed model implemented in the Fast-LMM program.37 The resultant GWAS data set in the qqman format (chromosome name, chromosome position and P-value) and phenotypic data were added to the TASUKE+ database with the corresponding variant and mapping data. LD blocks were inferred for the aforementioned SNPs data set by using PLINK v1.9 with the following options: –blocks no-pheno-req no-small-max-span –no-pheno –no-parents –no-sex –nonfounders –no-fid –ld-window-kb 1,000. This data set is available at https://tasuke-plus.dna.affrc.go.jp/.
3. Results and discussion
3.1. Functions and application overview
TASUKE was designed to visualize large-scale genome resequencing data for hundreds of genomes.22 The new version, TASUKE+, shows both GWAS data and SNPs and indels called on a reference genome. The occurrence frequency of SNPs and indels at each genomic position as well as depth information are drawn on a scalable block with a nucleotide length of 1 bp to 100 kb with various information tracks for GWAS results, gene annotation and so on. For accessibility and easy sharing of extremely large data sets, TASUKE+ was developed as a web application implemented in HTML5. Researchers can share the data within a specific group or with the public via general web browsers so that end users, including non-bioinformaticians, can easily browse extremely large genome resequencing data sets without extensive bioinformatics knowledge. It is also possible to connect with other databases through the function of external link. TASUKE+ provides not only the visual data stored in the database but also data-analysis functions useful for users who would like to export nucleotide sequences, conduct a sequence homology search by BLAST, build a phylogenetic tree, design primers and so on. Detailed information of improvements and new functions that have been added since the first release of TASUKE22 is described in Supplementary Table S1. All these functions are implemented in a user-friendly web-based interface so that users’ operations will be made simpler (Fig. 2 and Supplementary Fig. S1).
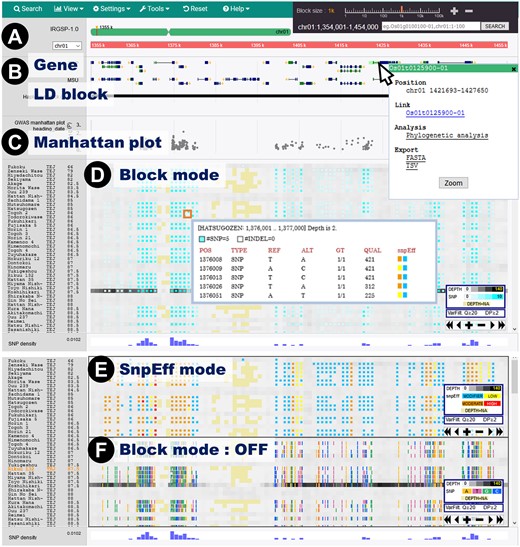
The main window of TASUKE+ showing GWAS and variant information for resequencing data obtained from 176 rice varieties. (A) Positions on the reference genome and annotation information are shown in the uppermost pane. (B) Annotation information tracks show features provided by a GFF format file (e.g. gene structures and LD blocks). By clicking on a gene, a pop-up window containing detailed information appears. (C) GWAS Manhattan plots are displayed below the annotation pane. (D)The variant frequency (blue) and read depth (grey) for each accession are shown with a colour gradient. Unmapped sites are coloured light yellow. Upon clicking on a block, detailed information for the variants pops up. (E) SnpEff mode shows the variant effect levels, namely, MODIFIER (sky blue), LOW (yellow), MODERATE (orange) and HIGH (red), inferred by SnpEff. (F) Variants can also be shown by their precise genomic positions with nucleotides coloured orange for A, pink for T, green for G and blue for C.
The reference genome and its annotation information are displayed at the top of the main panel (Fig. 2A). Users can select chromosomes and jump to a specific genomic position by clicking on a diagram of the chromosome or typing a position in a search window, which can also be used to search for identifiers such as gene name, gene ID, LD block and marker name described in the annotation of GFF files and displayed in annotation tracks (Fig. 2B). The summary statistics of GWASs are shown in the upper pane as a Manhattan plot illustrating the significance value (-log10(P)) of association for each polymorphic site and phenotypic value (Fig. 2C). The main panel shows nucleotide variations (SNPs and indels) for each resequenced sample by their name or identifier with user-supplied information such as sample group (population), origin, publication name and phenotypic value, and the information can be represented by different colours. SNPs and indels are displayed by occurrence frequency per block with the read depth shown in the background, and users can choose to show/hide each set of information. Optionally, nucleotide variations can be shown one by one at their precise genomic position by turning off the default ‘Block mode’. Furthermore, the phenotypic effect level of a variant inferred by SnpEff34 can be displayed (Fig. 2D–F). The variants and average read depth are shown with blocks scalable from 1 bp to 100 kb in length. Up to 200 blocks are displayed in a window; hence, a region of at most 20 Mb can be viewed at a glance. This block-style summarization of variants by occurrence frequency is quite efficient when users wish to compare genomes in a megabase-scale view. If the user zooms in on a selected region, the nucleotide sequence of a reference genome and its translated amino acid sequences can be shown at a 1-bp resolution. The mapped-read depth information is shown behind the nucleotide variation data in grayscale, and yellow is used to indicate the unmapped region (depth = 0). This depth information is important for distinguishing between no-variant regions and no-mapped-read regions. The regions with no mapped reads occur because of either low sequencing coverage or large deletions, which are often indistinguishable by ordinary variant callers designed for short-read data and hence generally omitted in VCF files. TASUKE+ can show large-scale structural variants described in input VCF files. A pop-up window describing read depth and detailed variant information (variant type, allele of the reference genome, alternative allele, genotype, quality provided by the variant caller and effect of variants) is shown by clicking on a block (Fig. 2D). The effects of variants such as nonsense mutations, frame shifts and nonsynonymous mutations, which can be added to VCF files by using SnpEff software,34 are displayed with different colour levels signifying MODIFIER, LOW, MODERATE and HIGH by selecting SnpEff mode from a pull-down menu (Fig. 2E). This information is of special importance when searching for candidates of causal mutations affecting phenotypes.
Furthermore, TASUKE+ has some functions for easily realizing bidirectional links from/to external databases, so that researchers can easily receive information from external databases (Supplementary Fig. S2). For example, a link to other websites can be created in a subwindow of annotation information that pops up upon clicking on a gene structure in an annotation track. This link can be defined for each annotation feature with prefix and suffix information described in a configure file. In addition, a specific genomic position or an identifier in an annotation track of the data in TASUKE+ can be written in the following format: https://tasuke-plus.dna.affrc.go.jp/? chr=chr07&st=5000001&en=6000000. In this way, any external databases can be linked to a specific region of TASUKE+ only by specifying a genomic position or a gene identifier. We expect TASUKE+ to be useful not only as an independent database but also as a database of other omics databases or as a part of an omics data network.
3.2. Visualization of GWAS results
TASUKE+ was developed to serve as a platform with which to simultaneously visualize GWAS results, sequence variations and annotations and to publish them in an effective manner via a web browser. Given GWAS data sets for multiple phenotypes in the input file format used in the qqman R package,29 TASUKE+ displays a Manhattan plot below the genome annotation area so that users can compare annotated gene information with probable candidate regions detected by a GWAS (Fig. 3). The main window of TASUKE+ shows genetic polymorphisms such as SNPs and indels in at most 20-Mb regions, together with possible phenotypic effects inferred by SnpEff so that variant effects such as frame shifts, non-sense mutations and splice site mutations are visible. The phenotypic values used for GWAS are displayed in the accession information pane, and the order of accessions is sortable by this information. This feature is helpful for interpreting GWAS results because one can observe patterns of genome-wide distributions of association signals, zoom in to local regions, and search for candidates of causal genes and variants by examining phenotypic effect levels as well as various types of annotation information. There are some web-based services for calculation of GWAS38–41 and, in particular, easyGWAS40 also has a function to display GWAS results. In this study, we aimed to provide a flexible visualization program that can show GWAS results in parallel with various mutation data on raw sequence data and their precise annotations. In addition, TASUKE+ can be installed on users’ own server and be modified by changing a configuration file to meet demands of a broad range of users. To assist the installation of TASUKE+, detailed information is available at https://tasuke.dna.affrc.go.jp/installation.html.
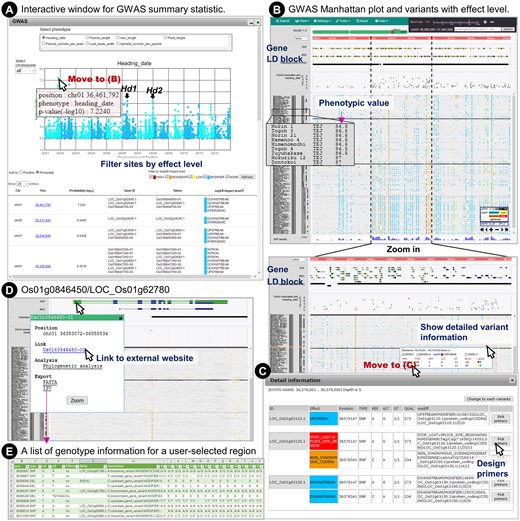
Exploration of GWAS data. (A) GWAS results are displayed in an interactive Manhattan plot, and a table of summary statistics and variant effects is displayed in a subwindow. (B) Upon clicking on a position in the plot or table, the main window of TASUKE+ moves to the corresponding position. The GWAS results, variants and annotation information can be viewed interactively. (C) Detailed information of variants and possible functional effects inferred by snpEff. Primers for selected sites or regions of interest can be designed quickly. (D) Gene structure of Os01g0846450/LOC_Os01g62780 and a sub-window for the gene information, external link, phylogenetic analysis and export functions. (E) Download list of genotypes and annotation information for a user-selected region.
To showcase the functionality of TASUKE+, we applied it to the reanalysis of GWAS data generated by Yano et al.,26 who conducted a GWAS for seven agronomic traits, including heading date, plant height, awn length and panicle number, with 176 temperate japonica rice varieties. We reanalysed the whole data set of raw reads and conducted a GWAS using a linear mixed model with 406,224 SNPs. The TASUKE+ database for these data was constructed with GWAS summary statistics of the seven traits, the variant and read depth, and the data were displayed on the rice reference genome IRGSP-1.0 with variant effect information and gene annotation from the Rice Annotation Project (RAP) and Rice Genome Annotation project of Michigan State University (MSU). This dataset is available at https://tasuke-plus.dna.affrc.go.jp/.
Figure 3 shows an example to explore GWAS data for heading date through TASUKE+ (for details of the GWAS data generation, see Supplementary Fig. S3). The Manhattan plots for all chromosomes and a table of polymorphic sites with GWAS summary statistics of P-values and variant effects for genes are shown interactively in a subwindow (Fig. 3A). Variant sites in the table can be filtered by effect level so that users can see a list of only variants having high impacts on gene functions. If one clicks on a specific SNP showing a strong association in the Manhattan plot or in the list of significant associations in the GWAS subwindow, the position of the SNP is immediately shown in the main window (Fig. 3B). After jumping to the candidate region of interest, users can examine nearby variants and check proximate genes and inferred LD blocks in annotation tracks by smoothly scaling and moving over genomics regions. Variants are coloured on the basis of the predicted functional effect levels so that candidates for functional polymorphisms associated with the phenotype of interest can be recognized. Users can also design appropriate primers for a specific region (Fig. 3C). Browsing the GWAS result and nucleotide variations with their functional effect levels enables users to quickly pick up candidate genes. Os01g0846450/LOC_Os01g62780, which was reported to be a new causal gene for heading date in Yano et al.,26 showed a strong association in our reanalysed result as shown in Fig. 3D. By clicking on the gene structure, a subwindow for the position, links to external database, phylogenetic analysis and data exports is displayed. A list of genotype information of a specified region or gene for all samples can be exported as a text file (Fig. 3E). In this way, exploring GWAS results in parallel with variant information and any kind of annotation information provided by GFF files will be of great use for researchers conducting a GWAS to identify candidate mutations, as recently noted in a rice GWAS report.26 Integration of these functionalities in TASUKE+ will provide researchers with an efficient computational environment to interpret GWAS results without referring to multiple data in separate programs and databases.
Once researchers find some polymorphisms of interest, PCR primers can be quickly designed in TASUKE+ by using Primer3.42 Users can select any region as a target to be amplified and design appropriate primers with various options. To take variant information into account, users can choose the ‘Variant masking’ option, which masks variable sites in the query sequence to avoid designing primers based on polymorphic sites. The uniqueness of the primers designed for the genome sequence can be checked by the BLAST function. An in silico PCR (also known as ePCR) function using MFEprimer43 to evaluate the PCR products amplified by the designed primer pairs is provided. In this way, PCR primers for SNPs and indels that can be used as DNA markers are easily designed in TASUKE+.
3.3. Phylogenetic tree reconstruction
Molecular phylogenetic tree construction was added as a novel function (Fig. 4). If users wish to investigate the relationships among genomes of interest, they can select the desired number of genomes stored in TASUKE+ and generate a phylogenetic tree. Users can restrict the regions to be used for the analysis by specifying a genomic position or gene identifier. The genetic distances are calculated by Kimura’s 2-parameter model44 implemented in DNADIST,45 and the phylogeny is reconstructed by using the neighbour-joining method46 implemented in NEIGHBOR of the PHYLIP package.45 We used treelib-js (https://github.com/rdmpage/treelib-js/) to draw the tree. The reconstructed phylogenetic tree can be previewed on TASUKE+ in three styles: rectangular, circular and linear (Fig. 4A), and the Newick tree format file, image file and fasta format alignment file of the corresponding region are downloadable so that users can visualize the tree with other viewer programs and conduct further molecular evolutionary analyses with their alignment data. Once a phylogeny is reconstructed in TASUKE+, the phylogenetic relationships of genomes can be reflected in the main variant pane by sorting accessions by order in the phylogenetic tree (Fig. 4B). These functions will help users understand how the samples are related at a glance.
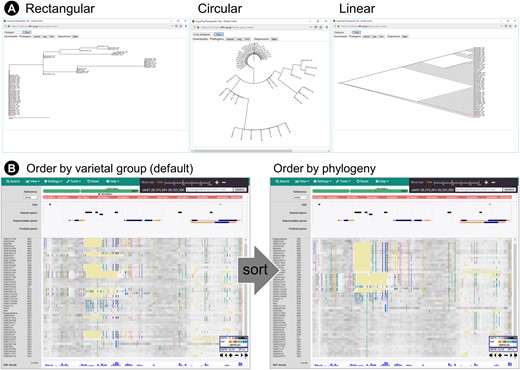
Phylogenetic tree reconstruction. (A) Trees of three styles are illustrated by treelib-js. (B) The order of accessions in the main window can be sorted by the order of names that appears in the inferred phylogeny.
4. Conclusion
To meet demands in the era of high-throughput sequencing and phenotyping, TASUKE+ has several useful functions such as visualization of GWAS results, phylogenetic tree reconstruction and PCR primer design. TASUKE+ enables users to efficiently integrate GWAS results with variant information including SNPs and indels as well as various annotations, such as genes, repeats and LD blocks. It is also possible to provide links to/from external databases so that users can smoothly move between databases. To showcase the usefulness of TASUKE+, we presented reanalysed GWAS data of 176 rice cultivars and seven traits. TASUKE+ will enhance processing of large-scale sequencing and phenotyping data and will also contribute to omics database networking.
Data availability
TASUKE+ is freely available at https://tasuke.dna.affrc.go.jp/.
Acknowledgements
The authors thank H. Sakai, H. Numa, B.A. Antonio, T. Hirozane-Kishikawa, X. Wang and E. Solovieva for their invaluable comments and suggestions for this study. This work was supported by grants (Development of Genome Information Database System for Innovation of Crop and Livestock Production; Genomics-based Technology for Agricultural Improvement, IVG-2001) from the Ministry of Agriculture, Forestry and Fisheries of Japan. M.K., T.T. and T.I. conceived the study. D.N., H.W., R.I. and N.T. designed and implemented the computer programs. M.K. and Y.K. conducted the analyses of resequencing data and the GWAS. M.K., T.T. and T.I. wrote the manuscript. All authors contributed to the research, reviewed the draft and approved the manuscript for publication.
Conflict of interest
None declared.
References
