


Pre-operative differentiation between pleomorphic adenoma (PA) and Warthin’s tumor (WT) of the major salivary glands is crucial for treatment decisions. The purpose of this study was to develop and validate a nomogram incorporating clinical, conventional ultrasound (CUS) and shear wave elastography (SWE) features to differentiate PA from WT.
A total of 113 patients with histological diagnosis of PA or WT of the major salivary glands treated at Fujian Medical University Union Hospital were enrolled in training cohort (n = 75; PA = 41, WT = 34) and validation cohort (n = 38; PA = 22, WT = 16). The least absolute shrinkage and selection operator (LASSO) regression algorithm was used for screening the most optimal clinical, CUS, and SWE features. Different models, including the nomogram model, clinic-CUS (Clin+CUS) and SWE model, were built using logistic regression. The performance levels of the models were evaluated and validated on the training and validation cohorts, and then compared among the three models.
The nomogram incorporating the clinical, CUS and SWE features showed favorable predictive value for differentiating PA from WT, with the area under the curves (AUCs) of 0.947 and 0.903 for the training cohort and validation cohort, respectively. Decision curve analysis showed that the nomogram model outperformed the Clin+CUS model and SWE model in terms of clinical usefulness.
The nomogram had good performance in distinguishing major salivary PA from WT and held potential for optimizing the clinical decision-making process.
Introduction
Salivary gland tumors comprise about 3% of all neoplasms of the head and neck region, and more than 80% of which are benign.1,2 Pleomorphic adenoma (PA) and Warthin’s tumor (WT) are the most common salivary gland tumors, which together account for more than 95% of benign salivary gland tumors.1 The biological behaviors of the two tumors are different, with the result that the treatment and prognosis also differ.3 PA is susceptible to relapse and has the potential for malignant transformation, and superficial or total sialoadenectomy is, therefore, recommended.3,4 However, malignant transformation and recurrence of WT seldom occurs, and enucleation is usually considered efficient.4 Therefore, the pre-operative discrimination of PA from WT is crucial for adequate surgical planning, especially for avoiding unnecessary surgeries and consequent complications.
Although fine needle aspiration cytology (FNAC) is considered as minimally invasive and safe method for the diagnosis of salivary gland lesions.5 However, the cytology diagnosis is not always conclusive due to limited specimen obtained and the great heterogeneity of salivary gland tumors.6,7 Therefore, pre-operative imaging plays an important role in surgical planning. Conventional ultrasound (CUS) is preferred as the first-line imaging modality for visualizing salivary gland tumors with convenience, cost-effectiveness and radiation-free safety.8,9 However, because of the substantial overlap in morphological features between PA and WT, differential diagnosis has not always been adequate.9
Shear wave elastography (SWE) can provide elastic information quantitatively and is a novel elastographic method associated mainly with ultrasound.10 SWE is not reliant on operator compression or another mechanical or physiologic source for stress generation and hence is potentially a more reproducible technique.10 So far, it is widely used and with promising results in the differential diagnosis of thyroid and breast nodules.11–13 We are aware of a series of recent studies that report the use of SWE in salivary gland lesions,14–16 and most of them indicated that SWE could help differentiate PA from WT.15,16 However, almost all of them exclusively focused on SWE and paid only little attention on how to combine it with other clinical and ultrasonic characteristics to further improve the differentiation performance. As a simple graphical representation of a statistical predictive model, nomogram uses biological and clinical variables to determine a model that generates a probability of a clinical event.17,18 It has been widely used in clinical studies.
In this current study, we aimed to establish aprediction nomogram incorporating clinical, CUS and SWE features for discriminating between PA and WT, and then to assess its validity.
Methods and materials
Patients
This retrospective study was conducted with the approval of the Institutional Review Board of Fujian Medical University Union Hospital. Due to its retrospective nature, the requirement for informed consent was waived by the committee.
We searched the electronic database of Fujian Medical University Union Hospital for patients diagnosed with PA and WT of the major salivary glands according to surgical and pathological records between January 2015 and August 2022. A total of 982 patients were included. The exclusion criteriawere as follows: (1) lack of CUS and SWE images; (2) recurrent tumors; (3) received treatment before surgery; (4) unsatisfied CUS and SWE image quality. Based on these criteria, we excluded 869 patients. We finally enrolled 66 patients with PA, including 32 males (mean age 43.15 ± 15.10 years; range 22–71 years) and 34 women (mean age 45.62 ± 15.24 years; range 21–76 years) and 47 patients with WT, including 37 men (mean age 57.27 ± 14.84 years;range 36–80 years) and 10 women (mean age 60.70 ± 14.86 years; range 43–70 years). The patient enrollment process for this study is shown in Figure 1.
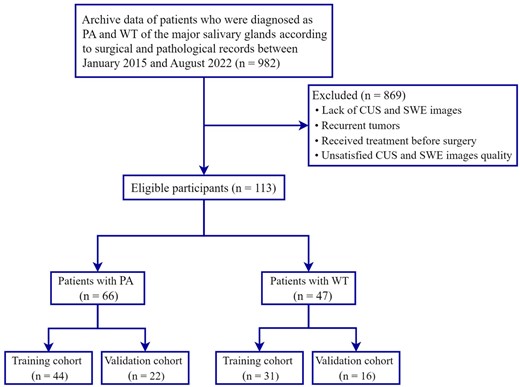
Flowchart illustrating the patient selection process. CUS, conventional ultrasound; PA, pleomorphic adenoma; SWE, shear wave elastography; WT, Warthin’s tumor.
In the next step, we categorized the 66 patients with PA and 47 patients with WT into 75 training cases (44 PA cases and 31 WT cases), who were admitted between January 2015 and January 2020, and 38 validation cases (22 PA cases and 16 WT cases), who were admitted between February 2020 and August 2022.
Utrasound and SWE evaluation
The ultrasound apparatus used was an Aixplorer ultrasound scanner (Supersonic Imagine; Aix-en-Provence, France) coupled with a 4–15 MHz linear transducer array. All ultrasound and SWE examinations were performed by a operator with approximately 25 years and 3 years previous experience in performing neck ultrasound and SWE, respectively. The patients were placed in a supine position with the neck sufficiently exposed and the head tilted to the opposite side to allow the scanning of multiple sections of the parotid and submandibular gland region. The ultrasound evaluations of the lesions included information on the size (the maximum length), border, shape, heterogeneity, calcification, presence of cystic areas, vascular distribution (central, vascular signals in tumor masses; peripheral, vascular signals along the periphery of the tumors; or mixed, presence of both peripheral and central flow),19 and internal vascularity (Grade 0, no visible tumor vessels; Grade 1, consistent detection of 1 or 2 separate vessels; Grade 2, consistent detection of 3–5 separate visible vessels; and Grade 3, > 5 separate visible vessels).20
After switching to the SWE imaging mode, the operator placed the transducer onto the skin surface with light contact using ample coupling gel, and kept the transducer stationary during acquisitions. Patients were asked to breathe normally, but refrain from other movements. For SWE window selection, an electronic box was positioned that enclosed as much of the lesion as possible and a small amount of adjacent normal salivary parenchyma. For lesions greater than 3 cm in depth, only the superficial portion of the lesion was assessed as no elasticity signal could be generated in the deeper component. On SWE elastograms, tissue elastic modulus was displayed in kilopascals (kPa) using a default chromatic scale with progression from blue to red indicating low to high shear modulus. The Q-Box of the region of interest (ROI) was placed in the whole lesion or the largest area that displayed elasticity colour signal. Additionally, in each patient, elastograms were also acquired from normal salivary parenchyma at the same depth as the lesion.
The following SWE quantitative and qualitative indicators were examined: Emax, Emean, and Emin referring to the maximum, average, and minimum elastic modulus of the whole lesion or the largest ROI in the area that displayed elasticity color signal, respectively. Eratio refers to the ratio of the average value of the elastic modulus of the area of interest of the tissue inside the lesion to the average value of the elastic modulus of the normal salivary parenchyma at the same depth. Esd is one standard deviation of the elastic modulus within the whole lesion and was used to assess the degree of lesion heterogeneity (Figure 2). Ehomo is the uniformity of the coverage of the shear wave in the internal tissues of the lesion and was classified as very homogeneous, reasonably homogeneous, and heterogeneous (Figure 3).
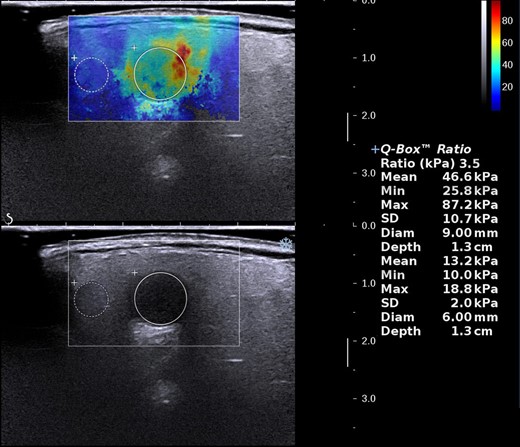
Measurement of SWE quantitative indicators. SWE, shear wave elastography.
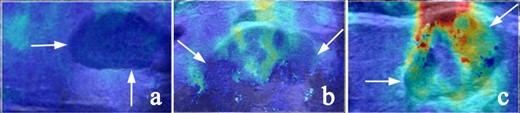
Representative SWE images of internal color homogeneity (Ehomo) of the lesions (white arrow). (a) Very homogeneous, (b) reasonably homogeneous, and (c) heterogeneous. SWE, shear wave elastography.
Two radiologists were blinded to the patients’ clinical data and analyzed the ultrasound and SWE images independently. If disagreement occurred, the two readers jointly reviewed the images and came to a consensus through discussion.
Statistical analysis
SPSS v. 22.0 (SPSS Inc., Chicago, IL) and R statistical software (v. 4.2.1; https://www.r-project.org) were used for statistical analysis. A two-sided p-value of <0.05 was considered significant. The χ2 test and Fisher’s exact test were used for qualitative data. The independent samples t-test (normal distribution) and Kruskal–Wallis H test (skewed distribution) were used for quantitative data.
The least absolute shrinkage and selection operator (LASSO) regression algorithm21 was used to screen the most effective clinical, CUS, and SWE features (with non-zero coefficients) for discriminating between PA and WT. A nomogram model incorporating clinical, CUS, and SWE features was constructed using multivariate logistic regression. Calibration curves were generated for both the training cohort and validation cohort, to graphically investigate the performance characteristics of the nomogram. In addition, the two models were aslo built using logistic regression according to the features selected by LASSO regression, including clinic-CUS (Clin+CUS) model and SWE model.
The area under the curve (AUC) of the receiver operating characteristics (ROC) curve was calculated for both the training cohort and validation cohort, to assess the discrimination performance of the three models. ROC curves were compared using the De-Long test. The sensitivity, specificity, accuracy, positive-predictive value (PPV), and negative-predictive value(NPV) of the three models were also calculated. The optimal cut-off value was determined by the Yoden index (Yoden index = sensitivity + specificity – 1). Decision curve analysis (DCA) was conducted to estimate the clinical utility of the three models by quantifying their net benefits at different threshold probabilities when applied to the training cohort and validationcohort.
The R packages used were: (1) the “glmnet” package for LASSO logistic regression, (2) the “rms” package for the nomogram and calibration curves, (3) the “pROC” package for the ROC curves, and (4) the “rmda” package to perform the DCA. All the packages can be downloaded at https://cran.r-project.org/web/packages/.
Results
Clinical, CUS and SWE characteristics
Table 1 summarizes the baseline information of all patients inthis study. Significant differences between the PA and WT groups were observed for sex, age, smoking, heterogeneity, cystic areas, vascularity, vascular distributions, Emax, Emean, Esd, Eratio, and Ehomo in both the training and validation cohorts. Significant differences between the PA and WT groups were also observed for location in the training cohort. No statistically significant differences were observed between the groups for other characteristics (p > 0.05).
Baseline characteristics of patients with PA and WT
| Characteristics | Training cohort | Validation cohort | ||||
|---|---|---|---|---|---|---|
| PA | WT | p- value | PA | WT | p- value | |
| n = 44 | n = 31 | n = 22 | n = 16 | |||
| Sex (M/F) | 21/23 | 24/7 | 0.010 | 11/11 | 13/3 | 0.049 |
| Age, years (mean ± SD) | 42.89 ± 12.58 | 58.16 ± 9.56 | <0.001 | 42.86 ± 18.43 | 57.69 ± 10.69 | <0.001 |
| Location (PG/SMG) | 34/10 | 30/1 | 0.022 | 14/8 | 15/1 | 0.052 |
| Smoking (yes/no) | 13/31 | 21/10 | 0.001 | 7/15 | 11/5 | 0.024 |
| Size, cm (mean ± SD) | 2.58 ± 1.02 | 2.75 ± 1.19 | 0.507 | 2.36 ± 0.99 | 2.79 ± 0.82 | 0.165 |
| Border (clear/unclear) | 41/3 | 28/3 | 0.687 | 20/2 | 14/2 | 0.735 |
| Shape (regular/irregular) | 30/14 | 22/9 | 0.797 | 10/12 | 12/4 | 0.069 |
| Heterogeneity (homogeneous/heterogeneous) | 30/14 | 11/20 | 0.005 | 16/6 | 6/10 | 0.030 |
| Cystic areas (yes/no) | 12/32 | 22/9 | <0.001 | 6/16 | 12/4 | 0.004 |
| Calcification (yes/no) | 2/42 | 2/29 | 1.000 | 3/19 | 0/16 | 0.249 |
| Vascularity (grade 0-1/2-3) | 22/22 | 7/24 | 0.016 | 10/12 | 3/13 | 0.026 |
| Vascular distributions (central/peripheral/mixed) | 14/25/5 | 21/7/3 | 0.006 | 7/12/3 | 13/3/0 | 0.008 |
| Emax, kPa (mean ± SD) | 80.24 ± 51.77 | 41.26 ± 18.39 | <0.001 | 119.61 ± 66.89 | 55.11 ± 23.77 | 0.001 |
| Emean, kPa (mean ± SD) | 52.21 ± 27.70 | 23.72 ± 15.79 | <0.001 | 69.04 ± 37.10 | 36.83 ± 18.53 | 0.003 |
| Emin, kPa (mean ± SD) | 8.01 ± 7.06 | 6.99 ± 9.56 | 0.599 | 16.64 ± 21.50 | 13.63 ± 11.62 | 0.615 |
| Esd, kPa (mean ± SD) | 19.48 ± 13.70 | 7.55 ± 4.68 | <0.001 | 25.57 ± 14.20 | 9.88 ± 6.38 | <0.001 |
| Eratio, (mean ± SD) | 3.87 ± 2.89 | 1.67 ± 1.14 | <0.001 | 4.98 ± 2.16 | 2.74 ± 1.64 | <0.001 |
| Ehomo (very or reasonably homogeneous/heterogeneous) | 10/34 | 23/8 | <0.001 | 6/16 | 12/4 | 0.004 |
Note: PA, pleomorphic adenoma; WT, Warthin’s tumor; M, male; F, female; PG, parotid gland; SMG, submandibular gland; Emax, maximumelastic modulus; Emean, averageelastic modulus; Emin, minimumelastic modulus; Esd, one standard deviation ofelastic modulus; Eratio, the ratio of elastic modulus; Ehomo, color homogeneity.
Development of the different prediction model
A total of 19 clinical, CUS and SWE features were analyzed. Five features (sex, age, cystic areas, Emean, and Ehomo) were obtained by LASSO regression analysis, with an optimal regulation weight λ of 0.089 and log (λ) of −2.414 under the 1-SE criterion (Figure 4). A nomogram of the prediction model incorporating the above five features was shown in Figure 5a. The calibration curves showed that the nomogram had good calibration in both the training and validation cohorts (Figure 5b and c). Besides, sex, age, and cystic areas were selected for the Clin+CUS model; Emean and Ehomo were selected for the SWE model. The results of multivariate regression analyses for different models were summarized in Table 2.
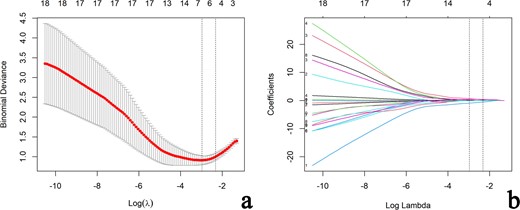
Selection of clinical, CUS and SWE features via the LASSO regression algorithm. (a) Tuning parameter (λ) selection in LASSO model used 10-fold cross-validation via 1-standard error criterion. The optimal values of the LASSO tuning parameter (λ) are indicated by the dotted vertical lines (the right one), and a value λ of 0.089 with log (λ) = −2.414 was chosen. (b) LASSO coefficient profiles of the 19 clinical, CUS and SWE features. A coefficient profile plot was generated versus the selected log (λ) value using 10-fold cross-validation. Five clinical, CUS and SWE features with non-zero coefficients were finally selected. CUS, conventional ultrasound; LASSO, least absolute shrinkage and selection operator; SWE, shear wave elastography.

Developed nomogram and calibration curves for the nomogram. (a) Sex, age, cystic areas, maximum elastic modulus (Emean) and color homogeneity of SWE (Ehomo) were used for building the nomogram model. Calibration curves for the nomogram model in the training (b)and validation (c) cohorts. Calibration curves indicate the goodness of fit of the nomogram. The 45° straight line represents the perfect match between the actual (y-axis) and nomogram-predicted (x-axis) probabilities. A closer distance between two curves indicates higher accuracy. PA, pleomorphic adenoma; SWE, shear wave elastography.
The multivariable logistic regression of the different models
| Variable | Coefficient | S.E. | Wald | OR (95% CI) | p-value |
|---|---|---|---|---|---|
| Nomogram model | |||||
| (Intercept) | 4.383 | 2.176 | 2.01 | 80.05 (1.64–11134.55) | 0.044 |
| Age | −0.122 | 0.042 | −2.93 | 0.89 (0.80–0.95) | 0.003 |
| Sex | 1.846 | 0.874 | 2.11 | 6.33 (1.26–41.84) | 0.035 |
| Cystic areas | −1.988 | 0.827 | −2.40 | 0.14 (0.02–0.64) | 0.016 |
| Emean | 0.068 | 0.030 | 2.28 | 1.07 (1.02–1.45) | 0.023 |
| Ehomo | 0.623 | 0.940 | 0.66 | 1.86 (0.29–12.39) | 0.507 |
| Clin + CUS model | |||||
| (Intercept) | 7.010 | 1.773 | 15.63 | 1107.48(51.87–62012.77) | <0.001 |
| Age | −0.124 | 0.032 | 14.51 | 0.88 (0.83–0.94) | <0.001 |
| Sex | 1.846 | 0.748 | 6.09 | 6.34 (1.46–27.46) | 0.014 |
| Cystic areas | −1.956 | 0.680 | 8.26 | 0.14 (0.04–0.54) | 0.004 |
| SWE model | |||||
| (Intercept) | −2.255 | 0.697 | 10.45 | 0.11 (0.02–0.36) | 0.001 |
| Emean | 0.064 | 0.025 | 6.41 | 1.07 (1.02–1.12) | 0.011 |
| Ehomo | 0.820 | 0.700 | 1.38 | 2.27 (0.58–8.95) | 0.241 |
The nomogram predicted model = 4.383 – 0.122 × age + 1.846 × (sex) – 1.988 × (cystic areas) + 0.068 × Emean + 0.623 × (Ehomo); the Clin + CUS predicted model = 7.010 – 0.124 × age + 1.846 × (sex) – 1.956 × (cystic areas); the SWE predicted model = -2.255 + 0.064 × Emean + 0.820 × (Ehomo). .
Note: Clin, clinical features; CUS, conventional ultrasound; SWE, shear wave elastography; S.E., standard error; OR, odds ratio; CI, confidence interval; Emean, average elastic modulus; Ehomo, color homogeneity
The discrimination performance of the different model
The discrimination performance of the different models is shown in Table 3. The ROC curves of each model for both training and validation cohorts are shown in Figure 6. For both training and validation cohorts, the nomogram model had better discrimination performance and a higher AUC than the Clin+CUS model (p = 0.025 in the training cohort; p = 0.049 in the validation cohort). The AUC of the nomogram model was higher than the SWE model in the training cohort (p = 0.047). However, no significant differences in the AUC values was found between the nomogram model and SWE model in the validation cohort (p = 0.109). In addition, the optimal cut-off value calculated according to the Yoden index (0.773) was 0.763, and the optimal cut-off value for the patient total score of the nomogram was determined to be 83 points. The cases diagnosed using the nomogram model are shown in Figure 7.
The performance of the different prediction model
| AUC (95%CI) | Sen (%) | Spe (%) | Acc (%) | PPV (%) | NPV (%) | |
|---|---|---|---|---|---|---|
| Training cohort (n = 75) | ||||||
| Nomogram model | 0.947 (0.903–0.992) | 77.27 (34/44) | 100 (31/31) | 86.67 (65/75) | 100 (34/34) | 75.61 (31/41) |
| Clin+CUS model | 0.897 (0.828–0.966) | 68.18 (30/44) | 96.77 (30/31) | 80 (60/75) | 96.77 (30/31) | 68.18 (30/44) |
| SWE model | 0.867 (0.781–0.952) | 77.27 (34/44) | 83.87 (26/31) | 80 (60/75) | 87.18 (34/39) | 72.22 (26/36) |
| Validation cohort (n = 38) | ||||||
| Nomogram model | 0.903 (0.799–1.000) | 86.36 (19/22) | 87.5 (14/16) | 86.84 (33/38) | 90.47 (19/21) | 82.35 (14/17) |
| Clin+CUS model | 0.773 (0.617–0.928) | 59.09 (13/22) | 100 (16/16) | 76.32 (29/38) | 100 (13/13) | 64 (16/25) |
| SWE model | 0.807 (0.665–0.948) | 86.36 (19/22) | 68.75 (11/16) | 78.94 (30/38) | 79.17 (19/24) | 78.57 (11/14) |
Note: Clin, clinical features; CUS, conventional ultrasound; SWE, shear wave elastography; AUC, area under receiver operating characteristics; CI, confidence interval; Sen, sensitivity; Spe, specificity; Acc, accuracy; PPV, positive- predictive value; NPV, negative-predictive value. Data in the parentheses are raw data.
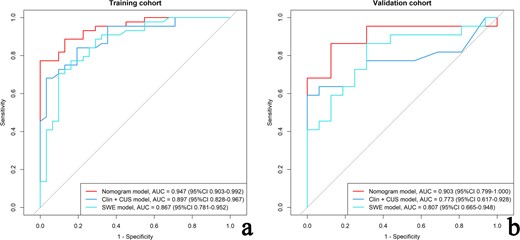
The ROCs of the nomogram model, clinic-CUS (Clin+CUS) model and SWE model in the training (a) and validation (b) cohorts, respectively. CUS, conventional ultrasound; ROC, receiver operating characteristic curve; SWE, shear wave elastography.
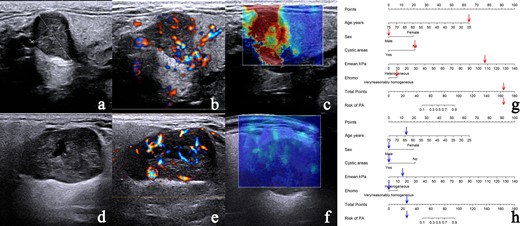
The nomogram accurately differentiates PA from WT. (a–c) Case 1: a 25-year-old male with pathologically confirmed PA. (a) CUS image shows a regular nodule with clear border and absent of cystic areas. (b) CDFI demonstrates Grade 3 vascularity with mixed vascular distribution could be seen in the nodule. (c) SWE image showing heterogeneous Ehomo with Emean of 107.5 kPa. (d–f) Case 2: a 64-year-old male with pathologically confirmed WT. (d) CUS image shows a regular nodule with clear border and cystic areas. (e) CDFI demonstrates Grade 3 vascularity with mixed vascular distribution could be seen in the nodule. (f) SWE image demonstrates very homogeneous Ehomo with Emean of 16.5 kPa. According to the nomogram model, the prediction probability of PA is greater than 90.00% (g) in Case 1 and less than 10.00% (h) in Case 2. CDFI, color Doppler flow imaging; CUS, conventional ultrasound; PA, pleomorphic adenoma; SWE, shear wave elastography; WT, Warthin’s tumor.
The DCA of the three models in the training cohort (Figure 8a) indicates that for the differentiation of PA from WT, the nomogram model had a higher overall net benefit than the other models across the majority of the range of reasonable threshold probabilities. Similar results could be found in the validation cohort (Figure 8b).
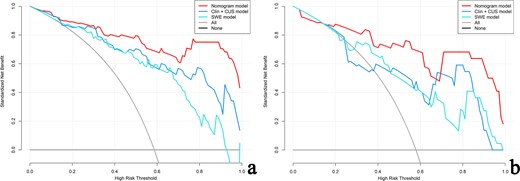
Decision curve for the nomogram model, clinic-CUS (Clin+CUS) model and SWE model in the training (a) and validation (b) cohorts, respectively. The gray line represents the assumption that all patients are PA cases; the black line refers to the assumption that all patients are WT cases. The x-axis denotes the high-risk threshold and the y-axis, the net benefit. The red, blue, and light blue lines represent the nomogram model, Clin+CUS model and SWE model, respectively. PA, pleomorphic adenoma; SWE, shear wave elastography; WT, Warthin’s tumor.
Discussion
The differentiation between PA and WT is necessary because of their different biological behaviors and treatments. In the current study, we developed a prediction nomogram based on clinical, CUS and SWE features for discriminating between PA and WT. To our knowledge, this is the first study to investigate the use of incorporating the clinical, CUS and SWE features to discriminate PA from WT. Our results show that this pre-operative prediction nomogram model had excellent performance for differentiating PA from WT in both the training and validation cohorts, with AUCs of 0.947 and 0.903, respectively. Furthermore, DCA showed that this nomogram was clinically useful.
Regarding epidemiology and clinical characteristics, most studies have reported PA to have a slight female predominance and they occur most often in the fourth and fifth decades of life.3,4,22 WT arise most often in males in the fifth and sixth decades of life.4,22 In the present study, the ratio of females:males was 1.1 (34/32) for the patients with PA, with an average age of 43.15 years; as for WT, the ratio of males: emales ratio was 3.7 (37/10), with an average age of 57.27 years. Previous studies have reported that smoking history are associated with WT. In our study, 32 of 47 WT (68.1%) had smoking history, which was similar to the results of previous studies.4,23,24
Previous studies have summarized the CUS characteristics indicating PA rather than WT.20,25,26 In general, CUS characteristics in PA are often irregular shaped, homogeneous, absence of cystic areas, poor or absent vascularity and with a peripheral vascular distribution.20,25,26 Our study confirmed these results except for the irregular shape, which might correlate with the uneven samples.In the present study, although PA were less vascularized than WT, but due to the appreciable intersection, color Doppler imaging provided only limited additional diagnostic information for distinguishing PA from WT. It can be challenging to distinguish between PA and WT on the basis of CUS, because the overlapping features of these two tumors, and there is no consensus to date to distinguish between the two.
SWE is a novel, non-invasive, objective elastographic method that offers the advantage of qualitative and quantitative measurements and lower operator-dependence, thus the assessment of lesion stiffness is more reliable.10,27 A meta-analysis28 had suggested that sonoelastography has a limited value for differential diagnosis between malignant and benign salivary gland lesions, with a pooled sensitivity of 67% and specificity of 64% . PA is the major cause of the problem. The stiffness of PA may be very high due to its myxochondroid component, overlapping that of malignant tumors.29 However, several previous studies have proven that SWE can be utilized to distinguish PA from WT.15,16 Fortunately, the recommended surgical therapy for PA and low grade malignant salivary tumors is the same.30 Therefore, it is crucial to distinguish PA from WT for the clinical management of salivary gland tumors. In the current study, PA showed significantly higher value of Emax, Emean, Esd, and Eratio, compared with those of WT. In addition, our results also showed that a heterogeneous Ehomo was statistically more frequent in PA than in WT (77.3% vs 25.8%, p < 0.001 in the training cohort; 72.7% vs 25%, p < 0.001 in the validation cohort). These SWE parameters differences are thought to result from the histologic differences between the two kinds of tumors.15,16 This finding may reflect the fact that the PA, as the term indicates, are composed of diverse histologic components.3 In contrast, WT consist of an epithelial and a lymphoid stroma.31 These histologic characteristics might present as a lower value of SWE quantitative parameters and relatively homogeneous Ehomo.
Although clinical, CUS and SWE features of salivary gland tumors could provide discrimination valuable. However, only the combination of these features can accurately assess the entire tumor and facilitate precision medicine. The nomogram is a graphical representation of a clinical prediction model that calculates a total score based on the values of individual predictor variables, and then predicts the risk of an event based on the total score.17,18,32 It is a novel prediction model that is gradually sought after by clinicians. In this study, a nomogram was constructed and validated for discriminating between PA and WT. The nomogram incorporates five factors, sex, age, cystic areas, Emean and Ehomo, exhibited the optimal discrimination performance among all predictive models.
Several limitations of this study should be noted. First, the retrospective design of this study with a relatively small sample size brings the potential for selection bias. Second, the patients were recruited from the same medical center, thus multicenter studies with much larger samples are needed to further external validate this nomogram. Third, all the SWE scans in this study were performed using the Aixplorer ltrasound system. Considering the variation in the elastic equipment, the nomogram might need some adjustments in the actual application. Fourth, although comparatively rare, malignant or other benign tumors of the salivary gland were not included in the study. Finally, while the nomogram could differentiate PA from WT with a reliable accuracy, the detailed level of the predicted probability applicable to the different clinical decisions still needs to be further investigated.
In conclusion, we developed and validated a nomogram incorporating clinical, CUS and SWE features. This nomogram is an effective tool to pre-operatively and non-invasively distinguish PA from WT and holds potential for optimizing the clinical decision-making process.
Open Access funding enabled and organized by Projekt DEAL.
We declare that all human have been approved by the Ethics Committee of Fujian Medical University Union Hospital and have therefore been performed in accordance with the ethical standards laid down in the 1964 Declaration of Helsinki and its later amendments. We declare that all patients gave informed consent prior to inclusion in this study.
†Huan-Zhong Su and Jia-Jia Yang contributed equally to this work.
Huan-Zhong Su contributed to acquisition, analysis, interpretation of data, drafting of the article, and review of submitted version of the manuscript and supervision. Jia-Jia Yang contributed to acquisition, analysis, interpretation of data, and review of submitted version of the manuscript and supervision. Zhi-Yong Li contributed to acquisition, analysis, and interpretation of data. Long-Cheng Hong contributed to acquisition and analysis of data. Wen-Jin Lin and Cong Chen contributed to analysis, interpretation of data. Jie Guo and Zhen-Yan Fang contributed to acquisition of data. En-Sheng Xue contributed to design of the study, acquisition, analysis, interpretation of data, drafting of the article, and review of submitted version of the manuscript and supervision.
REFERENCES
