


Abstract
Acoustic communication signals are important for species recognition and mate attraction across numerous taxa. For instance, most of the thousands of species of frogs have a species-specific advertisement call that females use to localize and discriminate among potential mates. Thus, the acoustic structure of the advertisement call is critical for reproductive success. The acoustic structure of calls will generally diverge over evolutionary time and can be influenced by the calls of sympatric species. While many studies have shown the influence of geography on contemporary call variation in populations of frogs, no study has compared the acoustic structure of frog calls across many species to ask whether we can detect an influence of divergence time and overall geographic overlap on the differences in acoustic structure of species-typical calls that we observe now. To this end, we compared acoustic features of the calls of 225 species of frogs within 4 families. Furthermore, we used a behavioral assay from 1 species of frog to determine which acoustic features to prioritize in our large-scale analyses. We found evidence that both phylogeny (time) and geography (place) relate to advertisement call acoustics albeit with large variation in these relationships across the 4 families in the analysis. Overall, these results suggest that, despite the many ecological and evolutionary forces that influence call structure, the broad forces of time and place can shape aspects of advertisement call acoustics.
Species-specific sexual advertisement sounds (hereafter: “advertisement calls”) are abundant in birds, frogs, and insects, as well as in some groups of fish and mammals (Gerhardt and Huber 2002; Bass et al. 2008; Bradbury and Vehrencamp 2011; Toledo et al. 2015b). These calls can promote conspecific mating and facilitate individual localization (Erulkar 1972; Gerhardt and Huber 2002; Gerhardt and Bee 2006). It is generally assumed that the acoustic structure of these species-specific calls will drift across evolutionary time (Gingras et al. 2013b; Arato and Fitch 2021). However, selection may also act on the acoustic structure of these calls to enhance salience for conspecifics, and reduce attractiveness to heterospecifics, the latter of which can serve to enhance prezygotic isolation between species (Erulkar 1972; Servedio and Noor 2003; Ortiz-Barrientos et al. 2009).
Selection that contributes to the acoustic distance between the calls of 2 species is dependent on the geographic overlap of the species (Pfennig and Pfennig 2009, 2010). Both the signaler and the receiver suffer costs associated with mistaking a heterospecific call for a conspecific call, including wasted energy, the loss of a reproductive opportunity, hybrid sterility, and increased predation risk (Blair 1958, 1974; Sasa et al. 1998; Gerhardt and Huber 2002; Wells 2007; Gröning and Hochkirch 2008). The perception and cognition of receivers will help drive the evolution of calls that are adequate to distinguish between species, with receivers often biased toward conspecific calls over heterospecific calls (Wilczynski and Capranica 1984; Gerhardt and Schwartz 2001; Wilczynski and Ryan 2010; Rosenthal and Ryan 2022).
Anurans (frogs and toads; “frogs,” hereafter) offer an excellent system to investigate how acoustic divergence of advertisement calls relates to phylogeny and geography (Köhler et al. 2017). Across thousands of species, males produce a species-specific advertisement call, and females are attracted to calls of conspecific males over heterospecific males (Gerhardt 1994; Gerhardt and Schwartz 2001; Gerhardt and Huber 2002). Many studies document geographic variation of advertisement calls within a species, and compare populations that are sympatric versus allopatric across a pair or handful of species (Blair 1958, 1974; Fouquette 1975; Loftus-Hills and Littlejohn 1992; Höbel and Gerhardt 2003; Hoskin et al. 2005; Lemmon 2009; Malone et al. 2014; Pfennig and Rice 2014). Often, these studies show that populations of sympatric frog species have calls that are more acoustically divergent than populations that are allopatric, although data are sometimes mixed (Toledo et al. 2015a; Perez et al. 2021). These results highlight that processes such as character displacement and reinforcement are likely involved in shaping the acoustic structure of frog advertisement calls generally (Gerhardt and Huber 2002; Rosenthal 2017).
Despite these many studies, we know relatively little about how broad forces of geographic overlap and divergence time can explain contemporary diversity of acoustic properties across anuran advertisement calls of many species. Here, we ask whether the presumed degree of historical range overlap and evolutionary divergence time explain some of the acoustic variation among frog advertisement calls using 4 families as independent analyses. Notably, we prioritize a measure of acoustic distance known to have behavioral relevance.
Materials and Methods
We aimed to test whether, at a broad, macroevolutionary level, 3 traits relate to each other: acoustic similarity, divergence time, and geographic overlap. Measuring each of these traits requires assumptions and caveats, which we outline in each section below. We highlight that our goal with this analysis is not to explain how these traits relate within small numbers of closely related species but rather to assess whether large-scale patterns are detectible when analyzing numerous species simultaneously.
Species selection and recording acquisition
We focused our analyses on 4 anuran families. Bufonidae, Hylidae, Leptodactylidae, and Ranidae are families that contain numerous species with wide geographic range and have phylogenetic and call data more readily available than other families (Gingras et al. 2013a, 2013b; AmphibiaWeb 2023). In addition, we were able to assess the behavioral relevance of our acoustic measurements in one species of leptodactylid (the túngara frog; see below). We included all species from these families with high-quality recordings available in The Macaulay Library, as well as a few additional species where we found call recordings from other sources (see Supplementary Material for complete recording list). Many of the frog recordings now stored by the Macaulay Library were originally part of the Texas Natural History Collections. In total, we were able to include 63 species from Bufonidae, 107 species from Hylidae, 34 species from Leptodactylidae, and 21 species from Ranidae.
For each recording, we identified one-second epochs of relatively clean sections of calling (minimal background noise and no overlap with other species) and created 1–3 snippets per recording file. For 19 species, we employed the noise reduction function in Audacity to obtain cleaner recordings. For each species, we found 1–4 files, leading to 1–12 clean, one-second snippets per species and a library of 1,224 files. Next, these snippets were manually annotated using amplitude-based segmentation to remove any epochs of silence greater than 5 ms. Many files consisted of only a single call, whereas others contained multiple calls. All calls were excised from their files, giving us a call library of 2,067 files (mean ± sd per species: 9.0 ± 7.7; Supplementary Figure S1).
Behavioral data
In order to determine which acoustic features to prioritize in our analyses of acoustic distance, we conducted phonotaxis experiments during the summer of 2022 with wild-caught female túngara frogs (Engystomops (=Physalaemus) pustulosus) from areas in and around Gamboa, Panamá. We used well-established methods to conduct recognition (one-choice) tests within a sound-attenuating chamber at the laboratories of the Smithsonian Tropical Research Institute (Ryan and Rand 1993; Ryan et al. 2003, 2019). Females were found in amplexus, tested in phonotaxis experiments, and returned to the site of capture within 24 h and toe-clipped to prevent retesting. To confirm phonotactic motivation, females were first tested with a standard 2-choice test with one speaker broadcasting a conspecific simple call (a “whine”) and a second speaker broadcasting a conspecific complex call (a “whine” followed by one “chuck”). Twenty females responded to a conspecific speaker and were subsequently tested on recognition tests for 10 heterospecific calls in succession (2 females did not respond to either conspecific speaker and were not tested further). The order of stimuli was randomized across individuals, and we tested each individual on all 10 calls to account for individual differences in receptivity.
We selected 9 of the most closely related species to the túngara frog within the Engystomops and Physalaemus genera, as well as 1 species from the more distantly related Leptodactylus genus (E. petersi, E. pustulatus, E. coloradorum, P. biligonigerus, P. centralis, P. cuvieri, P. ephippifer, P. nattereri, P. riograndensis, L. pentadactylus;Figure 1A). We randomly selected one call per species from our call library (described above). In these experiments, we asked if females would recognize one of the heterospecific calls as indicating an appropriate mate. In each test, one speaker broadcasted the heterospecific call, while the other broadcasted a white noise “dummy” call, with the same amplitude envelope as a conspecific call, as a control. A failure to respond to the heterospecific call or a choice for the dummy call was considered a rejection of the heterospecific call. The order of trials and side of each speaker (whether the heterospecific call was on the left or the right) were randomized.
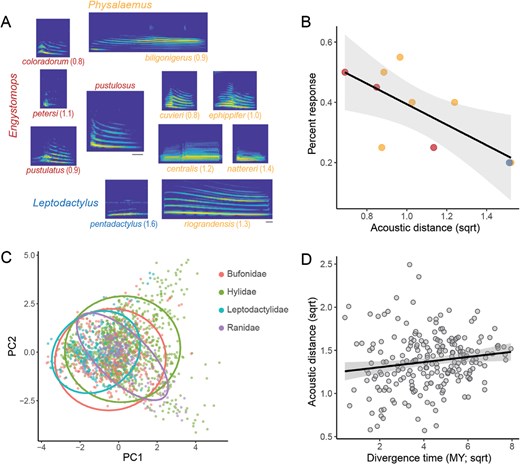
Behavioral results and acoustic similarity. (A) Call stimuli used in the behavioral validation using the túngara frog (E. pustulosus). The center depicts an example E. pustulosus call, with the heterospecific exemplars surrounding. For all spectrograms, the y axis ranges from 0 to 8 kHz. The gray bar underneath P. riograndensis spans 50 ms for the 10 heterospecific calls, and the gray bar underneath the center spectrogram spans 50 ms for the E. pustulosus call. Numbers indicate the acoustic distance from the túngara frog to each of the heterospecific calls (based on the PCA depicted in (C)). (B) The correlations between the proportion of females expressing positive phonotaxis toward each of the exemplar heterospecific calls and the acoustic distance. The color of each dot indicates the genus (as depicted in (A)). (C) PCA results for all calls in the dataset using the behavior-based set of acoustic features. Colors and ellipses indicate each of the 4 families in the analysis. (D) The correlation between divergence time and acoustic differences (phylogenetically corrected data).
For all tests, the speakers alternated playbacks on a 2 s loop, a typical calling rate for a male túngara frog. Females were placed under a funnel in the “starting area” prior to playback, and the funnel was raised remotely 30 s after the start of the playback. Trials were monitored live through an infrared camera. A choice for a speaker was determined if the female approached within 10 cm of the speaker, but not if she only approached the speaker by following the wall of the chamber. A lack of response was determined if the female (1) climbed the wall, (2) did not leave the starting area within 5 min, (3) did not move for 2 min from outside the starting area, or (4) followed the wall for 2 min. All stimuli were normalized to their peak amplitudes, and the speakers were calibrated so the peak amplitude was 82 dB SPL (re. 20 μPa) in the center of the starting area.
All procedures were approved by the University of Texas at Austin (IACUC: AUP-2022-00012), STRI (ACUC: SI-21012), and the Ministry of the Environment of Panamá (MiAmbiente: SE/A-39-2020).
Trait 1: Divergence time
To understand the relationship between evolutionary and acoustic distance, we used the divergence time since the most recent common ancestor as our proxy for evolutionary distance. We used timetree.org to obtain phylogenetic trees for each family and estimate the time since each pair of species diverged in millions of years (Kumar et al. 2017). TimeTree is a continually updated public knowledge database that extracts estimated divergence times from other published works, and our trees were obtained in March 2023. We acknowledge that this relies on the assumption that divergence rates are relatively consistent across species in our dataset.
Trait 2: Acoustic similarity
There is no single standard to measure the acoustic similarity of 2 sounds (Odom et al. 2021); therefore, we took a two-pronged approach. A common protocol (hereafter, our “naïve” method) is to measure many different acoustic parameters and compare calls following dimensionality reduction (e.g., PCA; Odom et al. 2021). In line with this approach, we measured 15 acoustic features using the sound analysis package seewave in R (Sueur et al. 2008): mean of the frequency spectrum, standard deviation of the frequency spectrum, dominant frequency, difference in mean frequency from first to second half of the call, frequency slope (difference in frequency divided by duration), 25th and 75th frequency quartiles, inter-quartile range of the frequency spectrum, spectral skew, spectral flatness, Shannon entropy, amplitude modulation, silence to signal ratio, acoustic complexity, and crest factor (Köhler et al. 2017; Odom et al. 2021). We then conducted a principal components analysis for these features across all calls. The first three components explained 30.5%, 21.5%, and 13.3% of the total variation. Because a few of our recordings were obtained in mp3 (compressed) format and converted to wav for analysis (34 out of 2,067 calls), we ran analyses to confirm that these spectral properties are robust to this variation in format (see Supplementary Information).
For each pairwise comparison of species, we took the first 3 principal components for all calls from each species. We then calculated the 3-dimensional Euclidian distance between the medians of each of these components between the 2 species in each pair of species to obtain an overall acoustic distance between the 2 species in the pair. We conducted our analyses on a family-by-family basis (i.e., only compared species from the same family) to provide 4 phylogenetically independent datasets for comparison.
In addition to this naïve approach, we aimed to conduct analyses that incorporated behavioral responses to these stimuli. For this exploratory analysis, we focused on the responses of wild túngara frogs to heterospecific calls (see above). After gathering the acoustic features, we asked which of these acoustic features were best at predicting positive responses of females to heterospecific calls in a one-choice test. These experiments determine if the female would “mistakenly” recognize a heterospecific call as indicating an appropriate mate. We correlated the absolute differences of features between the exemplar calls that we presented to females and the túngara frog calls in the dataset and ranked the features by how well they predicted behavioral responses (i.e., the greater the acoustic difference, the fewer females responded). We removed spectral variables one-by-one, starting with the lowest ranked feature, until the acoustic similarity (as calculated using the same PCA analysis as described above) significantly correlated with the female response rates. This final PCA contained 7 acoustic features: frequency slope, 75th quartile of frequency, interquartile range of frequency, spectral flatness, acoustic complexity, signal to silence ratio, and crest factor. We refer to this as our “behavioral” analysis and prioritize this as our primary dataset in analysis.
Phonotaxis experiments have also been conducted previously in many species of frogs, including species in the 3 other families under investigation here (e.g., Hylidae: Gerhardt 1981; Gerhardt et al. 1996; Bush et al. 2002; Kime et al. 2004; Castellano and Rosso 2007; Oliva et al. 2018; Boyd and Gordon 2021; Bufonidae: Arak 1988; Wagner and Sullivan 1995; Castellano and Giacoma 1998; Yasumiba et al. 2015; Ranidae: Engeler and Reyer 2001; Roesli and Reyer 2000). However, these studies generally assess for variation in preference for specific features related to the species under investigation, rather than the exploratory approach we took to ask what general acoustic features might predict preference across a large range of stimulus types. These specific features can be impossible to extrapolate across a wide range of stimuli, such as inter-pulse interval in species that do not produce pulses. We note that features like frequency and complexity are often found to be important for female preference, which are captured by some of the acoustic features in our analysis (Gerhardt and Schwartz 2001).
Finally, we also calculated call similarity within a species. We only calculated pairwise similarity scores for calls that originated from separate recordings, which were always recorded in a different location and at a different time. We used these data to estimate call variation within and across species.
Trait 3: Geographic overlap
Species range maps were compared manually using sources such as AmphibiaWeb (AmphibiaWeb 2023) to assess for geographic overlap as detailed range maps (i.e., GIS polygons) were not available for all of the species included in this study. Following similar methods as Coyne and Orr (1989, 1997), we characterized species pairs as being either sympatric or allopatric based on whether the range maps had any area of overlap. For analyses, we employed phylogenetic correction by nested averaging (see below). Therefore, we note that most data in the analysis averages the geographic overlap data across many pairs of species producing a gradient measure between 0 (no species pairs overlap) and 1 (all species overlapped). We propose that this ratio of currently overlapping species provides a proxy measure for the likelihood that the overall group of frogs overlapped in geographic area in ancient history, and acknowledge this to be a major assumption for this measurement. For the purposes of visualization to identify whether patterns differed for relatively allopatric versus sympatric species, we binarized these graded values with any comparison having a geographic overlap ≥0.5 deemed sympatric.
In addition to this previously used measure of overlap, we employed a 6-point system to assess whether a slightly more granular measure of overlap could explain acoustic similarities. Specifically: 5 = the range of one or both species is completely or nearly subsumed by the other, 4 = approximately half of the range of one species is covered by the other, 3 = minimal overlap between the 2 species, 2 = no overlap between the 2 species, but both exist on the same continent, 1 = no overlap between the 2 species but both exist in the same longitudinal hemisphere (the Americas vs. all other), and 0 = the species exist in opposite longitudinal hemispheres. We report this analysis in the Supplementary Information.
Statistics and phylogenetic correction
To correct for the phylogenetic non-independence of our data, we employed a correction procedure identical to previous studies (Coyne and Orr 1989; Sasa et al. 1998; Moyle et al. 2004; Malone and Fontenot 2008; Matute and Cooper 2021). Specifically, we employed nested averaging across all internal phylogenic nodes, creating a dataset with phylogenetically independent comparisons. For nodes with more than 2 branches, the order of averaging was randomized.
Following phylogenetic correction, we ran simple linear models and analyses of variance on our dataset using R 4.0.0. The call similarity and divergence time data (in millions of years) were right skewed, thus, we square-root transformed these data to improve normality. Our dependent variable was acoustic distance for all models, and the independent variables included divergence time, geographic overlap, and family (as well as their interactions). We ran Type III ANOVAs on our linear models using the “car” package (Fox et al. 2013).
We also ran our primary analysis on the full, non-phylogenetically corrected dataset, utilizing permutation tests (Matute and Cooper 2021). Specifically, for each group of species with the same divergence time (i.e., all descendants from a single phylogenetic node), we randomly selected a single species pair to serve as the sole data point for that node (rather than averaging across all of those species, as done in our nested averaging method). We conducted this randomization 10,000 times, and for each permuted dataset we ran the same simple linear model described above (with 2 independent effects and their interaction). From these models, we saved the coefficients for the parameters of interest to determine what percent of models had the same direction of effect.
Results
Behavior
To determine acoustic features that are behaviorally relevant to a species of frog, we conducted phonotactic recognition tests (single choice) in female túngara frogs (n = 20 females, each tested on 10 heterospecific stimuli for 200 total trials; Figure 1A). Previous phonotaxis studies have confirmed that, when given the choice, female túngara frogs prefer conspecific over heterospecific calls, but can respond to the calls of some heterospecifics when there is no conspecific option (Ryan and Rand 1993; Ryan et al. 2003). We observed recognition rates between 20% and 55% (Figure 1B).
Based on the response rates, we identified 7 acoustic features that best predicted female responses to heterospecific calls (see “Methods” section), and conducted a principal components analysis limited to these features (across all species in the dataset; Figure 1C). Comparing the median 3-dimensional Euclidean distances between the túngara calls in the call library and each call stimulus used in the phonotaxis experiment confirmed that the acoustic distances and behavioral responses were significantly correlated (linear regression: F1,8 = 8.4, P = 0.0197; Figure 1B). We also conducted all analyses on a “naïve” dataset that included 15 features with similar results (see Supplementary Information).
Acoustic similarity
We obtained recordings from 225 species and manually segmented the files to produce a library containing 2,067 calls. For each pair of species, we conducted an acoustic similarity analysis for each pairwise combination of calls from both species in the pair. We limited our acoustic analyses within families to identify whether we observed consistent or different patterns within each group, producing 8,395 pairwise comparisons.
For each pair of calls, we calculated the 3-dimensional Euclidean distance between the median of the first 3 principal components of a principal components analysis across all calls (see above). As expected, we found that acoustic differences were smaller when comparing different individuals within a species compared to across species (ANOVA: F1,8532 = 125.9, P < 0.0001). We also found that divergence time positively predicted acoustic difference such that more closely related frog species also had more similar calls after phylogenetic correction (linear regression: F1,219 = 5.5, P = 0.0199; Figure 1D).
Geographic overlap
To determine if time and place relate to acoustic structure, we conducted a linear model with the interaction between geographic overlap and divergence time as predictors for acoustic distance, which revealed a non-significant trend for the interaction (ANOVA: F1,217 = 3.8, P = 0.0517; Figure 2A). We also continued to observe a significant main effect of divergence time (F1,217 = 8.4, P = 0.0041) and a non-significant trend for the main effect of geographic overlap (F1,217 = 3.0, P = 0.0866). Using permutation tests, we confirmed a consistent direction of effect for the interaction between divergence time and geographic overlap on acoustic distance (see “Methods” section; 95.4% with consistent direction). We also conducted an analysis using a more detailed measure of geographic overlap (see “Methods” section and Supplementary Information) with similar results, including the non-significant trend for an interaction between geographic overlap and divergence time on acoustic distance (F1,217 = 3.6, P = 0.0587). These results suggest that divergence time and geographic overlap, together, can provide predictive power into the call similarity among frogs.
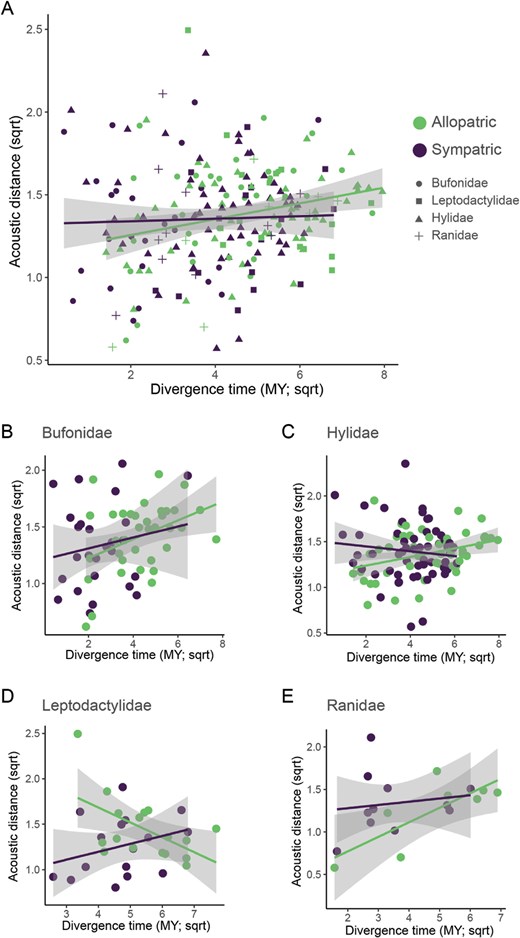
Acoustic distance varies with divergence time and geographic overlap. (A–E) Relationships between divergence time and acoustic distance, separated by geographic overlap. These data are phylogenetically corrected using nested averaging, with points represented by predominately allopatric species pairs in purple and sympatric species pairs in green (data are binarized for visualization from the nested average values). The pooled data (A) are then separated by family: Bufonidae (B), Hylidae (C), Leptodactylidae (D), and Ranidae (E), with trend lines depicting the results for more allopatric species (purple) separately from more sympatric species (green).
Our dataset contains independent comparisons from 4 families of frogs. We conducted a model asking whether the 3-way interaction between divergence time, geographic overlap, and family correlated with acoustic distance. We observed a significant 3-way interaction (ANOVA: F3,205 = 3.5, P = 0.0162) as well as significant pairwise interactions between divergence time and family (F1,205 = 5.7, P = 0.0009), geographic overlap and family (F3,205 = 5.3, P = 0.0015), and a positive main effect of divergence time (F1,205 = 5.6, P = 0.0186). Given this 3-way interaction, we conducted further analyses on a family-by-family basis.
For Bufonidae, we observed a significant and positive effect of divergence time on acoustic distance (ANOVA: F1,58 = 4.7, P = 0.0342; Figure 2B). For Hylidae, we observed a significant interaction between geographic overlap and divergence time on acoustic distance (F1,102 = 5.6, P = 0.0200; Figure 2C), as well as significant main effects for both features (geographic overlap: F1,102 = 6.1, P = 0.0153; divergence time: F1,102 = 5.9, P = 0.0171). For Leptodactylidae, we observed a significant interaction between geographic overlap and divergence time on acoustic distances (F1,29 = 6.7, P = 0.0149; Figure 2D) as well as significant main effects for both features (geographic overlap: F1,29 = 10.5, P = 0.0030; divergence time (negative): F1,29 = 6.7, P = 0.0096). For Ranidae, we observed a significant positive main effect of divergence time on acoustic distance (F1,16 = 7.0, P = 0.0173; Figure 2E). For the purposes of visualization, we binarized the geographic overlap data (values less than 0.5 deemed allopatric; see “Methods” section).
Discussion
In this study, we found that, broadly, both divergence time and geographic overlap relate to call similarity, using acoustic features shown to have behavioral relevance in wild túngara frogs. This suggests that the amount of geographic overlap among groups of species has affected call acoustic structure in behaviorally relevant directions across vast periods of time. In general, the interaction between geographic overlap and divergence time on acoustic differences appears to be driven by steeper slopes for species with greater geographic overlap, suggesting that factors other than drift are stronger in sympatric species (Figure 2). These results are consistent with the hypothesis that reproductive character displacement affects frog call acoustic structure, and that the acoustic structure of frog calls can contribute to prezygotic isolation (Blair 1958, 1974; Gerhardt and Huber 2002; Wells 2007).
We also found substantial variation in these patterns among the families we analyzed, consistent with previous studies documenting similar variation in call evolution (Cocroft and Ryan 1995; Gingras et al. 2013b). Moreover, we found that variation in how we measured some of our variables (geographic overlap and acoustic distance) also impacted some of the results (see Supplementary Information). Based on our main analysis, the results in Hylidae demonstrated similar results to the overall pattern, with a significant interaction between divergence time and geographic overlap on acoustic distance. In Bufonidae and Ranidae, we observed significant correlations between divergence time and acoustic distance. However, the results from Leptodactylidae were quite different from the other families. Counter to our expectations, the significant interaction between geographic overlap and divergence time on acoustic distance appeared to be driven by a negative relationship between acoustic distance and divergence time for more sympatric species, and this relationship was positive for more allopatric species. Notably, the behavioral measurements came from a species in this family, however, similar patterns are observed in the other 3 families when using a broader range of acoustic features to measure acoustic distance (see Supplementary Information). Further studies of reproductive character displacement among frogs in Leptodactylidae will be of particular interest to better understand these patterns.
The results here complement previous literature on reproductive character displacement and reinforcement in anuran calls (Blair 1958, 1974; Fouquette 1975; Loftus-Hills and Littlejohn 1992; Höbel and Gerhardt 2003; Hoskin et al. 2005; Lemmon 2009; Malone et al. 2014). While our data indicate that geographic overlap and divergence time can provide predictive insight into the acoustic divergence among frogs on a broad scale, the magnitudes of the effects we found were relatively small and explained little of the total variation in call properties, which is consistent with some studies that find relatively little effect of geographic overlap on call similarity (Toledo et al. 2015a; Perez et al. 2021). Thus, this work provides a foundation for future studies that incorporate more of the numerous factors that can simultaneously impact call structure for any given pair of species, such as habitat structure and differences in calling behavior (Kime et al. 2000; Oseen and Wassersug 2002; Mendoza-Henao et al. 2023; Nali et al. 2023). Finally, we also note that measuring variation in receiver biases and sensory cognition is of vital importance, and can vary just as much or more than the acoustic properties of the calls themselves (Márquez and Bosch 1997; Rosenthal and Ryan 2022).
While the costs of mistaking a heterospecific call for a conspecific call are numerous, there is also tremendous variability in these costs (Blair 1958, 1974; Sasa et al. 1998; Gerhardt and Huber 2002; Wells 2007; Gröning and Hochkirch 2008). In particular, the viability and sterility of hybrids varies across species pairs (Sasa et al. 1998). Hybridization is fairly common in many groups of species in the families studied here, with species boundaries still uncertain in some “species complexes” and quite complicated breeding patterns in hybridogenic groups (Roesli and Reyer 2000; Green and Parent 2003; Dufresnes and Mazepa 2020). Depending on the variation in cost or even adaptive potential of hybridization, receivers may use heterospecific advertisement calls to make mate choice decisions (Chen and Pfennig 2020). Overall, the behavior of receivers in relation to hybridization costs will likely impact the acoustic divergence of advertisement calls among species.
The increasing public availability of frog advertisement calls and phylogenetic information suggest that these communication systems are especially valuable for explorations of the importance of (phylogenetic) time and (geographic) place in the evolution of the fine details of acoustic structures. While our primary source of recordings was the Macaulay Library, other organizations such as Fonoteca Neotropical Jacques Vielliard and xeno-canto.org would be excellent sources of high-quality recordings for future work. Given the increasing rate of frog extinctions and the importance of vocal communication for reproductive success, understanding these fundamentals of acoustic divergence is of the utmost importance (Wake and Vredenburg 2008).
Supplementary Material
Supplementary material can be found at https://dbpia.nl.go.kr/cz.
Acknowledgements
We thank Marina Weikel Ramirez for their assistance in finding data sources. We thank Rachel Page, Gregg Cohen, and the staff of the Smithsonian Tropical Research Institute for crucial support in the fieldwork. We thank Panama’s Ministry of the Environment (MiAmbiente) and the Autoridad del Canal de Panamá (ACP) for permission to conduct this research. Many recordings were provided by The Macaulay Library at the Cornell Lab of Ornithology, and we are very grateful for this scientific resource. We are also grateful to all the recordists who have uploaded animal vocalizations, paving the way for cross-species comparisons. We thank three anonymous reviewers for their helpful comments.
Funding
The research was funded through a grant from the National Science Foundation (IOS-1914646) and the Smithsonian Institute Postdoctoral Fellowship program.
Conflict of Interest statement
None declared.
Authors’ Contributions
L.S.J. and M.J.R. conceived the idea, discussed all aspects of the study, and wrote the manuscript jointly. L.S.J. conducted behavioral experiments, conducted statistical analyses, and assembled figures. M.J.R. provided funding and supervision.
Data Availability
The data required to conduct the primary analyses in this manuscript are included as supplementary information.

