


Abstract
Scale remains a foundational concept in ecology. Spatial scale, for instance, has become a central consideration in the way we understand landscape ecology and animal space use. Meanwhile, scale-dependent social processes can range from fine-scale interactions to co-occurrence and overlapping home ranges. Furthermore, sociality can vary within and across seasons. Multilayer networks promise the explicit integration of the social, spatial, and temporal contexts. Given the complex interplay of sociality and animal space use in heterogeneous landscapes, there remains an important gap in our understanding of the influence of scale on animal social networks. Using an empirical case study, we discuss ways of considering social, spatial, and temporal scale in the context of multilayer caribou social networks. Effective integration of social and spatial processes, including biologically meaningful scales, within the context of animal social networks is an emerging area of research. We incorporate perspectives that link the social environment to spatial processes across scales in a multilayer context.
Our inferences regarding the processes underlying ecological patterns are directly linked to the scale at which they are observed (Levin 1992; Allen and Hoekstra 2015). Animals are influenced across scales by ecological processes such as resource availability, trophic interactions (Legendre 1993; Chave 2013), and global climate (Field et al. 2009). Multiscale ecology has been integrated into species distribution modeling (Elith and Leathwick 2009), habitat selection (Mayor et al. 2007), and food webs (Sugihara et al. 1989). We posit that it is important to consider the scale dependence of animal behavior within the social environment to effectively understand complex social systems (Whitehead 2008; Webber and Vander Wal 2018).
Social interactions exist across both temporal and spatial scales (Figure 1; Whitehead 2008). For example, conspecific grooming requires close spatial proximity and occurs over brief time periods (e.g., Carter et al. 2015), social associations represent shared space use by members of the same social group over relatively longer time periods (Franks et al. 2009), and home range overlap occurs over coarser spatial and temporal scales (e.g., Piza-Roca et al. 2018). Although the social environment scales spatially and temporally, it remains unclear whether coarser scales of social behavior, such as social association and home range overlap, vary predictably (Castles et al. 2014; Farine 2015; Evans and Morand-Ferron 2019). Thus, social scale is defined by the temporal and spatial scales across which different forms of sociality are measured (Farine 2015).
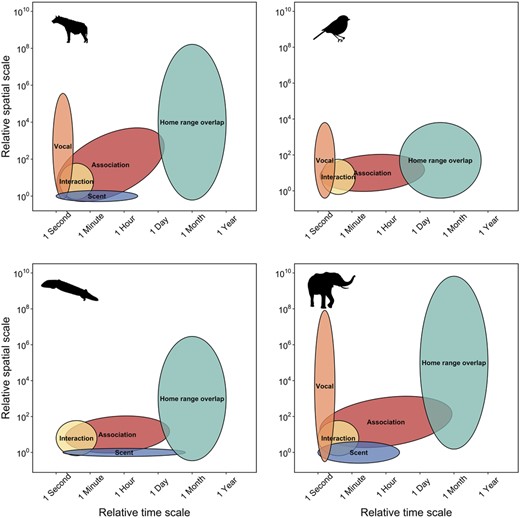
Space-time diagram representing variation the relative spatial and temporal extent required for different types of social and communication processes for 4 species, including spotted hyenas, passerine birds, sleepy lizards, and elephants. Spatial and temporal extent for social interactions, for example, mating, grooming, or aggression, are similar for most species because physical contact between 2 individuals is required for many social interactions. The logical extension is that spatial and temporal extent for social interaction is hierarchically nested within the spatial and temporal extent for social association because individuals must share space to interact. In contrast, different species have potential for greater spatial and temporal extents, for example, temporal extent for vocal communication is similar for most species because most vocal calls only persist in the environment for seconds, but spatial extent for vocal communication is highly variable with elephant calls extending the great distance and passerine calls extending the shortest distance.
Social network analysis is a well-developed tool used to measure the relationships of individuals and organization of social systems (Wey et al. 2008; Krause et al. 2009; Croft et al. 2011). It provides insight into the structure of social communities, which can influence population dynamics and evolutionary processes (Pinter-Wollman et al. 2013; Kurvers et al. 2014). Despite the widespread use and innovation of traditional social network analysis (Webber and Vander Wal 2019), it typically considers sociality in a singular context, drastically simplifying the complexity of animal social systems (Finn et al. 2019). Extending traditional monolayer social networks, multilayer networks explicitly consider social systems across scale-dependent contexts (Pilosof et al. 2017). Multilayer networks are composed of multiple layers, that can represent (1) different classes of individuals, for example, male or female, (2) types of behaviors, for example, grooming, traveling, or foraging, (3) spatial areas, for example, local or regional, (4) or temporal windows, for example, daily or seasonal (Kivela et al. 2014; Porter 2018). Multilayer networks are relatively novel to studies of animal behavior (Silk et al. 2018; Finn et al. 2019) and integrating scale within multilayer networks remains an unexplored opportunity to develop novel understanding of animal social systems.
We examined scale-dependent multilayer networks of behavioral, landscape, and spatial ecology and applied this framework to caribou, Rangifer tarandus. First, we test to what degree the social scale of relationships, spatial scale of landscapes, and temporal scale of analysis influences our ability to interpret complex social systems. Second, we address how variation in social, spatial, and temporal scales improves our understanding of the relationship between social association and seasonal resource availability. We conclude with potential future developments and applications of scale in multilayer networks.
Materials and Methods
Caribou socioecology
Caribou are gregarious ungulates with fission–fusion dynamics (Lesmerises et al. 2018) that display temporal and spatial variation in social networks (Peignier et al. 2019). Caribou dig holes, termed craters, in winter to access forage beneath the snow (Bergerud 1974). Cratering is presumed to be a costly behavior (Boertje 1985), and as a result, caribou tend to occupy and re-use craters once they are established. Importantly, craters exist on the landscape at multiple scales: the crater scale (a single crater), the feeding area scale (multiple craters in close proximity), and the winter range scale (all craters within an individual’s range) (Mayor et al. 2009). Access to forage is therefore heterogeneous in winter and depends on snow cover and distribution of craters on the landscape.
Caribou location data
We used global positioning system (GPS) location data collected from 21 adult female caribou on Fogo Island, Newfoundland, Canada between April 2017 and March 2019. Caribou were immobilized and fitted with GPS collars (Lotek Wireless Inc., Newmarket, ON, Canada, GPS4400M collars, 1,250 g) as described by Schaefer and Mahoney (2013). Collars were programmed to collect location fixes every 2 h. Prior to analyses, we subset GPS fixes to remove all erroneous and outlier GPS fixes following (Bjørneraas et al. 2010). We did not collar all caribou in the herd; however, the proportion of marked adult females was ∼10% of all adult females and ∼5% of all individuals in the herd. We assumed these individuals were randomly distributed throughout the population. Home range sizes for caribou on Fogo Island are on average 50.1 in winter and 17.5 in summer (Peignier et al. 2019).
Landscape data and habitat classification
Land cover data were provided by the Newfoundland and Labrador Wildlife Division (Integrated Informatics Inc. 2013). Available land cover classification included 9 habitat types at 30 m resolution. We reclassified the land cover types into 3 categories using the R package raster (Hijmans 2019): foraging, forest, and open habitats. Foraging habitat consisted of lichen, forest habitat consisted of coniferous forest, conifer scrub, broad leaf forest, and mixed-wood forest, whereas open habitat consisted of wetland, rocky barrens, and anthropogenic areas. Water was excluded from all subsequent analyses.
Caribou multilayer social networks
Network layer construction
We generated proximity-based social networks using the R package spatsoc (Robitaille et al. 2019) in R version 4.0.2 (R Core Team 2020). Typically for ungulates and other gregarious mammals, the “chain rule” is used for group assignment (Croft et al. 2008; Kasozi and Montgomery 2020). The chain rule is applied by assigning a group identifier to the union of buffered GPS fixes collected at each 2-h time step. As such, individuals in a group are within the social distance threshold of at least 1 other individual, though not necessarily all other individuals (Robitaille et al. 2019). Group assignment is defined using a temporal threshold of 5 min and a social distance threshold of 50 m (Lesmerises et al. 2018; Peignier et al. 2019). In all networks, individual caribou were represented as nodes and associations between individuals were represented as edges. We weighted edges by the strength of association between individuals using the simple ratio index (Cairns and Schwager 1987).
Network metrics
We used a series of metrics to characterize the multilayer networks, focusing on the role of individuals within layers and the similarity of edges across layers. Within each layer, we calculated degree centrality, the number of direct connections an individual has, and graph strength, the degree weighted by the strength of association. We calculated multidegree, the sum of degree centrality of individuals across layers, an extension of degree centrality to multiple layers (Berlingerio et al. 2012; Kivela et al. 2014). Finally, we measured the similarity of layers by calculating edge overlap. Edge overlap is defined as the proportion of edges present in each network layer out of all observed edges (Battiston et al. 2014). Network metrics were calculated using the R packages igraph (Csardi and Nepusz 2006), asnipe (Farine 2019), spatsoc (Robitaille et al. 2019), and data.table (Dowle and Srinivasan 2019).
Varying scale in multilayer networks
Social scale
We generated multilayer networks across a series of social distance thresholds for group assignment. Social distance thresholds (5, 25, 50, 75, 100, 250, and 500 m) represent a range of sensory modalities of caribou from visual to olfactory and auditory. Multilayer networks consisted of the social association between 21 individuals across 3 habitat layers (foraging, forest, and open) for the entire study period. At the finest scale, individuals within 5 m of one another were considered in the same group, whereas at the coarsest scale, individuals within 500 m of one another were considered in the same group. Increasing social distance threshold is a proxy for potential behavioral interactions that occur across these distances (e.g., grooming through vocal communication). For every social distance threshold, we calculated individual graph strength within habitat layers, and edge overlap and multidegree across habitat layers.
Spatial scale
To assess the influence of land cover spatial scale, we aggregated the land cover raster using the R package grainchanger (Graham 2019) across a series of scales (100–1,000 m by steps of 100 m) using a modal moving window method (Graham et al. 2019). We assume 30 and 100 m represents fine-scale decision making for caribou (Mayor et al. 2007), while 500–1,000 m represents the scale at which caribou tend to select and avoid habitat (Bastille-Rousseau et al. 2018). Multilayer networks consisted of the social associations between 21 individuals across 3 habitat layers (foraging, forest, and open) for the entire study period. For each land cover scale, we calculated individual graph strength within habitat layers, and edge overlap and multidegree across habitat layers.
Temporal scale
Time windows. We used a temporal multilayer network to assess the seasonality of caribou sociality. Multilayer networks consisted of the social associations between 21 individuals across 20 ordinal sample periods from the entire study period. For each time window, we calculated individual graph strength within time windows, edge overlap, and multidegree across time windows.
Number of observations. Studies of social network analysis vary in the number and frequency of observations as well as the data collection technique used to generate networks, ranging from directly observed to remotely sensed (Davis et al. 2018; Webber and Vander Wal 2019). Remotely sensed GPS data are commonly collected at a fixed rate, for example, every minutes or hours, continuously throughout the study period. Fix rate is a reflection of the number of observations an individual would have been observed and recorded in traditional ethological studies. To investigate the influence of number of observations, we generated multilayer networks of social association between 21 individuals across 3 habitat layers (foraging, forest, and open) using randomly selected observations. We first selected a maximum of 1,000 timesteps and iteratively used of these ( = 10–1,000 observations by steps of 10), to ensure previously included timesteps, and resulting associations, were accumulated with subsequent observations to mimic collection of observational data. Within each multilayer network with observations, we calculated individual graph strength and multidegree. We calculated edge overlap across the entire series of networks to determine proportion of total edges as number of observations increased.
Results
Individuals in multilayer networks became more connected as the social distance threshold increased. Mean graph strength was higher in foraging and open layers compared with forest layers (Figure 2). Individual graph strength increased when the social distance threshold increased from 5 and 100 m in all 3 habitat layers followed by a plateau in the rate of increase after 100 m (Figure 2). These results suggest the optimal social scale at which groups should be assigned is between ∼20 and 100 m based on the rate at which variance in graph strength decreased. GPS data allowed us to confirm the use of 50 m buffer (e.g., from this study and Peignier et al. 2019; Lesmerises et al. 2018) that has long been used for studies of ungulate social behavior in the field (Clutton-Brock et al. 1982; Lingle 2003; Kasozi and Montgomery 2020).
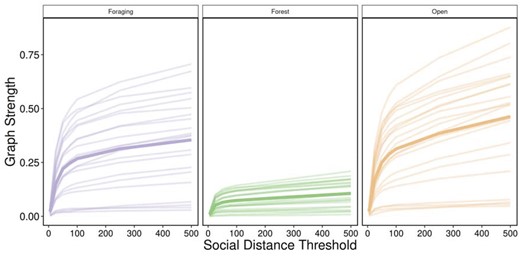
Varying scale in social distance threshold. For each social distance threshold (5, 25, 50, 75, 100, 250, 500 m), multilayer networks based on caribou social associations between April 2017 and March 2019 within 3 habitat layers (foraging, forest, and open). Each line represents a single individual and graph strength (mean of individuals in bold) showed a sharp increase between 5 and 100 m for all habitat classes. After 100 m, graph strength continued to increase at a slower rate. Foraging and open layers showed higher variation in graph strength between individuals although forest layers had less variation and lower mean graph strength.
Increasing land cover resolution resulted in decreased availability of foraging habitat and corresponding low connectivity of individuals in foraging layers at higher land cover resolutions. Edge overlap decreased sharply between 30 and 600 m in foraging layers, afterward remaining stable to 1,000 m (Figure 3D). In contrast, edge overlap was relatively consistent in forest and open layers as land cover resolution increased (Figure 3D). Graph strength was more variable within foraging habitat layers across land cover resolutions than open and forest habitat layers (Figure 3E). The proportion of relocations in forest (38.7% at 30 m to 50.3% at 1,000 m) and open (37.4% at 30 m to 48.2% at 1,000 m) habitats increased with increasing spatial resolution, whereas decreasing in foraging habitat (23.9% at 30 m to 1.6% at 1,000 m). These results highlight the importance of matching land cover resolution to scale of habitat selection and choosing a land cover product with a resolution sufficient to detect less common habitats.
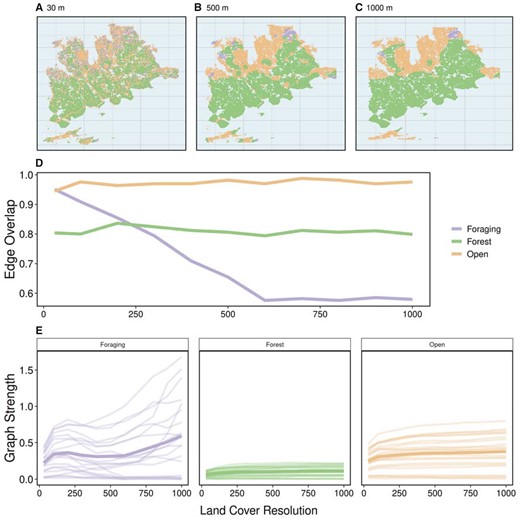
Varying spatial scale of land cover raster. For each land cover resolution (100–500 m by steps of 100 m), multilayer networks based on caribou social associations between April 2017 and March 2019 within 3 habitat layers (foraging, forest, and open). (A–C) 3 land cover rasters: the original resolution (30 m) and 2 aggregated rasters (500 and 1,000 m). (D) Edge overlap of habitat layers across spatial resolutions. Open and forest layers show consistent edge overlap with increasing spatial resolution although foraging shows a sharp decline in edge overlap between 30 and 600 m. Above 600 m, edge overlap in foraging layers is stable. (E) Graph strength within habitat layers across spatial resolutions showing individuals as a separate line and the mean of individuals in bold. Foraging layers showed high variation in graph strength with many individuals dropping to 0 after 500 m and others increasing with spatial resolution. Open layers and forest layers were relatively stable across spatial resolutions, with higher mean graph strength in open compared with forest layers.
The temporal multilayer network indicated within-year time windows where social network metrics increased. Edge overlap was higher in between approximately November and May (time windows 1, 6–11, and 15–20) than between approximately June and October (time windows 2–5 and 12–15 (Figure 4A)). Time windows of higher edge overlap also had higher graph strength compared with time windows of lower edge overlap, between approximately June and October (Figure 4C). Graph strength peaked across the time series throughout winter 2018 (January to April). These results highlight the importance of carefully selecting the temporal scale of analysis to effectively capture within- and across-year variation in sociality.
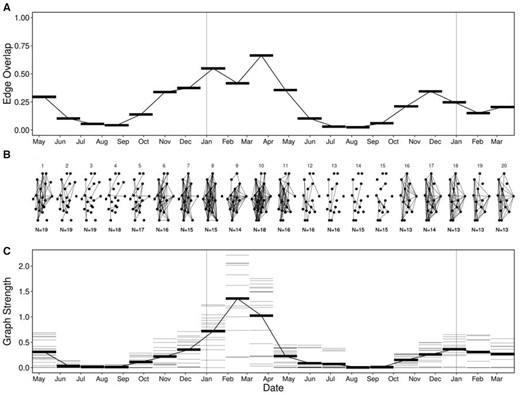
Varying temporal scale in multilayer networks. Multilayer networks based on caribou social associations within time windows (20 ordinal sample periods) between April 2017 and March 2019. (A) Edge overlap was high between approximately November and May (time windows 1, 6–11, and 15–20) and low between approximately June and October (time windows 2–5 and 12–15). (B) Ordinal network layers showing unweighted edges between individuals within time windows. Like edge overlap, individuals were more connected between November and May, compared with between June and October. (C) Graph strength within time windows showing individuals as thin gray lines and mean across individuals as thick black lines. Graph strength peaked in time window 9, with noticeable higher strength than the following year.
As the number of observations used to generate multilayer networks increased, individuals became more connected and variance in metrics decreased. Graph strength across individuals in all 3 habitat layers was highly variable at low number of observations and variance decreased after ∼100 observations (Figure 5A). Edge overlap increased across all 3 habitat layers with an increasing number of observations (Figure 5B). Similarly, multidegree for all individuals increased quickly between 10 and 100 observations and continued to increase until 1,000 observations (Figure 5C). Because the variance in these multilayer metrics decreases after a certain number of observations, this sensitivity method could be useful for determining the number of observations necessary for sufficiently describing social dynamics across contexts.
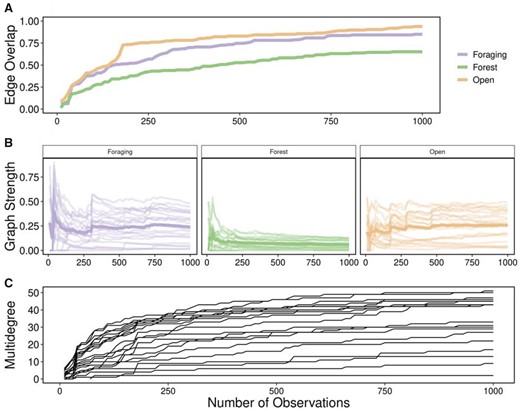
Varying scale in number of observations. Multilayer networks based on a subset of observations (10–1,000 observations by steps of 10) of caribou social associations between April 2017 and March 2019 within 3 habitat layers (foraging, forest, and open). (A) Edge overlap increased for all habitat layers with increasing number of observations. Foraging and open layers had higher edge overlap than forest layers. (B) Graph strength within habitat layers with increasing number of observations showing individuals as a separate line and the mean of individuals in bold. Graph strength was highly variable at low number of observations (<100) for all habitat layers and relatively stable after approximately 200 observations. (C) Multidegree for all individuals increased with increasing number of observations. Individuals showed high variability (2–51) at the maximal number of observations (1,000).
An illustrative multilayer network was generated, informed by previous social, spatial, and temporal scale results (Figure 6). Relocations were predominantly in open (37.4%) and forest (38.7%) habitats compared with foraging habitats (23.9%). Despite lower proportion of relocations in foraging habitat, individuals were more strongly connected in foraging and open habitats than in forest (mean graph strength in habitat layers [SD]; foraging: 0.21 [0.23], forest: 0.11 [0.13], open: 0.23 [0.24]). There was a seasonal difference in association with individuals more connected between approximately October to June (mean graph strength in time windows; 2: 0.37 [0.23], 4: 0.18 [0.11]) than between approximately June to October (mean graph strength in time windows; 1: 0.04 [0.04], 3: 0.03 [0.07]). The time windows were aggregated from the finer scale time windows presented above (time window 1: 2–5, time window 2: 6–11, time window 3: 12–15, time window 4: 16–20).
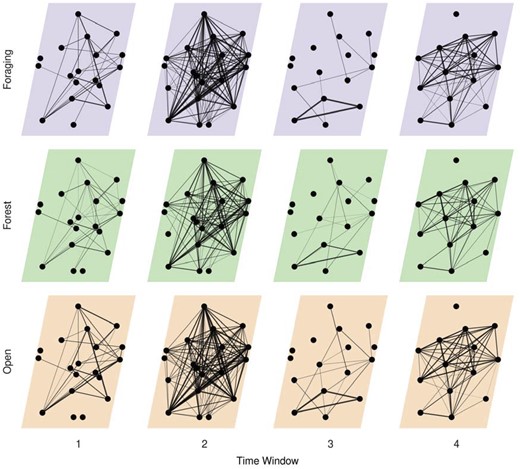
Multilayer network representing social association of caribou across 4 time windows (approximately June 2017 to October 2017, November 2017 to May 2018, June 2018 to October 2018, November 2017 to March 2019) and 3 habitat classes (foraging, forest, and open) informed by previous social, spatial, and temporal scale analyses. Individual caribou are represented as nodes in a constant position across network layers they were observed in. Intralayer edges represent association between individuals and line thickness is scaled by strength of association (simple ratio index).
Discussion
Animal social systems are characterized and influenced by scale (Figure 6). Three types of scale particularly relevant to animals are social, spatial, and temporal. Social scale defines the type and measurement of social relationships and directly impacts observed social connectivity between individuals. Spatial scale can reflect the resolution of the habitat within which social interactions occur. Finally, the temporal scale relates to both study design and seasonal differences in social processes. By partitioning social associations into discrete contexts using multilayer networks, we highlight the influence of social, spatial, and temporal scales on animal social systems, demonstrating the importance of considering biologically relevant and robust scales.
Social scale is an essential consideration for social network analysis (Castles et al. 2014; Carter et al. 2015; Farine 2015). For example, networks can be constructed based on fine-scale social interactions (e.g., grooming or aggression), social associations (e.g., group membership or proximity), or spatial or home range overlap. Here, we define social associations using a series of social distance thresholds to generate proximity-based social networks. Across habitat layers, increasing the social distance threshold resulted in an increase in graph strength (Figure 2). Specifically, open and foraging layers had higher graph strength as well as greater variation across individuals with larger social distance thresholds. Although our understanding of patterns of ungulate grouping across habitat types is relatively well-established (Lingle 2003; Kasozi and Montgomery 2020), the ability to generate habitat-specific social networks provides novel inference given the ability to estimate inter- and intra-layer metrics. Furthermore, generating socially variable layers within a multilayer framework emphasize that social scale directly influence multilayer network metrics. An extension of this analysis could incorporate behavioral states to explore the influence of social scale on patterns of association or interaction across habitat and behavioral layers, for example, using focal observations or hidden Markov Models (see Muller et al. 2018; Jones et al. 2020).
Habitat selection, the use of available resources or landscape features by animals (Manly et al. 1993; Boyce and McDonald 1999), is a scale-dependent process (Mayor et al. 2009) that we can observe in multilayer networks. Social structure and habitat selection are intimately related and individuals must share space to interact (Webber and Vander Wal 2018). We found edge overlap was stable in open and forest layers but decreased in foraging layers as spatial scale increased (Figure 3D). Graph strength had greater individual variation in open and foraging layers than in forest layers (Figure 3E). On average, graph strength was highest in foraging habitat, compared with forest and open habitat, despite the fact that foraging habitat was the least common. Furthermore, we observed a decrease in the proportion of relocations in foraging habitat with an increasing spatial resolution (23.9% at 30 m to 1.6% at 1,000 m). As the foraging layer had similar edge overlap and graph strength as the open layer at 30 m spatial resolution, spatial scale, therefore played a key role in our multilayer social networks. Johnson (1980) identified 4 orders, or scales, of habitat selection: (1) the geographical range of a species; (2) the home range of an individual; the (3) habitat patches within the home range; and (4) specific resources within a habitat patch. Scales of habitat selection could be relevant for multilayer networks and our integration of habitat within a multilayer context could be an important first step. Specifically, if individuals select habitats at the home range scale—for example, at coarser resolution, it may be relevant to assess social structure using home range overlap. In contrast, in cases where individuals select habitats at the patch-scale, fine-scale measures of sociality may be more relevant. Moving past this hierarchical perspective, Mayor et al. (2007) emphasized the importance of considering a broad continuum of scales to reveal scale-dependent selection and avoid the bias of predefined scales assumed to associate with certain behaviors. We highlight the concept of scale in multilayer networks should be approached based on explicit and precise definitions to ensure robust measurements.
The emergent relationship between habitat and sociality has been explored by the temporal distribution and phenology of resources and use of social information in multilayer networks (e.g., Evans et al. 2020). We observed seasonal variation in edge overlap. Specifically, we found increased edge overlap and graph strength in autumn, winter and spring than in summer (Figure 4A and C). These periods of increased sociality correspond to seasons of heterogeneous resource availability for caribou (Peignier et al. 2019). This analysis could be extended using time-aggregated networks and a moving-window approach for informing time window size and sampling effort (Farine 2017; Bonnell and Vilette 2020). By explicitly considering the temporal context of social interactions in separate layers, multilayer networks provide a detailed and dynamic perspective of animal social systems. For example, female mandrill (Mandrillus sphinx) sociality is more completely represented by temporal multilayer networks than aggregated networks (Pereira et al. 2020). Evans et al. (2020) observed seasonal differences in how the multilayer social structure of mice (Mus musculus domesticus) related to genetic structure. Finally, it is crucial to include sufficient data within sampling periods or time windows to construct robust networks (Proskurnikov and Tempo 2017; Farine 2017). With increasing number of observations, we found variance decreased in edge overlap and multidegree across habitat layers and in graph strength within habitat layers (Figure 5). As one might expect, dyads that only occasionally associated were more likely to be recorded with increasing number of observations, demonstrating the value of this form of sensitivity analysis to social networks in general and multilayer networks in particular.
Multilayer networks remain a nascent but powerful tool in animal behavioral ecology. Silk et al. (2018) summarized some key multilayer questions in animal behavior research and, based on our study of scale, we conclude by posing an additional set of questions centered on scale in behavioral, landscape, and spatial ecology:
how do multilayer social network metrics vary across social, spatial, and temporal scales, and at which scale might these influence fitness (Box 1)? Are some scales better predictors for different fitness components, for example, reproductive success or survival?;
why do individuals associate more strongly with certain conspecifics in some habitats? What is the role of movement in the context of habitat-specific social networks? and
how, and why, does the spatial scale of perception influence, for example, auditory, visual, or chemotaxis, influence the social environment? What is the role of memory, and by extension social and spatial cognition, as animals navigate their environment and make decisions about where to move next?
Phenotypes and Individual Fitness.
Social phenotype has been increasingly linked to individual fitness, including in primates (Brent et al. 2017; Thompson 2019), dolphins (Stanton et al. 2011; Stanton and Mann 2012), and birds (McDonald 2007; Royle et al. 2012). Social and temporal scales have emerged as important variables for understanding the fitness consequences of social network position (Holekamp et al. 2011; Berger et al. 2015; Almeling et al. 2016; Brent et al. 2017).
Varying social scales can have different fitness outcomes for individuals. Rhesus macaques (Macaca mulatta) had higher survivorship when they had fewer stable social associates and grooming partners compared with many weak social associates (Ellis et al. 2019). Typically individuals must be associating to interact, and many studies assume that proximity is proxy for interacting (Farine 2015). For instance, baboons (Papio spp.) must be within close proximity of each other for grooming yet, other forms of social interaction may occur over long-distances based on vocal or olfactory signals (Carter et al. 2015). It is possible to record social interactions that do not require proximity using, for example, microphone arrays to construct long-distance communication networks (Snijders and Naguib 2017).
Multilayer networks enable researchers to investigate similarities and differences in social processes between discrete temporal windows. Changing social phenotypes over ontogeny can affect fitness (Berger et al. 2015; Brent et al. 2017). Individuals progress through development at different rates (Tarka et al. 2018) and this variation can complicate the selection of time windows. Considering fine temporal scales provides insight across developmental stages that may otherwise be missed (Turner et al. 2020). It remains critical to carefully consider the effect of scale on the relationship between an individual’s social network position and fitness using a temporal scale based on the hypotheses being tested and logistical constraints.
Acknowledgments
We respectfully acknowledge the territory in which data were collected and analyzed as the ancestral homelands of the Beothuk and the Island of Newfoundland as the ancestral homelands of the Mi’kmaq and Beothuk. We thank members of the Newfoundland and Labrador Wildlife Division, including S. Moores, B. Adams, W. Barney, and J. Neville for facilitating animal captures and for logistical support in the field. We also thank all members of the Wildlife Evolutionary Ecology Lab, including J. Hendrix, K. Kingdon, S. Boyle, J. Balluffi-Fry, C. Prokopenko, I. Richmond, J. Hogg, and L. Newediuk for their comments on previous versions of this manuscript as well as D. C. Schneider for inspiration and helpful discussions about scale.
Funding
Funding for this study was provided by a Vanier Canada Graduate Scholarship to Q.M.R.W. (acronym of author Quinn M.R. Webber) and a Natural Sciences and Engineering Research Council of Canada Discovery Grant to E.V.W.
Code Availability
Code for performing all multilayer social network analyses and generating the figures is available at https://github.com/robitalec/scale-in-multilayer-networks (Robitaille et al. 2020) and released under the GNU General Public License version 3.0. We depend on numerous R packages notably for the analysis: igraph (Csardi and Nepusz 2006), data.table (Dowle and Srinivasan 2019), spatsoc (Robitaille et al. 2019), asnipe (Farine 2019), and grainchanger (Graham 2019), for the figures: ggplot2 (Wickham 2016) and patchwork (Pedersen 2019), and for reproducibility and workflow management: drake (Landau 2018), renv (Ushey 2020), and knitr (Xie 2015).
References
Integrated Informatics Inc.
R Core Team

