


Abstract
Better skills matching has long been proposed as one of the key advantages of agglomeration economies. Yet, support for this improved matching has remained largely founded upon indirect proxies for skills such as wages and education. This paper contributes to the literature by offering novel empirical evidence on the relationship between specific measures of localised skills deficiencies and agglomeration economies, in the form of industrial density. Developing an instrumental variable approach and controlling for unobserved heterogeneity and other region-industry idiosyncratic effects across a panel dataset for the period 2009–2019 in England and Wales, our analysis reveals a positive effect of agglomeration economies in reducing both skills gaps within the employed workforce and skills shortages in the labour market external to the firm. We consider these findings in the context of persistent regional imbalances and the importance of strengthening skills provision within current regional industrial strategies.
1. Introduction
Since the foundational insights by Alfred Marshall (1890, 1919) on the positive externalities that arise from the spatial co-location of companies, agglomeration economies have come to constitute a foundational concept across the literature. They underlie modern theories of industrial districts and clusters (Becattini, 1990; Porter, 1998), urban growth (Black and Henderson, 1999), new economic geography (Krugman, 1992), evolutionary economic geography (Boschma and Martin, 2010) as well as seminal contributions on the geography of innovation (Jaffe et al., 1993; Audretsch and Feldman, 2004). Accordingly, a substantial body of research has evidenced the advantages of agglomeration and density in regional economies for their critical role in fostering productivity, innovation and ultimately economic growth (Ciccone and Hall, 1996; Döring and Schnellenbach, 2006; Henderson, 2007; Moretti, 2021).
Scholars have sought to disentangle the interrelated mechanisms through which agglomeration effects may operate, as originally suggested by Marshall, defined by local supplier linkages, labour market pooling and localised knowledge spillovers (Duranton and Puga, 2004; Rosenthal and Strange, 2004). Several studies have provided consistent support for the relationship between intermediate input sharing and agglomeration, evidencing higher purchased-inputs intensity in concentrated industries and co-agglomeration of sectors tangled in input-output relationships (Holmes, 1999; Ellison et al., 2010; Cainelli and Iacobucci, 2012; Steijn et al., 2022). A large literature has investigated proximity effects in learning and knowledge diffusion for both innovation and entrepreneurship (Maskell and Malmberg, 1999; Acs et al., 2009; Caragliu and Nijkamp, 2016; Balland et al., 2022; Roper and Jibril, 2024) with knowledge spillovers similarly underpinning empirical studies on knowledge recombination and regional branching (Boschma et al., 2012). Linkages between labour pooling and agglomeration have also been explored using different approaches and data sources. Here, researchers have focused on identifying co-agglomeration patterns of industries that utilise similar labour or sectors exposed to higher volatility (Ellison et al., 2010; Overman and Puga, 2010). Other studies have looked at the role of density on workers’ wages (Andini et al., 2013; Andersson and Larsson, 2022), job search and labour mobility (Di Addario, 2011; Diodato and Weterings, 2015; Moretti and Yi, 2024). Another strand of research has explored matching efficiencies between workers and firms in more agglomerated areas looking at assortative matching based on firms’ and workers’ wage premia (Andersson et al., 2007; Melo and Graham, 2014; Dauth et al., 2022). Finally, researchers have used survey data to consider the role of labour pooling in improving job matches and reducing qualification mismatch (Andini et al., 2013; Berlingieri, 2019).
In this paper, we aim to contribute to the stream of research exploring localised labour pooling effects by focusing specifically on their role in improving skill matching as originally highlighted in the intuitions on agglomeration externalities by Marshall. Complementing previous works that utilise education or wage data as indirect proxies for skills (Berlingieri, 2019; Dauth et al., 2022; Leknes et al., 2022), this paper connects to the recent strand of research employing direct measures of skills for the analysis of productivity and labour market dynamics (L’Horty and Sari, 2019; Morris et al., 2020). In particular, we ask whether industrial density can support better skill matching and reduce skills deficiencies, reflected by both skills gaps in existing staff as well as perceived skills shortages in the external labour market. Addressing these questions will further improve our understanding of Marshallian externalities, with important implications for current policy debates on the uneven distribution of skills and broader regional imbalances that characterise most advanced economies (Bailey et al., 2018; OECD, 2019; Corradini et al., 2023).
We analyse these relationships by merging information from the Employers Skills Survey (ESS) and the Business Structure Database (BSD) to construct a longitudinal dataset for 15 broad industrial sectors and NUTS2 (Nomenclature of Territorial Units for Statistics 2) region pairs in England and Wales across the period 2009–2019. Controlling for unobserved heterogeneity and other region-industry idiosyncratic effects, we provide novel empirical evidence on the effects of thick labour markets on skills matching, specifically addressing skills deficiencies in the form of both skills gaps within the employed workforce and skills shortages in the labour market external to the firm. We further support our findings by applying a Bartik-type shift-share instrumental variable approach (Bartik, 1991; Goldsmith-Pinkham et al., 2020) to account for potential reverse causality and omitted variable bias due to spatial sorting of skilled workers into agglomerated locations (Combes et al., 2008; Berlingieri, 2019).
Our findings show that Marshallian agglomeration economies are particularly important in addressing skills mismatches. We estimate that a 1% increase in industrial density in a region-industry would reduce skills shortage vacancies by 2.9%, and internal skills gaps by approximately 2.6%. These effects are more pronounced in manufacturing sectors and the most productive industries and regions. These results provide robust evidence to support the Marshallian hypothesis that agglomeration economies in the form of thick labour markets play a positive role in providing a constant market for skills, reducing both skills gaps within the employed workforce as well as skills shortage vacancies in the regional labour market external to the firm. We conclude considering these findings in the context of persistent regional imbalances (OECD, 2016; Iammarino et al., 2019; Camagni et al., 2020) and the importance of strengthening skills provision in recent calls for a renewal of regional industrial strategies (HM Government, 2017; Bailey et al., 2019, 2023; Corradini et al., 2023).
2. Literature review
The literature on the relationship between agglomeration economies and the advantages of thick labour markets stems from the seminal observation by Marshall that ‘a localized industry gains a great advantage from the fact that it offers a constant market for skill’ (Marshall, 1890, p. 271). Building on Marshall’s insights, theoretical work on the micro-foundations of externalities arising from localised labour market interactions has been developed along two related perspectives (Duranton and Puga, 2004; Puga, 2010).
First, the presence of a large labour pool may reduce the risk and uncertainty of idiosyncratic shocks for both firms and employees. In the case of both positive and negative firm-specific shocks, higher availability of workers with industry-specific skills may allow companies to respectively expand or reduce employment without significantly affecting unemployment (Gaigné and Sanch-Maritan, 2019) or wages and expected profits (Krugman, 1992). Hence, localised labour pooling generates efficiency gains by reducing both the risk of unemployment and the constraints to firm growth due to labour shortages (Duranton and Puga, 2004). The benefits of pooling are not sector-specific and can also occur across sectors employing workers with similar skills (Ellison et al., 2010). Notwithstanding higher switching costs, pooling effects between sectors may be even larger as contemporaneous shocks affecting different sectors are less likely to occur (Stahl and Walz, 2001). Similar arguments are provided by conceptual work in evolutionary economic geography, where regional resilience is discussed as the result of adaptation and adaptability processes which rely on knowledge proximity in the underlying employment base, with workers moving to related industries in the presence of sector-specific shocks (Boschma, 2015).
Second, dense local labour markets may also lead to better skills matching. Intuitively, agglomeration provides more job opportunities and increases the number of potential matches between workers and vacancies (Coles and Smith, 1998). Helsley and Strange (1990) develop a formal model to demonstrate that cities characterised by an increasing number of agents trying to acquire matches will result in a better fit between jobs and skills. More specifically, a skill space more densely covered by workers and firms reduces the difference between the skills demanded and those supplied, minimising mismatch and lowering average retraining costs (Puga, 2010).
Empirical work has explored both interpretations of the effects of localised labour market pooling. Earlier studies on risk-sharing and uncertainty reduction from density effects have revealed industrial co-agglomeration patterns of industries that utilise similar labour (Ellison et al., 2010) as well as spatial concentration of sectors characterised by establishments experiencing more idiosyncratic volatility (Overman and Puga, 2010). More recently, Steijn et al. (2022) have explored changes in the relative effects of input-output linkages and labour market pooling vis-à-vis knowledge spillovers in the evolution of coagglomeration patterns. Other studies using microdata also support the hypothesis that agglomerations, specifically for localisation economies, increase the probability of finding employment for job seekers (Di Addario, 2011). Using a range of employee-based survey data, Andini et al. (2013) find a positive relationship between density and turnover, which could signal how agglomerations allow workers to easily switch jobs just as effortlessly as firms can change employees (Rosenthal and Strange, 2004). Moretti and Yi (2024) further provide evidence of shorter non-employment spells and smaller earning losses for workers in thick labour markets following their firm’s closure.
Complementary evidence is also offered by empirical research on regional resilience and labour market flows. Several studies have shown the resilience of labour markets is positively related to the size and relatedness of regional industries (Diodato and Weterings, 2015). This reflects how displaced workers may find new employment more effectively by moving across related industries. With respect to this, various studies exploring Marshallian externalities on (re)employment benefits indicate workers are more likely to move to local skill-related sectors rather than finding non-local jobs (Neffke et al., 2017, 2018). More broadly, workers change occupation and industry less often in more densely populated areas (Bleakley and Lin, 2012). Evidence also suggests this advantage of thick local labour markets may be particularly important for low-wage workers in declining industries (Chrisinger et al., 2012).
While a higher rate of matches does suggest that agglomeration is having an impact on local labour markets, it does not confirm that these matches are of higher quality nor that they fully utilise the skill endowment in the locality. With respect to the relationship between agglomeration and matching, earlier work provides initial evidence by showing that married couples where both partners have at least college degrees are increasingly likely to be located in large metropolitan areas (Costa and Kahn, 2000). This suggests that larger cities may reduce co-location problems of dual-career households by increasing the chances that both partners find suitable job matches. Also focusing on education attainment, Abel and Deitz (2015) find that denser urban environments increase the likelihood and the quality of job matching, proxied by observing whether graduates are in occupations that requires a college degree and the correspondence between individuals’ college majors and their occupations. At the same time, Andini et al., (2013) find weak evidence for density effects on workers’ self-reported appropriate experience for a job and other measures of matching, speculating there may be significant variation for matching effects across industries. Indeed, labour pooling effects have been found to be highly heterogeneous across sectors, and evolving over time (Faggio et al., 2020; Steijn et al., 2022).
A growing strand of research has focused on testing for the presence of positive assortative matching, reflecting co-location between workers and firms of similar quality, usually measured through wage mark-ups. Andersson et al. (2007) identify a positive relationship between labour market density of counties in California and Florida and the quality of firm and worker matching, leading to higher urban productivity levels. In contrast, other studies find limited evidence of worker–firm matching within sectoral agglomerations (Figueiredo et al., 2014) or a negative correlation between the degree of assortative matching and density (Mion and Naticchioni, 2009). Using data for travel to work areas in England and Wales, Melo and Graham (2014) shed more light on these contradictory findings using proxies for worker and firm productivity from the estimation of wage and production function models, providing stronger evidence in support of a positive impact of agglomeration economies on the quality of employee–employer matching. Assortative matching may be particularly pronounced in larger cities, and for college-educated workers or those conducting non-routine abstract tasks (Leknes et al., 2022). In a recent contribution, Dauth et al. (2022) underline the role of stronger within-city assortative matching in larger and denser metro areas as a driver of wage differences across German cities. They also suggest a possible explanation for assortative matching may be due to lower search costs in denser cities. Using survey data on job vacancies, they offer some initial cross-section evidence that city size is negatively associated with the probability of having difficulties filling vacancies.
Assortative matching of workers and firms provides important evidence on the role of agglomeration for better skills matching, yet it is founded on the premise that wages precisely reflect workers’ abilities. While there is likely a strong correlation between wages and abilities, ceteris paribus, wages still may not accurately reflect workers’ abilities given the plethora of individual factors that are known to impact wages. This includes but is not limited to, discrimination based on gender (Oaxaca, 1973), race (Reimers, 1983) full-time status (Ermisch and Wright, 1993) and disabilities (Kidd et al., 2000) as well as firm and market-level factors such as trade unions (Blanchflower and Bryson, 2010), firm structure (Gruetter and Lalive, 2009) and employment sector (Carruth et al., 2004). To address this, researchers have considered more direct measures of matching, with more recent work utilising education measures to explore the link between agglomeration and skills matching. In particular, Berlingieri’s (2019) work measuring the quality of education matches in thicker labour markets provides a more direct test of Marshallian pooling effects, allowing both vertical and horizontal mismatch to be considered. Accordingly, he shows workers in large cities exhibit less vertical mismatch, where a worker has education above or below what is required in their current job, as well as horizontal mismatch where workers are employed in a different field to their education or training.
While educational qualifications provide more valuable evidence of how agglomeration effects can impact matching, it still falls short of capturing the full picture of human capital. It is widely acknowledged that there is significant variation in skills and abilities across individuals with the same qualification level. Furthermore, education levels only provide a snapshot at a static point in a worker’s lifetime (Bacolod et al., 2010). Educational qualifications do not reflect the acquisition of skills and knowledge during work; either through on-the-job training or by accumulating experience. Beyond this concern, education measures also do not capture softer interpersonal skills which are increasingly seen as important in the labour market (UKCES, 2015), leaving a large part of each worker’s skillset unaccounted for. A final concern with education measures being used to proxy human capital arises when we consider the two tails of the qualification spectrum. Qualifications are measured on a scale to derive mismatch measures, effectively meaning that a worker with the highest qualification type cannot be classed as underqualified for their job even if they do not fully possess the skill set required to complete the job to a proficient standard. Likewise, workers who are at the bottom of the education spectrum without any formal qualifications may still possess more skills and experience than required for their current role but cannot be classified as overqualified. These key distinctions between qualifications and skills are supported by a number of empirical studies, with evidence from Allen and van der Velden (2001) highlighting the differing pathways education mismatch and skill mismatches have on the individual and Morris et al. (2020) showing that skill gaps and shortages have a significant impact on regional productivity even after controlling for the effect of education levels.
Overall, the theoretical and empirical literature that has developed on Marshall’s insights provides a good foundation for the labour-market pooling hypothesis. It suggests agglomeration economies can support workers’ mobility and therefore supply firms with their employment requirements as well as providing more effective matching between labour demand and supply. Building on these contributions, we complement this strand of research by bringing to the fore the importance of skills as originally highlighted by Marshall, who noted that ‘employers are apt to resort to any place where they are likely to find a good choice of workers with the special skill which they require; while men seeking employment naturally go to places where there are many employers who need such skill as theirs and where therefore it is likely to find a good market’ (Marshall, 1890, p. 271). Accordingly, we would expect agglomeration externalities to support labour market flows and worker-firm matching, as captured by prior studies considering indirect measures of skills based on job mobility, wages or education attainment. In doing so, we argue agglomeration effects should also improve skills matching and lead to a reduction of skills deficiencies in the locality both in terms of skills gaps in existing staff as well as skills shortages in the external labour market.
3. Data and methodology
3.1 Data
This paper utilises a region-industry approach for its analysis, based on a biennial panel from 2009 to 2019 obtained by merging information from the Employer Skills Survey (ESS) and the Business Structure Database (BSD).
The ESS is a representative cross-sectional survey of UK establishments conducted biennially by the Department for Business and Trade which covers approximately 4% of UK establishments (UK Commission for Employment and Skills, Department for Education, 2023). The survey covers establishment sizes above sole working proprietors and covers all sectors and regions of the UK. The detailed questions in the ESS on a variety of skill-matching issues that firms currently face are exploited to provide the skill measures for this study. Specifically, we focus on measures of skill gaps, vacancies, hard-to-fill vacancies and skill shortage vacancies. Firstly, we define a measure of internal skill mismatch that we refer to throughout as skill gaps. This represents the share of existing staff that the firm does not deem as fully skilled at their job and is based on the survey question ‘How many of your existing staff would you regard as fully proficient at their job? (a proficient employee is someone able to do the job to the required level)’. It thus signals whether firms have hired less skilled workers as they have not been able to find adequately skilled matches in the labour market. We also measure external skill mismatch by investigating the current jobs that firms are trying to fill. We include measures of the number of vacancies firms currently have, as well as the number of vacancies the firm reports as proving hard-to-fill (labelled throughout as hard-to-fill vacancies). These vacancies could be proving difficult to fill for a number of reasons including factors such as the compensation the firm pays or the working conditions on offer. Thus, to ensure that these recruitment issues are being caused by skill mismatch we further include a measure of skill shortage vacancies in the work. This measure is derived from the question: ‘What are the main causes of having a hard-to-fill vacancy?’. Where firms report a skill reason as the primary cause for the hard-to-fill vacancy then we can be confident that the matching issue is due to mismatch in regional labour market skills and not other job or firm-specific characteristics. Including both internal and external measures of skill mismatch should allow us to pick up on a broader range of labour market effects. For our analysis, we consider the share of firms in a region-industry reporting each of these types of mismatches over the total number of respondents to the ESS in the region-industry.
While the ESS offers unique and nuanced information on skills deficiencies, it also presents two potential drawbacks. Firstly, the ESS provides self-reported data from employers, which adds an element of subjectivity into the proposed measures. However, this allows the measures derived to reflect the variation in how firms interpret vacancies and skill levels. Firms have norms for how long it takes for vacancies to be filled and the skill level of their employees based on their own expectations and experiences in their relative labour market which can thus be captured. In addition, our analysis includes region-industry fixed effects for all the estimations, thus removing any time-invariant differences in how skill mismatches are perceived across local labour markets. Furthermore, prior literature indicates measures based on self-assessments1 are preferable to approaches based on job evaluation by analysts or the ‘realised matches’ method based on the distribution of educational qualifications within occupations (Berlingieri, 2019). Accordingly, they are commonly utilised in prior studies (McGuinness and Ortiz, 2016).
Secondly, the ESS utilises a stratified random sampling approach for establishments based on geography, sector and size, drawing from the business population in the Inter-Departmental Business Register (IDBR). Sectors are defined using broad categories based on the Standard Industrial Classification (SIC), with coverage at a local level ensured by quota targets for Local Authority (LA) grouped according to Local Education Authority (LEA)2. In order to preserve the representativeness of the ESS survey, we aggregate skill information on around 60,000 establishments per wave at the NUTS2 region and across 15 broad industrial sectors, which is the closest level of aggregation to the ESS survey sampling level. This imposes a coarser level of aggregation vis-à-vis other studies focusing on commuting zones designed to approximate self-contained local labour markets (see e.g. Andini et al., 2013 and; Melo and Graham, 2014), as well as a more granular industrial classification (Andersson and Larsson, 2022). For the sake of comparison, we conduct robustness checks aggregating the data at the Travel To Work Areas (TTWAs) and industry SIC 2-digit level. While this yields consistent results, we consider these results only as robustness tests due to the aforementioned sampling framework.
The second major dataset used in our study is the BSD. Provided by the Office for National Statistics, the BSD includes information on the population of businesses in the UK (ONS, 2023). The BSD is drawn from the Inter-Departmental Business Register (IDBR) and thus utilises administrative data systems such as Company Registration, VAT and employee income tax payments to ensure validity and completeness. This dataset provides detailed firm-level information on employment, turnover, firm location and sector. We utilise this rich information to create our main explanatory and control variables in the analysis. In particular, our main explanatory variable reflecting agglomeration economies due to dense local labour markets is obtained by measuring industrial density, defined as the total number of firms in each region-industry at time t divided by the region’s area3. Additional control variables in the analysis include the Herfindahl–Hirschman index (HHI), a commonly used measure of market concentration calculated by squaring the market share of each firm competing in the market and then summing the resulting numbers for all firms in a region-industry, and the average region-industry labour productivity, measured as total turnover over employment.
Data from the ESS is combined with regional-industry averages from the population of firms in the BSD to create our final panel. To ensure robustness in the work and reduce the risk of statistical disclosure, we removed region-industry-year cells with less than 10 respondents in the ESS, corresponding to removing observations in the bottom quartile of the number of respondents’ distribution. This ensures that none of the regional-industry averages used in the work are driven by an unrepresentative small number of firms. This resulted in most of the Northern Ireland and Scotland regions being removed from the sample, and to ensure transparency these areas were withdrawn completely from the sample. This leaves the final panel with a total of 2,409 region-industry cells covering England and Wales over the 6 waves covering the decade of 2009–2019.
We report descriptive statistics across industries for our main variables of interest in Figure 1. The data show relatively higher levels of agglomeration among services industries, which tend to be clustered usually in large urban areas. However, the highest levels of both skills vacancies and skills gaps are reported by firms in manufacturing industries, with particularly acute mismatches in the food processing industry and in the machinery sector. Figure 2 reports the same statistics but at the regional level. Here, we also observe an opposite distribution of agglomeration economies and skills mismatch across space. Industrial density is particularly high in regions characterised by large urban centres, mainly in the Greater London area, the West Midlands and the Greater Manchester area. Skill vacancies and gaps are scattered across peripheral regions, with more intense mismatch in the East of England, Wales, and Yorkshire, in line with evidence from previous work (Morris et al., 2020).
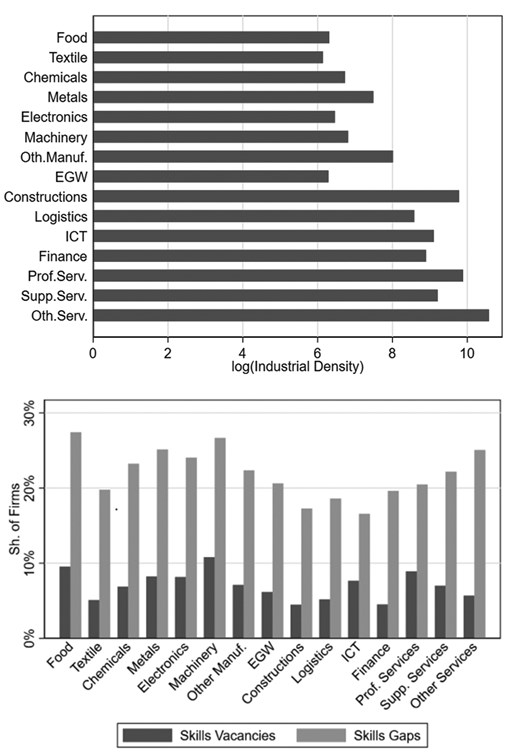
Industry agglomeration, skills vacancies and gaps. Notes: Statistics elaborated using data from the Employer Skills Survey and the Business Structure Database over the period 2009–2019 for 15 aggregated industries based on the SIC 2007 industrial classification.


Regional agglomeration, skills vacancies and gaps. Notes: Statistics elaborated using data from the Employer Skills Survey and the Business Structure Database over the period 2009–2019 for NUTS2 regions in England and Wales.
3.2 Methodology
To analyse the effect of agglomeration forces on skills mismatch, we start by estimating an ordinary least-squares (OLS) model as follows:
where represents the share of firms in a region r, industry i and time t reporting each of the four different measures of skills mismatch we define in Section 3.1: skills gaps, vacancies, hard-to-fill vacancies and skills shortages vacancies. The main parameter of interest will be , identifying the relationship between the industrial density in a region-industry and the various measures of skills mismatch listed above. In addition, following the Marshallian prediction of agglomeration driven by sharing inputs suppliers, we also analyse the potential spillover originating from the density of related and vertically integrated industries located within the same region which are linked through supply chain relationships () (Ellison et al., 2010). This is calculated by weighting the industrial density of sector j in region r at time t () by the average share of inputs of production that industries i and j source from each other at the national level (), measured using data from the ONS UK input–output tables for year 2014, and summing it up for all j industries related to i. In addition, we also distinguish between spillovers originating from the density of upstream and downstream industries, where in that case represents the share of inputs of production supplied by sector j over the total demand of inputs of production by sector i, or the share of demand from sector j over total demand for inputs produced by sector i, respectively.
We control for time-variant region-industry characteristics by including the HHI of market concentration and the average region-industry labour productivity. In addition, to reduce the risk of omitted unobservable bias4 we control for region-industry time-invariant characteristics () and for any time-variant region-specific characteristics () by including fixed-effects.
Although the inclusion of appropriate control variables and extensive fixed-effects mitigates potential issues related to omitted variables bias, there are still threats to the identification of a causal relationship between agglomeration and skills mismatch. As noted in the literature on agglomeration and skills matching (Combes et al., 2008; Glaeser and Resseger, 2010; Berlingieri, 2019), these concerns are due to the potential for reverse causality and further unobserved factors which might be correlated with agglomeration and skills shortages.5 To address these issues, we also implement a two-stage least-squares (2SLS) approach, instrumenting our agglomeration variable with a plausibly exogenous instrumental variable. To do this, we use a Bartik (1991) instrument formed by interacting the exposure to a common shift with a differential localised exposure. In our case, we take into account the employment density in a region-industry almost 100 years before the beginning of our period of analysis, using information from the 1921 Census of England and Wales digitised by the National Archives. This provides information on the sector of employment of all residents across census areas in 1921, which we link to the region-industry classification we use in this analysis to identify the initial local conditions—the total employment in industry i and region r in 1921 () divided by the area of region r () (the ‘share’). We then interact this with the overall number of firms in an industry at the national level in each year in our sample () (the ‘shift’):
As a result, our Bartik instrument () would provide the predicted weighted average of the exogenous growth in a given industry nationwide in which the weights are dependent on the initial local distribution. Following the recent methodological literature on the use of Bartik instruments, we assess the validity of our instrument (Goldsmith-Pinkham et al., 2020; Borusyak et al., 2022). We can thus claim that both components of our instrumental variable are, at least partially, exogenous conditional on the inclusion of fixed-effects. First, the employment density in 1921 can be considered exogenous to more recent regional employment trends conditional on observables (e.g. location fixed effects), as the UK economy has experienced a radical transformation since the Second World War, including major economic shocks in the 1970s followed by the deindustrialisation during the 1980s and the global financial crisis of 2008, transitioning to a new wave of high-tech manufacturing revival, and the growth of financial, digital and creative services.6 Secondly, the temporal shocks also can provide an exogenous source of variation, as the evolution of an industry at the national level can be considered as good as random and it is not driven by the industry of a specific region. We check the validity of our instrument providing the results of the first-stage in Table A1, and reporting the tests for weak instruments and identification.7 We follow the same approach to build the instruments for the spillover density variables, where the variable is weighted by the relative importance of industry j as customer or supplier of industry i, as explained above.
4. Results and discussion
We start exploring the relationship between industrial density and skills mismatch by reporting the results from our baseline OLS model in Table 1. We report all our results including time, region-industry, and time-variant region-specific fixed-effects. We find a negative and statistically significant effect of industrial density on the different measures of vacancies, but not for skill gaps. In addition, density spillovers, and more particularly spillovers from the density of upstream sectors, seem to matter only for vacancies caused by skill shortages. These results provide initial evidence supporting the hypothesis of a significant role of agglomeration effects in reducing skills mismatch in the locality. However, as previously noted, OLS estimates may suffer from endogeneity issues in the form of reverse causality and omitted variable bias due to the spatial sorting of skilled workers into agglomerated locations (Combes et al., 2008; Berlingieri, 2019). In other words, we need to take into account potential complementarities between skills and agglomeration, as skills provision may strengthen incentives for co-location whilst agglomeration economies facilitate the accumulation of skills (Glaeser and Resseger, 2010).
Relationship between agglomeration and skills vacancies and gaps—OLS estimates
| (1) | (2) | (3) | (4) | (5) | (6) | (7) | (8) | |
|---|---|---|---|---|---|---|---|---|
| Skill gaps | Vacancies | Skill-shortage vacancies | Hard-to-fill vacancies | |||||
| Ind. density | −0.0130 | −0.0131 | −0.0274*** | −0.0270*** | −0.0203*** | −0.0204*** | −0.0193*** | −0.0194** |
| (0.00840) | (0.00842) | (0.00847) | (0.00847) | (0.00486) | (0.00485) | (0.00560) | (0.00561) | |
| Density spillover | −0.0117 | 0.000386 | −0.0148* | −0.0128 | ||||
| (0.0105) | (0.0203) | (0.00818) | (0.0123) | |||||
| Downstream density | −0.00308 | −0.0110 | −0.00647 | −0.00421 | ||||
| (0.0116) | (0.0186) | (0.00822) | (0.0112) | |||||
| Upstream density | −0.00749 | 0.00602 | −0.00815* | −0.00782 | ||||
| (0.00810) | (0.0113) | (0.00452) | (0.00672) | |||||
| HH Index | −0.0354 | −0.0360 | −0.0353 | −0.0335 | −0.00103 | −0.00130 | −0.00414 | −0.00460 |
| (0.0408) | (0.0408) | (0.0344) | (0.0342) | (0.0248) | (0.0248) | (0.0259) | (0.0260) | |
| Lab. productivity | 0.0111 | 0.0111 | 0.00421 | 0.00417 | −0.00129 | −0.00129 | −0.00511 | −0.00510 |
| (0.00715) | (0.00714) | (0.00722) | (0.00721) | (0.00501) | (0.00501) | (0.00551) | (0.00552) | |
| Observations | 2,412 | 2,412 | 2,409 | 2,409 | 2,409 | 2,409 | 2,410 | 2,410 |
| R-squared | 0.428 | 0.428 | 0.563 | 0.563 | 0.486 | 0.486 | 0.503 | 0.503 |
| NUTS2-IND FE | Y | Y | Y | Y | Y | Y | Y | Y |
| YEAR FE | Y | Y | Y | Y | Y | Y | Y | Y |
| NUTS2-YEAR FE | Y | Y | Y | Y | Y | Y | Y | Y |
Notes: Results estimated using an OLS model. Robust standard errors clustered at the region-industry level reported in parentheses.
Source: Authors’ elaboration based on ESS and BSD data.
***p < 0.01, **p < 0.05, *p < 0.1.
To address these concerns, we report the results from a two-stage least-squares (2SLS) estimation based on a Bartik-type shift-share instrumental approach in Table 2.8 Once we address the endogeneity concerns, we observe that the coefficient of industrial density is negative and statistically significant at least at the 5% level across all four measures of skills mismatch. These estimates indicate that a 1% increase in industrial density would decrease skills vacancies by around 2.9%, and internal skills gaps by approximately 2.6%. In addition, the 2SLS estimates also confirm the role played by the density in vertically integrated industries, providing positive externalities to reduce skill shortage vacancies in particular. These effects are smaller in magnitude with respect to the direct impact of agglomeration density within the same industry as expected, where a 1% increase in agglomeration density in upstream sectors would help to reduce skill shortages vacancies by around 0.6%. The presented results are robust to the use of an alternative measure of agglomeration calculated as the region-industry employment density, reported in Table A2, and to the aggregation of the data at a more granular level, considering TTWA commuting zones and SIC 2-digit industries as we do in Table A3.
Relationship between agglomeration and skills vacancies and gaps—2SLS estimates
| (1) | (2) | (3) | (4) | (5) | (6) | (7) | (8) | |
|---|---|---|---|---|---|---|---|---|
| Skill gaps | Vacancies | Skill-shortage vacancies | Hard-to-fill vacancies | |||||
| Ind. density | −0.0256** | −0.0263** | −0.0398*** | −0.0382*** | −0.0294*** | −0.0290*** | −0.0316*** | −0.0311*** |
| (0.0123) | (0.0125) | (0.0119) | (0.0120) | (0.00698) | (0.00707) | (0.00738) | (0.00746) | |
| Density spillover | −0.00165 | 0.00388 | −0.0116* | −0.00867 | ||||
| (0.00905) | (0.0146) | (0.00702) | (0.0104) | |||||
| Downstream density | 0.00843 | −0.0189 | −0.0119 | −0.0103 | ||||
| (0.0133) | (0.0123) | (0.00989) | (0.0104) | |||||
| Upstream density | −0.00474 | 0.0108 | −0.00640** | −0.00197 | ||||
| (0.00833) | (0.0101) | (0.00327) | (0.00691) | |||||
| HH Index | −0.0413 | −0.0438 | −0.0877** | −0.0821** | −0.0284 | −0.0269 | −0.0620* | −0.0605* |
| (0.0490) | (0.0492) | (0.0364) | (0.0365) | (0.0283) | (0.0283) | (0.0334) | (0.0335) | |
| Lab. productivity | 0.0109* | 0.0108* | −0.00137 | −0.00111 | −0.00192 | −0.00185 | −0.00650 | −0.00643 |
| (0.00614) | (0.00613) | (0.00761) | (0.00761) | (0.00418) | (0.00418) | (0.00512) | (0.00512) | |
| NUTS2-IND FE | Y | Y | Y | Y | Y | Y | Y | Y |
| YEAR FE | Y | Y | Y | Y | Y | Y | Y | Y |
| NUTS2-YEAR FE | Y | Y | Y | Y | Y | Y | Y | Y |
| Observations | 2,083 | 2,083 | 2,081 | 2,081 | 2,082 | 2,082 | 2,081 | 2,081 |
| R-squared | 0.196 | 0.196 | 0.304 | 0.303 | 0.343 | 0.343 | 0.380 | 0.380 |
Notes: Results estimated using a 2SLS model. Robust standard errors clustered at the region-industry level reported in parentheses.
Source: Authors’ elaboration based on ESS and BSD data.
***p < 0.01, **p < 0.05, *p < 0.1.
Relationship between agglomeration and skills vacancies and gaps—OLS and 2SLS estimates using employment density
| OLS | (1) | (2) | (3) | (4) | (5) | (6) | (7) | (8) |
|---|---|---|---|---|---|---|---|---|
| Skill gaps | Vacancies | Skill-shortage vacancies | Hard-to-fill vacancies | |||||
| Empl. density | −0.0174* | −0.0174* | −0.0158* | −0.0156* | −0.0155*** | −0.0156*** | −0.0149** | −0.0150** |
| (0.00943) | (0.00944) | (0.00829) | (0.00825) | (0.00535) | (0.00535) | (0.00614) | (0.00614) | |
| Density spillover | −0.0133 | 0.00265 | −0.0149 | −0.0105 | ||||
| (0.018) | (0.0321) | (0.0139) | (0.0195) | |||||
| Downstream density | −0.00826 | −0.0189 | −0.00478 | −0.00275 | ||||
| (0.0217) | (0.0315) | (0.0129) | (0.0168) | |||||
| Upstream density | −0.00547 | 0.0154 | −0.00926 | −0.007 | ||||
| (0.0126) | (0.0179) | (0.0086) | (0.0105) | |||||
| HH Index | 0.00878 | 0.00878 | 0.0161 | 0.0185 | 0.0446* | 0.0441* | 0.0398 | 0.0393 |
| (0.0478) | (0.0477) | (0.0368) | (0.0366) | (0.0266) | (0.0267) | (0.0275) | (0.0276) | |
| Lab. productivity | 0.0109 | 0.0109 | 0.00376 | 0.0033 | −0.00183 | −0.00173 | −0.00561 | −0.00553 |
| (0.00714) | (0.00714) | (0.00729) | (0.00726) | (0.00502) | (0.00504) | (0.00552) | (0.00555) | |
| Observations | 2412 | 2412 | 2409 | 2409 | 2409 | 2409 | 2410 | 2410 |
| R-squared | 0.428 | 0.428 | 0.561 | 0.562 | 0.484 | 0.484 | 0.502 | 0.502 |
| 2SLS | (9) | (10) | (11) | (12) | (13) | (14) | (15) | (16) |
| Skill Gaps | Vacancies | Skill-Shortage Vacancies | Hard-to-Fill Vacancies | |||||
| Empl. density | −0.0299** | −0.0302** | −0.0438*** | −0.0416*** | −0.0328*** | −0.0323*** | −0.0342*** | −0.0334*** |
| (0.0147) | (0.0148) | (0.0147) | (0.0148) | (0.00839) | (0.00856) | (0.00885) | (0.00911) | |
| Density spillover | −0.00089 | −0.0501** | −0.0165 | −0.017 | ||||
| (0.0171) | (0.0225) | (0.0145) | (0.0164) | |||||
| Downstream density | 0.00706 | 0.0188 | −0.00175 | −0.03 | ||||
| (0.0227) | (0.0176) | (0.0222) | (0.0245) | |||||
| Upstream density | −0.00303 | −0.0527* | −0.0223** | 0.00111 | ||||
| (0.0117) | (0.028) | (0.0114) | (0.0131) | |||||
| HH Index | 0.0322 | 0.0314 | 0.0213 | 0.0268 | 0.053 | 0.0544 | 0.0235 | 0.0256 |
| (0.058) | (0.0581) | (0.0479) | (0.0473) | (0.0339) | (0.0337) | (0.0382) | (0.0379) | |
| Lab. productivity | 0.0106* | 0.0106* | −0.0018 | −0.00192 | −0.00253 | −0.00256 | −0.00708 | −0.00713 |
| (0.00619) | (0.00619) | (0.00784) | (0.00779) | (0.00418) | (0.00419) | (0.00516) | (0.00516) | |
| F-stat | 2302.81 | 505.13 | 2302.81 | 505.13 | 2302.81 | 505.13 | 2302.81 | 505.13 |
| Observations | 2083 | 2083 | 2081 | 2081 | 2082 | 2082 | 2081 | 2081 |
| R-squared | 372 | 372 | 372 | 372 | 372 | 372 | 372 | 372 |
| NUTS2-IND FE | Y | Y | Y | Y | Y | Y | Y | Y |
| YEAR FE | Y | Y | Y | Y | Y | Y | Y | Y |
| NUTS2-YEAR FE | Y | Y | Y | Y | Y | Y | Y | Y |
Notes: Results estimated using OLS and 2SLS models. Robust standard errors clustered at the region-industry level reported in parentheses.
Source: Authors’ elaboration based on ESS and BSD data.
***p < 0.01, **p < 0.05, *p < 0.1.
Relationship between agglomeration and skills vacancies and gaps—OLS and 2SLS estimates using data at TTWA and SIC2 level
| OLS | (1) | (2) | (3) | (4) | (5) | (6) | (7) | (8) |
|---|---|---|---|---|---|---|---|---|
| Skill gaps | Vacancies | Skill-shortage vacancies | Hard-to-fill vacancies | |||||
| Ind. density | −0.0251* | −0.0233 | 0.0145 | 0.0149 | −0.0231** | −0.0218** | −0.0228** | −0.0221** |
| (0.0145) | (0.0145) | (0.0154) | (0.0154) | (0.00984) | (0.00982) | (0.0109) | (0.0109) | |
| Density spillover | −0.00486 | −0.0182*** | −0.00513* | −0.00962*** | ||||
| (0.0038) | (0.00473) | (0.00263) | (0.00289) | |||||
| Downstream density | 0.00315 | −0.00866* | 0.00143 | −0.00311 | ||||
| (0.00374) | (0.00454) | (0.00269) | (0.00274) | |||||
| Upstream density | −0.00830*** | −0.0106*** | −0.00687*** | −0.00707*** | ||||
| (0.00319) | (0.0038) | (0.00233) | (0.00254) | |||||
| HH Index | 0.0183 | 0.0183 | 0.0136 | 0.0136 | 0.00752 | 0.00754 | 0.00539 | 0.0054 |
| (0.0141) | (0.0141) | (0.0142) | (0.0142) | (0.00886) | (0.00885) | (0.00977) | (0.00977) | |
| Lab. productivity | −0.0049 | −0.0049 | 0.00181 | 0.00181 | 0.00142 | 0.00141 | 0.00415 | 0.00415 |
| (0.004) | (0.004) | (0.00421) | (0.00421) | (0.00249) | (0.00249) | (0.00282) | (0.00282) | |
| Observations | 23524 | 23524 | 23524 | 23524 | 23524 | 23524 | 23524 | 23524 |
| R-squared | 0.368 | 0.368 | 0.465 | 0.465 | 0.377 | 0.377 | 0.411 | 0.411 |
| 2SLS | (9) | (10) | (11) | (12) | (13) | (14) | (15) | (16) |
| Skill Gaps | Vacancies | Skill-Shortage Vacancies | Hard-to-Fill Vacancies | |||||
| Ind. density | 0.00796 | 0.00817 | −0.0591* | −0.0592* | −0.0643*** | −0.0644*** | −0.0501** | −0.0504** |
| (0.0358) | (0.0359) | (0.0345) | (0.0345) | (0.0209) | (0.021) | (0.0238) | (0.0239) | |
| Density spillover | −0.00626 | −0.00488 | −0.000174 | −0.00418 | ||||
| (0.00574) | (0.00688) | (0.00408) | (0.00447) | |||||
| Downstream density | −0.00168 | −0.00368 | −0.00115 | −0.0052 | ||||
| (0.00454) | (0.00596) | (0.00372) | (0.00352) | |||||
| Upstream density | −0.00435 | −0.0018 | 0.000613 | −0.000179 | ||||
| (0.00446) | (0.00544) | (0.00332) | (0.00358) | |||||
| HH Index | 0.0227 | 0.0227 | 0.00885 | 0.00885 | 0.00591 | 0.0059 | 0.00769 | 0.00769 |
| (0.0159) | (0.0159) | (0.0155) | (0.0155) | (0.00977) | (0.00978) | (0.0106) | (0.0106) | |
| Lab. productivity | −0.00394 | −0.00394 | −0.000627 | −0.000625 | 0.000498 | 0.0005 | 0.0032 | 0.0032 |
| (0.00447) | (0.00447) | (0.00447) | (0.00447) | (0.00266) | (0.00266) | (0.00296) | (0.00296) | |
| F-stat. | 1888.1 | 543.18 | 1888.1 | 543.18 | 1888.1 | 543.18 | 1888.1 | 543.18 |
| Observations | 20252 | 20252 | 20252 | 20252 | 20252 | 20252 | 20252 | 20252 |
| R-squared | 0.069 | 0.069 | 0.127 | 0.127 | 0.093 | 0.093 | 0.111 | 0.111 |
| TTWA-SIC2 FE | Y | Y | Y | Y | Y | Y | Y | Y |
| YEAR FE | Y | Y | Y | Y | Y | Y | Y | Y |
| TTWA-YEAR FE | Y | Y | Y | Y | Y | Y | Y | Y |
Notes: Results estimated using OLS and 2SLS models. Robust standard errors clustered at the region-industry level reported in parentheses.
Source: Authors’ elaboration based on ESS and BSD data.
***p < 0.01, **p < 0.05, *p < 0.1.
These results provide robust evidence to support the Marshallian hypothesis that agglomeration economies in the form of thick labour markets play a positive role in providing a constant market for skills, reducing both skills gaps within the employed workforce as well as skills shortage vacancies in the regional labour market external to the firm. Our analysis broadly confirms and complements previous empirical work on the relationship between thick labour markets and matching effects. In particular, these findings extend prior cross-section evidence on the negative relationship between labour market size and hard-to-fill vacancies (Dauth et al., 2022) and the higher probability of finding employment for job seekers in agglomerations (Di Addario, 2011). We show these effects also apply to the specific case of such vacancies being due to skills shortages in the external labour market. Using an employer-based assessment of skills deficiencies, as provided in the ESS, our analysis also complements previous evidence on a negative relationship between density and workers’ assessment of the difficulty for employers to potentially find replacements (Andini et al., 2013). Furthermore, differently from Andini et al. (2013), who find no statistically significant effects of industrial density on the likelihood of workers having the appropriate experience and education for their job, we show the role of agglomeration externalities do not only impact processes of job search but similarly reduce skills gaps within the employed workforce. By bringing the focus on direct measures of skills mismatch in the form of both skills gaps and skill shortage vacancies, we similarly complement recent work focusing on education matches in thicker labour markets as evidence of Marshallian pooling effects (Berlingieri, 2019).
We complement our main results with heterogeneity analysis considering the differences across manufacturing and service sectors, as well as across industry productivity levels. Table 3 reports 2SLS estimates for our four main measures of skills mismatch across manufacturing and service industries. These results confirm a negative and statistically significant coefficient for industrial density in the case of manufacturing, with the exception of internal skills gaps. In contrast, results are broadly statistically not significant for services, though a positive coefficient is evidenced with respect to skills gaps. In addition, we identify much stronger agglomeration externalities for skill mismatches in manufacturing sectors originating from vertically integrated industries, with positive effects on the reduction of all four measures of skills mismatches. These are mostly originating from upstream industries, reflecting the effects of co-location with a wider pool of intermediate inputs suppliers highlighted in the agglomeration literature (Holmes, 1999; Ellison et al., 2010; Steijn et al., 2022). Overall, these results suggest the presence of heterogeneous effects across the main economic sectors. In line with previous evidence (Andini et al., 2013), agglomeration effects appear stronger in manufacturing establishments, though these are also likely to be characterised by significant heterogeneity in labour pooling effects (Faggio et al, 2020). In particular, reflecting recent studies suggesting matching effects in agglomerations may be more pronounced in industries where human capital is more specialised and less portable (Leknes et al., 2022; Moretti and Yi, 2024), we speculate such differences could reflect a more specific required skills base in manufacturing sectors, with thick labour markets becoming more critical in filling gaps and shortages when skills are tied explicitly to specialised tasks or equipment. In contrast, labour markets across service industries might be characterised by a skillset with wider applicability, flexibility and a higher degree of skills relatedness (Neffke et al., 2017, 2018), supporting more fluid labour flows across sectors that reduce the role of sector-specific agglomeration effects in addressing skills deficiencies, and possibly even inducing negative poaching effects leading to higher internal skills gaps.
Heterogeneous relationship between agglomeration and skills vacancies and gaps across industries—2SLS estimates
| (1) | (2) | (3) | (4) | (5) | (6) | (7) | (8) | |
|---|---|---|---|---|---|---|---|---|
| Skill gaps | Vacancies | |||||||
| Manufacturing | Services | Manufacturing | Services | |||||
| Ind. density | −0.0385 | −0.0419 | 0.0436*** | 0.0442*** | −0.120*** | −0.118*** | 0.016 | 0.0178 |
| (0.042) | (0.0422) | (0.0124) | (0.0127) | (0.0421) | (0.0422) | (0.0128) | (0.013) | |
| Density spillover | −0.018 | −0.0153 | −0.0299 | −0.0209 | ||||
| (0.0121) | (0.0181) | (0.0233) | (0.0208) | |||||
| Downstream density | 0.00581 | −0.0273 | −0.0248** | −0.0649* | ||||
| (0.0185) | (0.0343) | (0.0121) | (0.0384) | |||||
| Upstream density | −0.0162* | 0.000291 | −0.0109 | 0.0119 | ||||
| (0.00907) | (0.0222) | (0.0145) | (0.0238) | |||||
| HH Index | −0.226 | −0.254* | −0.00368 | −0.0046 | −0.173 | −0.158 | −0.047 | −0.0496 |
| (0.142) | (0.145) | (0.0543) | (0.0544) | (0.11) | (0.108) | (0.0367) | (0.0369) | |
| Lab. productivity | 0.00297 | 0.00319 | 0.0112* | 0.0115* | −0.00556 | −0.00568 | −0.00188 | −0.000971 |
| (0.0197) | (0.0197) | (0.00631) | (0.0064) | (0.0147) | (0.0146) | (0.00914) | (0.00926) | |
| Observations | 798 | 798 | 1285 | 1285 | 796 | 796 | 1285 | 1285 |
| R-squared | 0.331 | 0.331 | 0.297 | 0.297 | 0.449 | 0.449 | 0.474 | 0.474 |
| (9) | (10) | (11) | (12) | (13) | (14) | (15) | (16) | |
| Skill-shortage vacancies | Hard-to-fill vacancies | |||||||
| Manufacturing | Services | Manufacturing | Services | |||||
| Ind. density | −0.0626*** | −0.0648*** | 0.000909 | 0.00183 | −0.0568** | −0.0595** | −0.00483 | −0.00369 |
| (0.0215) | (0.0217) | (0.00671) | (0.00687) | (0.0243) | (0.0245) | (0.00776) | (0.00793) | |
| Density spillover | −0.0333* | −0.00882 | −0.0417** | −0.0111 | ||||
| (0.0171) | (0.00964) | (0.0173) | (0.0107) | |||||
| Downstream density | −0.00803 | −0.0312 | −0.0104 | −0.0387* | ||||
| (0.0139) | (0.0225) | (0.0128) | (0.023) | |||||
| Upstream density | −0.0213** | 0.00659 | −0.0264** | 0.00804 | ||||
| (0.0096) | (0.0115) | (0.0116) | (0.0126) | |||||
| HH Index | −0.0978 | −0.116 | 0.012 | 0.0107 | −0.131 | −0.153 | −0.0138 | −0.0154 |
| (0.0792) | (0.0813) | (0.0284) | (0.0286) | (0.0906) | (0.0956) | (0.0333) | (0.0335) | |
| Lab. productivity | −0.00515 | −0.00501 | 0.000646 | 0.0011 | −0.0131 | −0.0129 | −0.00261 | −0.00205 |
| (0.00967) | (0.00978) | (0.00498) | (0.00504) | (0.0114) | (0.0115) | (0.00603) | (0.00607) | |
| Observations | 797 | 797 | 1285 | 1285 | 796 | 796 | 1285 | 1285 |
| R-squared | 0.436 | 0.436 | 0.399 | 0.399 | 0.444 | 0.444 | 0.44 | 0.44 |
| NUTS2-IND FE | Y | Y | Y | Y | Y | Y | Y | Y |
| YEAR FE | Y | Y | Y | Y | Y | Y | Y | Y |
| NUTS2-YEAR FE | Y | Y | Y | Y | Y | Y | Y | Y |
Notes: Results estimated using a 2SLS model. Robust standard errors clustered at the region-industry level reported in parentheses.
Source: Authors’ elaboration based on ESS and BSD data.
***p < 0.01, **p < 0.05, *p < 0.1.
Finally, Figure 3 provides an overview of the heterogeneity analysis across industry productivity levels, exploring the relationship between agglomeration and skills matching at the four quartiles of the industrial productivity distribution. With respect to overall vacancies, we find the effect of industrial density to be statistically significant only for the lower quartile. In contrast, we observe significant estimates except for the lower quartile when focusing specifically on hard-to-fill and skill shortages vacancies. These differences indicate that industrial density may play a role in addressing overall vacancies in sectors characterised by low productivity levels. However, in line with recent studies (Leknes et al., 2022; Moretti and Yi, 2024), it is in higher productivity industries, where the importance of skills and the presence of high-skilled jobs are more likely to lead to hard-to-fill vacancies due to skills shortages, that agglomeration effects on skills matching become more defined. While these results point to important heterogeneity in the effect of labour pooling on skills matching, it is worth noting that our broad industrial classification does not allow us to explore the increasingly complex interdependencies of service-oriented manufacturing underpinning recent trends of servitisation and Industry 4.0 (Capello and Lenzi, 2021). Still, through this perspective, our results for manufacturing sectors and vertically integrated industries, jointly with the more pronounced effects across higher productivity industries, suggest the pooling effects on skills matching first discussed by Marshall may still play an important role in current industrial transitions.


Relationship between agglomeration and skills vacancies and gaps across productivity distribution—2SLS estimates. Notes: Results estimated using a 2SLS model with robust standard errors clustered at the region-industry level. 95% confidence interval reported. Estimates from bottom (Q1) to top (Q4) quartile of region-industry productivity.
5. Conclusions
In his seminal observation on the geographical concentration of economic activities, Marshall identified pooled labour market benefits as one of the key advantages of agglomeration economies, noting that ‘a localized industry gains a great advantage from the fact that it offers a constant market for skill’ (Marshall, 1890, p. 271). Building on this, scholars have explored the link between agglomeration externalities and pooling effects relying upon indirect evidence of efficient skills provision and better skills matching respectively in the form of job turnover and mobility rates (Di Addario, 2011; Bleakley and Lin, 2012), as well as worker-firm sorting based on wage premia and education measures as proxies for workers’ abilities (Andersson et al., 2007; Berlingieri, 2019; Dauth et al., 2022).
In this paper, we contribute to this strand of research by bringing to the fore the importance of skills as originally highlighted by Marshall. We use a panel dataset for industry-region pairs in England and Wales across the period 2009–2019 focusing specifically on direct measures of skill deficiencies from the Employers Skills Survey to provide novel empirical evidence on the role of agglomeration effects in improving skills matching as well as reducing skills deficiencies in the form of both skills gaps within the employed workforce and skills shortages in the labour market external to the firm. Applying a Bartik-type shift-share instrumental approach, we demonstrate our results are robust to potential sorting effects.
These findings have important policy implications. Prior studies note how better matching in thick labour markets may generate advantages for denser and more agglomerated regions relative to small cities and lagging areas (Rosenthal and Strange, 2004; Dauth et al., 2022). As can be inferred from the original observations by Marshall (1890), this leads to self-reinforcing effects in co-location for both skilled workers and firms, entrenching spatial imbalances. Focusing specifically on direct measures for skills provision, our analysis connects this discussion to the renewed attention towards regional industrial policy and the importance of skills development for addressing longstanding spatial imbalances and inequalities in most advanced economies (Bailey et al., 2019, 2023; OECD, 2019).
On one side, our findings support the focus on agglomeration effects as important drivers of development, to be supported not just in core cities but especially in lagging areas (HM government, 2022). At the same time, less developed regions and places lacking significant density of economic activities not only experience limited benefits from thick labour markets effects, but they also suffer from low skill provision as well. Thus, while increased support for skills training as advocated in the latest UK policy strategy for addressing regional imbalances (HM government, 2022) is clearly fundamental, interventions would be more effective when designed together with broader initiatives for regional industrial policy reflecting and leveraging the specific economic structure of different localities. To this end, greater coordination across different localised stakeholders and tailored place-based policymaking become even more critical (Bailey et al., 2018, 2023; Corradini et al., 2023). This may be particularly important for lagging areas and regions transitioning towards new industrial paths, as this requires continuous adaptation between changing demand and supply of skills (Corradini et al., 2023).
These results should be considered taking into account some of the limitations of the study, which open important directions for future research. Our data on skills deficiencies are based on employers’ assessments, allowing us to capture a wider perspective of skills beyond simple education or wage proxies. Still, while we control for region-industry fixed-effects, this approach retains a subjective component in the measures adopted. Differently from recent studies on assortative matching (Dauth et al., 2022), we focus on direct measures of skills but do not observe individual employer–employee sorting, and our results should be interpreted at the aggregate regional level. In line with prior literature, our analysis focuses on the linkages between agglomeration effects and skills mismatch. As such, it does not consider how this relationship may change across the evolution of local economies. Whilst outside the scope of this paper, complementary work is fundamental to understanding the interplay between skills provision and agglomerations in later stages of industries’ life cycle (Potter and Watts, 2011), in the presence of low skills equilibrium or for regions transitioning through path renewal and new path creation processes (Isaksen and Trippl, 2016; Corradini et al., 2023). Similarly, it would be interesting to explore the relationships identified in the paper between labour pooling and skills matching across long-run changes in agglomeration patterns (Steijn et al., 2022), or with respect to new spatialities of places and workplaces and the rise of home working following the COVID-19 pandemic, which are likely to differ across service and manufacturing industries as well as high-skilled and low-skilled workers (Althoff et al., 2022; Gokan et al., 2022). Finally, we do not have information on labour mobility in our data and cannot explore labour market flows across sectors. Such dynamics connected to our findings on agglomeration and skills provision would be important to better understand how thick labour markets may support regional resilience (Diodato and Weterings, 2015). We suggest these aspects define critical questions that require further research.
Conflict of interest statement. None declared.
Bibliography
Footnotes
Henley Business School, University of Reading, Reading, UK (CC); University of Nottingham Business School, Nottingham, UK (DM); and University of Sheffield, Sheffield, UK (EV). We are grateful for the comments received at the AAG 2019 Annual Meeting. The statistical data used here is from the Office of National Statistics (ONS) and is Crown copyright and reproduced with the permission of the controller of HMSO and Queens Printer for Scotland. The use of the ONS statistical data in this work does not imply the endorsement of the ONS in relation to the interpretation or analysis of the statistical data. The analysis upon which this paper is based uses research datasets which may not exactly reproduce National Statistics aggregates.
The ESS provides employer-based information on skill deficiencies, which offers lower levels of potential subjective bias than employee-based measures (McGuiness and Ortiz, 2014).
See the Employer Skills Survey 2019 Technical report for full details (https://assets.publishing.service.gov.uk/media/5f860d2ee90e07415f72b3ad/6099_Employer_Skills_Survey_Technical_Report_IFF_DfE.pdf).
Here, we follow Krugman’s argument that ‘the concentration of several firms in a single location offers a pooled market for workers with industry-specific skills’ (Krugman, 1991, p. 484). In additional robustness tests reported in Table A2, we use as an alternative measure of agglomeration the employment density of a region-industry, measured as the total number of employees divided by the region’s area, with fully consistent results. We prefer the industrial density measure, as it better represents the agglomeration of businesses, while employment density does not distinguish if there is an agglomeration of workers employed by multiple businesses or if it is concentrated in only a few large firms.
In all our estimations, standard errors are robust to heteroskedasticity and clustered at the region-industry level.
Measurement error is less of a concern in our case, as we use administrative data on the population of businesses in the UK to build our measures of agglomeration, as well as utilising numerous measures of skills shortages to alleviate the issues related to having to rely on self-reported measures from surveys.
In addition, to build employment in 1921 at our level of industrial aggregation, we use an old version of industrial classification, which does not precisely map the newer SIC 2007 classification used for the rest of the analysis because of the evolution of some sectors and the inclusion of new industries. This further improves the exogeneity of the initial conditions, as the instruments consider more broadly speaking the wider economic activities rather than the strict industrial classification definition.
We also provide an alternative instrument for the employment density of a region-industry, using as a shift the total number of employees in a given industry and year at the national level.
Results of the first stages and tests for instruments validity are reported in Table A1.
Appendix
Results of the first-stage regression for the 2SLS estimation
| (1) | (2) | (3) | (4) | (5) | (6) | |
|---|---|---|---|---|---|---|
| Ind. density | Ind. density | Dens. spillover | Ind. density | Downstr. dens. | Upstr. dens. | |
| Hist. ind. density | 1.012*** | 1.012*** | 0.0156** | 1.009*** | 0.0246** | 0.0143 |
| (0.0252) | (0.0253) | (0.00723) | (0.0252) | (0.0107) | (0.0146) | |
| Hist. dens. spillover | 0.00558 | 1.001*** | ||||
| (0.0508) | (0.0783) | |||||
| Hist. downstr. dens. | 0.0448 | 0.908*** | −0.361 | |||
| (0.056) | (0.0921) | (0.308) | ||||
| Hist. upstr. dens. | −0.0235 | −0.538 | 1.017*** | |||
| (0.0272) | (0.429) | (0.0781) | ||||
| HH Index | −0.0478 | −0.0476 | 0.0777** | −0.0533 | 0.160* | 0.00502 |
| (0.0967) | (0.0961) | (0.0387) | (0.0968) | (0.0914) | (0.0616) | |
| Lab. productivity | 0.00149 | 0.0014 | 0.00840** | 0.000887 | 0.00571 | 0.0129 |
| (0.00898) | (0.00897) | (0.00426) | (0.00892) | (0.00685) | (0.009) | |
| NUTS2-IND FE | Y | Y | Y | Y | Y | Y |
| YEAR FE | Y | Y | Y | Y | Y | Y |
| NUTS2-YEAR FE | Y | Y | Y | Y | Y | Y |
| F-Stat. | 1609.18 | 1609.18 | 751.748 | 1609.18 | 309.146 | 505.13 |
| Observations | 2051 | 2051 | 2051 | 2051 | 2051 | 2051 |
| R-squared | 0.998 | 0.998 | 0.999 | 0.998 | 0.996 | 0.994 |
Notes: Results of the first-stage of the 2SLS model. Robust standard errors clustered at the region-industry level reported in parentheses.
Source: Authors’ elaboration based on ESS and BSD data.
***p < 0.01, **p < 0.05, *p < 0.1.
