


Abstract
The Keynesian demand regime that existed until the 1970s was characterised by governments steering demand and employment through housing and infrastructure investments. By the 1980s, Western countries began to retreat from these capital-intensive subsidies and turned to the stimulation of homeownership-spreading private mortgage markets, but with three different ideal-typical trajectories until 2008. In construction-repressive countries, like Germany, growing exports were to fill the void of the withdrawing construction engine; in countries with construction booms, like Spain, the mortgage credit expansion temporarily generated another long construction cycle. Conversely, in countries with mortgage booms only, like the UK, mortgages exploded and generated more consumption, but no proportional construction output. We explain the divergence into different trajectories through a policy feedback mechanism: parties in construction (export) economies tend to favour construction (export) policies. While exports, construction and mortgages became alternative drivers of growth, all three trajectories have their downsides which surfaced post-2008 and make them inherently unstable.
1. Introduction
It is rarely fully appreciated that the end of the Keynesian growth era in the 1970s closely coincided with the end of the post-war cycle in housing construction, an industry important to economic growth but, with few exceptions, neglected by political economy. Keynesian demand management relied to a considerable extent on the state-based creation of demand through public works, i.e. infrastructure and (social) housing (see for instance Hillebrandt, 1974; Florida and Feldman, 1988). A host of studies point to the importance of these investments for economic growth (Nijkamp and Poot, 2004; Bon, 1992). Yet, the budget austerity measures of the 1970s and neoliberal housing ideologies put an end to supply subsidy approaches in housing (similar to other domains, cp. Helleiner, 1994). Thus, governments lost a key demand management and growth-producing instrument, but how did they compensate for the loss of this macroeconomic management tool and important pillar of their national growth models?
Concentrating on residential construction, this paper argues that the Keynesian construction state left a growth model void in Western Europe that was filled with three different trajectories on the construction side of the economy (see Table 1). First, some countries—often referred to as ‘export-led-economies’ (Johnston and Regan, 2016)—suppressed their domestic construction sector and focused on sectors active in the production of goods and services for export by means of price level management and curtailing domestic demand. As the export and construction sectors often require opposite and conflicting macroeconomic conditions, we find a negative cross-country association between the sizes of the two sectors, with mortgage-repressed Germany at one end. At the other end, a second group of countries embarked on a trajectory that relied more extensively on private mortgage credit to replace formerly state-led construction. While the extension of private mortgage credit is a general phenomenon, termed ‘privatised Keynesianism’, throughout all countries from the 1970s (Crouch, 2009; Streeck, 2013), this second group managed to stimulate a construction boom (Bielsa and Duarte, 2010) that even matched the peak of post-war reconstruction boom levels (Southern Europe, Ireland). A third group followed a more hybrid economic trajectory: mortgage credit equally exploded, but without producing significantly more housing output, leading only to housing price booms, such as in Sweden or the UK (Ryan-Collins, 2018). Here the consumption effect of more mortgages and higher asset prices produced growth effects (Wood and Stockhammer, 2020).
Typology of growth regimes by housing output, credit and export volumes
| Existence of a credit boom | |||
|---|---|---|---|
| Yes | No | ||
| Housing output (compared to 1970s) | Similar | Trajectory 2: demand-led, construction-boom economies (e.g. Spain, Portugal) | Keynesian, state-led construction state (point of origin) |
| lower | Trajectory 3 (hybrid-model): mortgage-boom economies (e.g. UK, Sweden) | Trajectory 1: export-led and construction-repressed economies (e.g. Germany, Switzerland) | |
Source: own table
While countries on all three trajectories could rely on one new source of growth (exports, construction, or mortgages), they all came with specific drawbacks which crystallised after the crisis of 2008 and laid bare their long-run unsustainability: construction-repressed countries tended to have housing shortages and domestic underconsumption while simultaneously producing international trade imbalances. The construction boom countries risked a diversion or misallocation of credit into the unproductive fostering of an asset price bubble combined with higher construction output volatility and deeper recessions (Martín et al., 2018). The mortgage boom countries, in turn, failed to produce a construction boom and inflate house prices to the level of unaffordability for first-time buyers (Di Maggio and Kermani, 2017). Recessions in these countries are exacerbated by financial crises which are more likely to originate in the overstretched mortgage markets (Jordà et al., 2016).
While there are different approaches to the origins of this divergence of trajectories, we argue in our discussion that policy feedback mechanisms reinforce pre-existing differences. For countries with high construction contributions to GDP, political parties tend to speak in favour of more infrastructure investment and housing construction, but against more free trade in their election manifestos. In export-led economies, by contrast, parties across the political spectrum are more likely to favour trade and export-oriented positions. These political reinforcement cycles might explain why a return to economic equilibria—international trade balance and non-inflated construction and mortgage sectors—may face political obstacles and why the different growth regimes are kept in place even when they appear less and less sustainable. One key contribution of this paper is to bring the ‘big construction’ sector to the attention of the traditionally manufacturing- and, more recently, finance-focused comparative political economy (CPE) literature (Aalbers and Christophers, 2014) and to thus add a construction sector story to the current debates about diverging models of economic growth.
First, we recount how the focus of political economy on the manufacturing sector largely forgot about construction, and outline what a political economy of this sector with its sectoral specificities and policies could look like. We then reconstruct how the Keynesian construction state transitioned into the era of dominantly private construction and mortgage credit and how countries diverged along the three different trajectories outlined above: construction-repressed, mortgage boom, and construction boom. We suggest in the discussion section that whatever the causes of countries’ initial divergence, political reinforcement cycles in the party systems help to explain the surprising persistence of different country trajectories. We conclude by making a case for taking the construction sector more seriously in future CPE work.
2. Construction: the industry political economy left behind
The construction industry has been studied extensively in business and management studies as well as in (macro)economics. In the former field, elements of process management (Segerstedt and Olofsson, 2010), skill development (Egbu, 2004), innovation management (Barrett et al., 2007), and studies on the special nature of the construction firm (Eccles, 1981) are at the core. This literature is generally geared towards a practice-oriented audience in the fields of corporate management and construction engineering. More academic in nature is the literature related to economics. This scholarship is interested in construction’s multiplier effects for the general economy and its relation to the business cycle movements and urban development (Hillebrandt, 2000; Bon, 1992; Bon and Pietroforte, 1990; Dlamini, 2011; Barras, 2009).
Parts of this literature recognise the difficulty of studying the construction sector. This challenge begins with capturing the scope of the sector and its components. In its broadest sense, the sector is about all construction trades. It entails the actual work of constructing a dwelling (structural, building, and underground engineering, i.e. main construction trade) as well as special construction (demolition, special works), maintenance services, facility management, carpentry, plumbing, electronic engineering, real estate services and construction-related manufacturing, i.e. the industrial prefabrication of construction products (steelworks, parts and tools) and machinery used for the construction sector. In its narrow sense, construction is synonymous solely with the main construction trade. The complexity of what the construction sector actually entails makes it difficult to fully appreciate its importance.
It is, therefore, understandable that political economy scholarship has not centred on construction but almost exclusively on manufacturing, often with a preferred focus on industries of the ‘steel age’. There are some exceptions to this rule, such as the analysis of the vocational training system (Busemeyer and Trampusch, 2011; Streeck, 1982), of labour relations and wage formation (Waddoups, 2014), and the endemic problem of corruption associated with the sector (Kyriacou et al., 2015). The different institutions of the construction labour market, with its seasonality, regional nature, capacity cycles, work accidents, specific wage-setting and welfare institutions, have received quite some attention (Bosch and Philips (eds), 2003). The difference in the organisation of the construction trades is seen as an important starting point for observations about a less regulated, informal on-the-job training system with less regulated wage-setting in Anglophone countries and the collective German vocational training system with more coordinated wage-setting (Doran, 1984; Bosch and Philips, 2003; Clarke et al., 2013). This is also associated with how dominantly prefabrication is used in construction (Bosch and Zühlke-Robinet, 2000; Kohl, 2017) Often, there is a dualisation of formal and informal labour markets within countries, which recent wage laws requiring location-specific minimum wages have set out to prevent in public works projects (Azari-Rad et al., 2002).
Moreover, it is difficult to disentangle the activities in the construction sector from one of its subsegments, which is the provision of housing. Interestingly, construction has not received much attention in the recent housing-related literature. This has rather focused on the role of housing for macroeconomic developments (Schwartz, 2009), for growth strategies and capitalist models (Johnston and Regan, 2017; Reisenbichler, 2020), for the process of financialisation and ‘house-price Keynesianism’ (Aalbers, 2015), as well as its implications for welfare and inequality (among the many recent contributions: Fuller et al., 2019; Schwartz and Seabrooke, 2008).
This is surprising considering the importance of construction in modern economies. Employment in broad construction in the EU-15 ranges from 8.3% of total employment in the UK to 22% in Luxembourg, averaging 9.6% across all countries (EU, 2020). Similarly, the share of gross value added of broad construction in 2015–17 ranged between 8.7% in Ireland and 19.7% in the UK and had an EU average of 16.9% (ibid.). However, if one looks only at construction in the narrow sense, the employment share is larger on average than its contribution to GDP, as the sector is labour-intensive. Residential construction alone made up 30% of gross capital formation on average, albeit with a demonstrated downward trend after the post-war reconstruction. In the EU-27, civil engineering accounted for 14% of total construction, the bulk of which is made up of non-residential (industry, commercial, etc.) and, predominantly, residential investments. Figure 1 summarises the total investment volumes of these segments since 1991 for three different European economies, showing broadly similar trends across both sectors. It also reveals that a considerable and at times even predominant share of both residential and non-residential is not new construction, but renovation. We focus mainly on residential construction in this study, as it makes up the largest share in the construction market, follows similar trends to other segments and is the best-researched sector. The strong public demand element in civil engineering moreover makes that segment very special, as it depends on public tenders, fiscal federalism, etc.
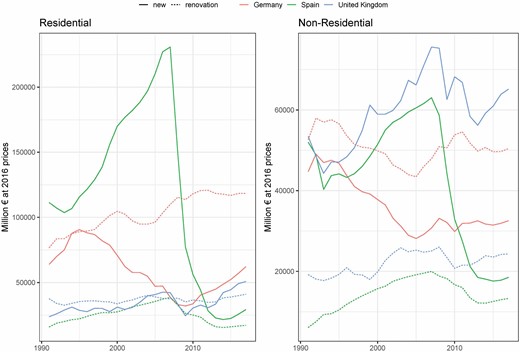
Residential and non-residential construction in major European economies.
Source: Euroconstruct1
In general, the construction sector, both in employment and in value-added, is a large segment of the economy, at around 40% on average of manufacturing, as displayed in Figure 2 for 42 world economies since 1950, drawing on the 10-sector database (de Vries et al., 2014). The Figure also shows that there generally is a positive initial association between the relative size of the manufacturing and construction sectors. Above a certain threshold of manufacturing share, however, there is again less construction share, as shown by the inverted-U line approximated by a loess function. A colouring of the scatterplot by three different countries of our typology reveals that this is again driven by the opposed Spanish and (West) German cases with the British in between. As the shares are part of a sum adding up to 100, not too much should be read into this first suggestion of a negative association (see further below).
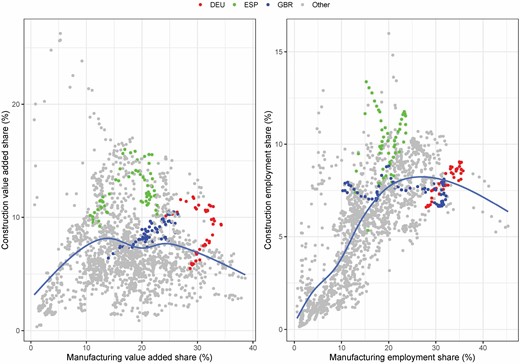
Value added and employment shares in construction and manufacturing.
Source: 10-sector database (de Vries et al., 2014).
Despite the general importance of the construction sector, there are several reasons for its general neglect in CPE. First, the construction sector has long been associated with low productivity and has hence been seen as a kind of pre-modern sector not characteristic of modern capitalism. Long-run studies of sectoral productivity growth confirm this view (Croizé, 2009). Second, the construction sector appears simply to be a service industry to other sectors: as these sectors create jobs and influence regional dynamics, the construction sector follows suit (Storper, 2013) but does not necessarily initiate these trends. Third, despite a national and perhaps even global synchronisation of house price cycles (Shiller, 2015), the construction markets, particularly residential ones, are still a phenomenon with strong regional anchoring. Even if some strands of CPE have a pronounced regional focus of analysis (Piore and Sabel, 1984; Herrigel, 2000), its predominant level of analysis is still the nation-state and its institutions, which is also reflected in the most commonly used databases. Fourth, since the 1980s, financial services and the knowledge-based economy have received increasing attention from CPE scholars, with the great exception of the revival of the old manufacturing-centric view in the varieties of capitalism approach (Hall and Soskice, 2001). When housing became a recent topic in CPE, it did so exclusively through its financial ties to mortgage finance, but mortgage finance has since decoupled from the construction sector of the real economy (Kohl, 2020; Ryan-Collins, 2021). There is hence reason to believe that housing finance alone is insufficient to understand the real construction activity.
A final reason for CPE’s construction sector blind spot lies in the implicit assumption of most CPE approaches that supply-side institutions explain most of the differences across countries. The construction sector, by contrast, is subject to the one institutional sphere in which governmental stimuli of aggregate demand play the most important role because governments create the largest single demand component of all construction industries. The recent shift to more demand-side approaches such as different national growth models (Baccaro and Pontusson, 2016), therefore, lays the basis for giving the construction sector as much weight in CPE analysis as its contribution to GDP, GDP growth, and macroeconomic demand steering would ask for. Currently, however, the growth model literature identifies export-led, finance-led, consumption-led, or state-led growth; the construction sector has only tangentially played a role through its close ties to mortgage finance (Reisenbichler, 2022; Baccaro and Pontusson, 2019).
3. Commonalities: the retreat of states from housing policy and the rise of mortgage credit
The twentieth century saw two major construction booms in which all Eastern and Western countries participated. Both the winners and losers of the World Wars had so much pent-up demand, in addition to the war destruction and long-term diversion of funds away from housing that some planners expected reconstruction to last for several generations. The reconstruction of infrastructure, and also housing, became an important government affair after World War II, even more so than after World War I, when countries’ housing policy repertoire and institutions first took shape (Pooley, 1992). Countries differed as to whether they preferred to give subsidised mortgages, mortgage guarantees, or deductions on interest payments to state companies and non-profit associations that built social rental housing or to private households for purchasing their own houses (Donnison, 1967). The results produced by these different policy pathways also differed: landlords and tenants of rent-capped flats in multi-storey buildings in the more continental European countries versus homeowners in detached family houses in the European periphery and English-speaking countries (Ball et al., 1988). Finally, the different subsidy structure shaped the structure of the building industry, with more large and national-scale private community builders in the US and non-profit housing builders and associations in Germany, and more concentrated public builders in France or Sweden (Barlow and Duncan, 1994; Blackwell, 2018). Extensive welfare states also tended to intervene more into the public provision of land and housing (Barlow and Duncan, 1994). On the housing finance side, deposit-based savings and loans financed housing in Anglophone countries, while mortgage bond-financed mortgage banks bankrolled much of European private construction (Blackwell and Kohl, 2018).
But beyond these differences there were undeniable commonalities: first, state-supported housing construction, through various kinds of national subsidy schemes, made up a considerable part of total housing construction (Harloe, 1995). Given the multi-layered forms that housing subsidies can take—direct loans, mortgage guarantees, tax exemptions—the overall monetary amount is difficult to assess, let alone in a comparative perspective. Beyond the state-influenced building share, some countries reported a state share in mortgage lending which could amount to more than 50% in post-WWII France or post-WWI New Zealand (Davidson, 1994), up to 40% in Germany’s two post-war eras (Blumenroth, 1975), and also up to 20% in Australia or Italy (Minelli, 2004) after the wars.
Second, housing constituted a significant part of the state’s demand management. Known for having strong employment effects even for unskilled labour, its multiplier and its inflation-absorbing effect, it became an important macroeconomic policy tool for fighting temporary recessions.2 Within Keynesian economics (Cooke, 1996), construction is classically mentioned for its multiplier effect. More than in other sectors, a dollar spent in construction is said to multiply into around 2.5 dollars in the broader economy and thus plays an important role both in business cycle smoothing and development policy (Wells, 1984). Third, builders of various types could rely on state-supported housing demand and thus produce in (prefabricated) bulk (for instance Fleming, 1988). Housing finance of whatever banking type was organised in specialised circuits, shielded from global capital market competition through interest regulation, international capital controls, and special licences (Boléat, 1985).
By the 1970s, all Western countries reached a peak of construction output, producing up to 15 new units per 1000 inhabitants, as displayed in Figure 3. In many countries, the notion of a housing surplus made a brief appearance, and the success of the large-scale post-war housing policies became the strongest argument against the traditional supply subsidy form and for its obsolescence. Budget austerity discussions during various crises in the 1970s (cp. Helleiner, 1994) made the highly visible state mortgage subsidies an easy target of expensive, bad paternalism; flexible housing allowances and the less visible individual fiscal exemptions moved housing policies from supply to demand subsidies and hence from public to private housing provision (Bourdieu, 2005). Centre-left parties discovered the homeowning median voter and entered into an ideological (and mortgage-promising) competition with conservative parties to win the favour of the homeowning constituency, to whichever more attractive mortgage arrangements were offered (Schelkle, 2012). As a result, private production of housing units became the dominant mode of housing production again in all countries (cf. Figure 3).
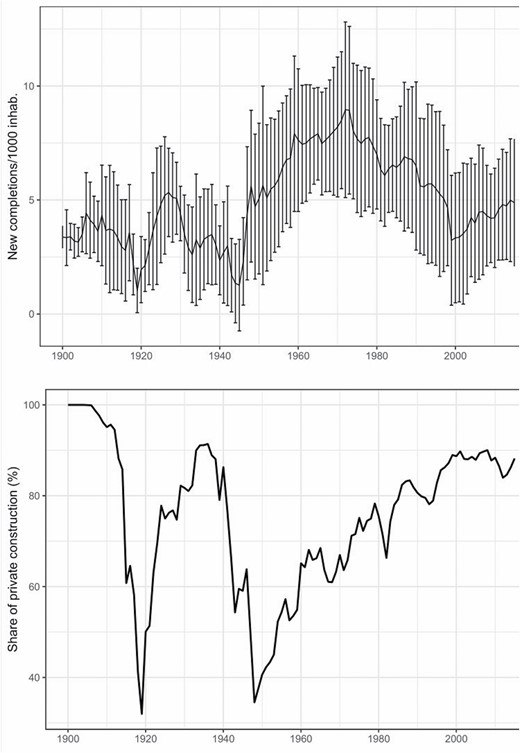
New housing units per population (above) and share of private production (below).
Source: Kohl (2020).
Third, non-profit housing builders with the traditional symbiosis between them and state housing subsidies ran into various problems—corruption scandals, growth-based organisations without growth, the loss of tax exemptions, and below-market rents while still being obliged to serve social functions (Harloe, 1995)—and diminished in importance. On the side of housing finance, inflation had eroded most capital controls and interest rate regulation, and commercial banks entered the mortgage market on account of decreasing returns in their traditional commercial loans business (Ball, 1990). What has been described as the ‘debt shift’ began to take shape: with the help of financial innovation (e.g. mortgage-backed securities), the banking sector made mortgage lending their dominant activity instead of business lending (Bezemer et al., 2017; Vinokurova, 2018).
4. The three divergent coping regimes: export, construction, and mortgage expansion
While these broad tendencies—end of the post-war construction cycle, less public housing and more private mortgages and construction—have been common to all countries examined here, the turn from states’ housing demand management to a homeownership-friendly private mortgage regime with an inclination towards private Keynesianism was by no means uniform in its timing and extent across countries. Figure 4 shows the divergence of countries’ construction economies along three central indicators: average housing construction output, household debt per income, and house price growth from 1980 up to the financial crisis. Generally, we observe the well-supported association between house prices and mortgage debt (Ryan-Collins, 2018): countries with growth in mortgage credit have also witnessed a stronger rise in real house prices, with most Southern European countries, Scandinavian and Anglophone countries participating in this trend, while Germany, Japan or Switzerland are not. This ‘financialised’ dimension of the housing sector differs from the size of the real housing sector which we approximate here through the housing unit output. While all countries showed lower output levels when compared to the post-war reconstruction boom (cf. Figure 3), some countries, particularly in Southern Europe (Italy excepted), have witnessed new construction booms, in contrast to Northern European countries. Note that countries with a boom in house prices and mortgage lending do not necessarily display a construction boom during the same period. Countries like Sweden, Denmark or the UK have been known for strong house price increases, high levels of mortgage debt, and still no construction boom like that of countries such as Ireland, Spain or Portugal.
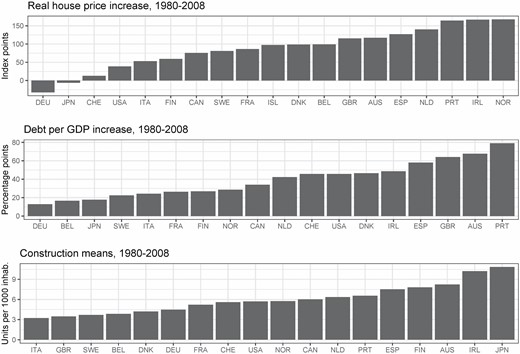
Housing price and mortgage growth and average construction, 1980–2008.
Source: House prices (Knoll et al., 2017); Debt: Bank of International Settlements, otherwise (Jordà et al., 2017); Construction (Kohl, 2020).
With the demise of the Keynesian construction state, European countries followed different trajectories which we try to capture along three dimensions—the ‘real’ domestic construction sector, the ‘financialised’ housing sector (mortgages, prices), and the export sector as counterpart to the domestic construction economy. We suggest three ideal-typical trajectories that countries followed: a construction-repressed export trajectory, a mortgage boom trajectory, and a construction boom trajectory (cf. Table 1 in the Introduction). While no country is a perfect realisation of any one ideal type, Germany, the UK and Spain are perhaps the best exemplifying cases for each type, respectively.3
The construction-repressed type can be observed best in Germany, where overall construction levels have been among the lowest compared to historical levels prior to 1980, while mortgage credit extension has not reached the levels of other countries. One reason is the strong degree of mortgage market regulation which has discouraged mortgage lending to households (Kofner, 2014). On a mortgage regulation scale of the 2000s, based inter alia on loan-to-value ratios and interest rate flexibility (Fuller, 2015), Germany scores among the most conservative countries. One ideational reason is that Social Democrats have been less eager than their counterparts in other countries to promote homeownership and the accompanying extension of mortgages, as comparative historical analyses of homeownership content in party manifestos since 1945 reveal (Kohl, 2018). As households do not necessarily have to buy and take on debt to live somewhere, the demand for mortgage credit is not as inelastic as in high-homeownership countries. The politically sensitive rent prices, in turn, have a constraining effect on house price developments and could counteract spiralling house prices and mortgage credit (Rünstler, 2016).
A more structural reason for the construction repression, we argue, lies in the incompatibility of a strong export economy and export-based growth model with an oversized construction and domestic mortgage sector (Reisenbichler, 2016). Instead of relying on a privatised construction sector as an engine for growth, Germany instead turned to serving export demand (Nölke, 2021). The negative relationship between the two alternatives can be both empirically and theoretically motivated. Empirically, this is reflected in a negative correlation between the Fuller’s mortgage encouragement index and the export orientation (Fuller, 2019). More mortgage-repressed countries display higher levels of exports to imports on average in the years before 2008. What is more, we find a growing realignment of countries along a negative trade-off relationship between their export orientation and the size of their construction sector (Figure 5).
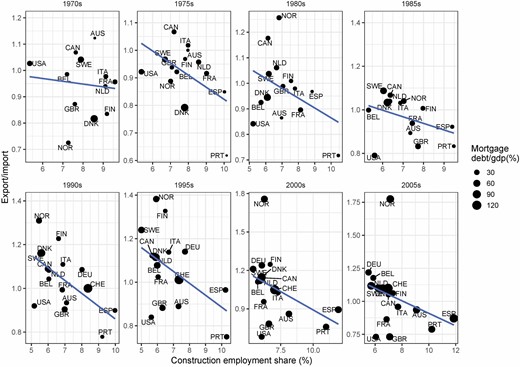
Export- and construction-centredness of economies (5-year averages).
Note: Data from OECD Stan for employment and Macrohistory for exports/mortgages.
This purely visual bifurcation into either the domestic construction or the foreign exports direction can be corroborated by a number of different measures. This is important to show, as we interpret the negative association to be more than the zero-sum logic that holds between domestic and foreign components of GDP. We, therefore, make use of four different proxies for the importance of the construction activity other than its value-added to GDP, namely the employment share in construction, the housing unit completions by 1000 population and the share of residential as well as non-residential investment to GDP, using OECD, Macrohistory (Jordà et al., 2017) and housing construction data (Kohl, 2020), respectively. We regress these on two different operationalisations of export-centredness, namely the ratio of exports to imports used above and the current account to GDP. Both measures have the advantage that they do not measure international exposure of an economy (which would be better proxied by exports and imports over GDP), but rather the export-centredness of the economy. Due to non-stationary variables, we use first difference OLS regressions including fixed effects and reporting robust standard errors. Fixed effect regressions using variables’ levels instead of differences show similar results. Table 2 reports these results for both dependent variables: all four construction-related variables show statistically significant negative associations with the export-centredness variables. Note that the negative association also holds for the non-residential sector of civil engineering.
Construction sector, current account and export-import ratio post-1970 (OLS first-differences)
| Current account | Export-import ratio | |||||||
|---|---|---|---|---|---|---|---|---|
| (1) | (2) | (3) | (4) | (5) | (6) | (7) | (8) | |
| Construction | –1.331*** | –0.040*** | ||||||
| Employment | (0.228) | (0.009) | ||||||
| Residential | –0.964** | –0.041*** | ||||||
| Investment/GDP | (0.294) | (0.011) | ||||||
| Housing | –0.328*** | –0.013*** | ||||||
| Completions/pop | (0.071) | (0.003) | ||||||
| Non-resident. | –0.641*** | –0.028*** | ||||||
| Investment/GDP | (0.181) | (0.008) | ||||||
| Constant | –0.009 | 0.016 | –0.716 | 0.003 | 0.001 | 0.001 | 0.065*** | 0.0001 |
| (0.029) | (0.024) | (0.642) | (0.024) | (0.002) | (0.001) | (0.019) | (0.001) | |
| Observations | 693 | 782 | 809 | 782 | 693 | 782 | 809 | 782 |
| R2 | 0.182 | 0.170 | 0.139 | 0.241 | 0.185 | 0.187 | 0.147 | 0.280 |
| Adjusted R2 | 0.127 | 0.118 | 0.087 | 0.194 | 0.129 | 0.137 | 0.096 | 0.235 |
| F Statistic | 3.287*** (df = 44; 648) | 3.269*** (df = 46; 735) | 2.672*** (df = 46; 762) | 5.078*** (df = 46; 735) | 3.339*** (df = 44; 648) | 3.684*** (df = 46; 735) | 2.856*** (df = 46; 762) | 6.225*** (df = 46; 735) |
Note:*p < 0.05; **p < 0.01; ***p < 0.001, robust standard errors
Theoretically, the negative association could be explained with reference to the growth model literature (Baccaro and Tober, 2021): export and construction sector(s) build on different macroeconomic environments to thrive. Notably, the export sector works well with a moderate development of bank business loans and housing costs of living, as well as a stable real exchange rate (or, even better, a depreciating real exchange rate) so as not to drive export goods prices to non-competitive levels. The construction sector requirements are often inverted: moderate inflation is welcome as it helps to absorb high mortgage debt in real terms. Real wage developments are also different. Export sectors—depending on the price elasticity, the nature of the good and the production chain—depend on a comparatively moderate-to-low increase of wages within its sectors (for price competitiveness) and across the entire economy (to prevent wage inflation and adverse macroeconomic policy responses). The construction sector (at least in regard to private consumption of construction goods) depends on rising purchasing power and income levels of consumers able to afford a new home or the refurbishment of an existing structure (Johnston and Regan, 2017).
The two segments of the economy are, of course, nowhere perfect substitutes and hence their association is far from a perfectly negative correlation: to build more export capacity, a country obviously needs to expand infrastructure and housing, and a booming construction (services) sector can itself stimulate international trade, not least when exporting high-end construction services. It is no coincidence that there is an initially positive association of manufacturing and construction in economies (cf. Figure 2) and that the negative association between non-residential investment and exports is weaker than the one for residential investment. Or reversely, if certain infrastructural investments are disincentivised, such as has been the case through tax reforms in Germany in the 2000s (Horn et al., 2017), this can also dampen export capacity. Still, in the post-1970 worlds we do find a stable negative association on average across all countries. In general, a lack of infrastructure investment could as well be an unintended consequence of a national fiscal policy; especially in times of austerity. However, if such an underinvestment persists (e.g. if renovations are postponed beyond the recommended life cycles) and if negative consequences for the construction sector are accepted over long periods of time, then such developments could as well be seen as implicit political action reinforcing the trade-off between the two sectors in the economy.
After the Global Financial Crisis, the unsustainability of the construction-repressed trajectory become clearly visible, as housing and infrastructural investment gaps became hard to ignore domestically and the export-centredness caused global imbalances. The German housing and construction market profited extraordinarily from conditions created during the Euro-crisis: the reversal of formerly structural capital outflows into the direction of the domestic German economy, interest rates plummeted across the Eurozone, and additional, investable capital was created by the ECB through quantitative easing programs (Deutsche Bundesbank, 2017). It fuelled both the construction of significant amounts of additional buildings as well as the rise of rent prices in urban areas (Voigtländer et al., 2017).
Yet, macroeconomic authorities such as the Bundesbank immediately demanded action by the federal government to counteract the ‘housing bubble’, which they perceived as ultimately inflationary (Gornig and Michelsen, 2017; Deutsche Bundesbank, 2017). Nevertheless, there has been a construction boom by contemporary German standards, which led the construction sector to operate recently at full capacity (ibid.). However, as its size has shrunk to about 40% of the size in 1995 by 2007 (Statistisches Bundesamt (Destatis), 2019), the German construction sector itself has been unable to serve the additional demand for construction products in recent years. In consequence, the German market has been absorbing significant construction capacities from its East and Southeast European neighbours (European Commission, 2018). Thus, qualitatively, the current boom represents the second time since the reunification that a construction boom was created in consequence of extraordinary macroeconomic conditions and not of political choice of a national government. It also shows clear cracks in the construction-repressed export regime and its unsustainability in the long-run.
A second trajectory is probably best described by the Spanish case and Southern Europe (except Italy) more generally, where the extension of private mortgage credit coincided with an unprecedented boom in construction. Often laggards in urban development, these countries saw mortgage credit as the solution to simultaneously modernising their cities and their economies (Vaz, 2013). Very liberal or lax land regulations are part of the dominant politics. Up to the bust, the construction growth strategy seemed to work as the countries witnessed long and steady periods of high growth rates and low unemployment. The housing, infrastructural and touristic investments kept the entire economy running (Buendía, 2018). Even before the bust, however, the risk emerged that relying on the low-productivity construction sector for growth could come at the cost of diverting credit from more productive uses in the business sector.4 Nevertheless, countries on this second trajectory have to create a macroeconomic environment conducive to construction activity, which entails pumping consumers and producers with high volumes of liquidity to spend for these domestic goods.
After the bust, another downside of excessively relying on the construction sector as a growth engine became visible, as business cycle downturns were longer and deeper if they had been fuelled by burst mortgage and housing bubbles (Jordà et al., 2015). As historically documented (Stolzenberg, 1957), recessions are longer and deeper if they are preceded by the downturn of an overheated construction sector. The higher amplitude of the construction cycle must then be paid for with deeper troughs. As a by-product, the construction boom countries are left with a significantly higher share of surplus units in their housing stock, approximated by the vacancy and the secondary housing rates (Hoekstra and Vakili‐Zad, 2011; Gentili and Hoekstra, 2018).
In a third trajectory, the extension of mortgage credit reaches levels at times as high as those of the construction boom countries, but it does not translate proportionately into new construction or new housing investment. In these countries, like the UK, Sweden or Norway, the effect of rising housing wealth on the propensity to consume is particularly high and thus adds to consumption-driven growth (Catte et al., 2004, Baccaro and Pontusson, 2016), but overall growth is not produced by a growing construction sector. The additional mortgage investments rather inflate house prices in the existing housing stock and are not (or not substantially) channelled into new construction. The UK has previously been referred to as the ‘finance and real-estate-driven’ growth regime (Hofman and Aalbers, 2019), while we find it important to draw a clear line between this ‘housing finance’-driven type from the previous ‘real estate’-driven type. By any non-financial measure, such as construction employment, cement use in production, working hours or, as above, housing output, countries like the UK score much lower than countries experiencing a real construction boom and relying on real housing production as a growth model. Countries like the UK, by contrast, do rely on the housing sector, but more through the channel between mortgage credit and consumption; parties in this country are more concerned with providing buyers with access to credit than directly creating more housing supply (cf. Fuller, 2019).
Whereas the construction boom countries had already been high-homeownership countries, such as in Southern Europe after the dictatorships, the mortgage boom countries used the extension of mortgage lending to bring more tenants into homeownership, passing the 50% homeowner threshold in the later twentieth century. The conversion of tenure did not necessarily require an extension of the housing stock through new production. In the UK, the sale of council houses in Thatcher’s right-to-buy scheme reflected such a state-supported conversion programme (Lowe et al., 2011), whereas in Sweden or Norway the conversion of private rental apartments into owner cooperatives and the liberalisation of sales prices for shares in owner cooperatives both increased prices and mortgage indebtedness without new units being constructed (Turner, 1997). The unsustainability of this growth trajectory is revealed by the combination of housing shortages and high mortgage indebtedness, which make housing less and less affordable to the new generation.
5. Discussion: why divergence? A policy feedback explanation
After the end of the post-war reconstruction boom in the late 1970s, Western countries entered different trajectories along the dimensions of domestic finance, construction, and export orientation of their economies. But why did countries enter these different tracks and what ultimately kept them on them? In this discussion, we will present alternative accounts about the origins of the trifurcation and a more robust analysis of potential political mechanisms which reinforced the trajectories. One can broadly distinguish two accounts of where the different trajectories come from: first, the historical institutionalist continuity account, and second, a discontinuity account that emphasises exogenous and more contemporary factors.
The first account emphasises continuity. The crisis of the 1970s did not create a tabula rasa of new policy opportunities, but rather refocused countries on the relative strengths and trajectories established by earlier institutional choices. For the German export-led model, for instance, Höpner sees its origins already inscribed in the post-1945 ‘undervaluation regime’ that was particularly defended by the Bundesbank (Höpner, 2019). Others have argued that the export orientation dates back even further, with the two post-war reparation payment regimes acting as important external pressure, rather than self-chosen paths (Feldman, 1993; Abelshauser, 1982). In consequence, the longevity of the German tendency to rent rather than buy might be the implicit result of a specific, export-led growth model that created lasting network effects across the economy (Höpner, 2018) and thus persistent and coherent policy structures (see more generally Blyth and Matthijs, 2017).
The US-specificity of credit-driven private demand-led growth, by contrast, has been traced back to the populist demands of American farmers (and later steel manufacturers) to find markets for their increasing overproduction in the nineteenth century (Prasad, 2012; Frieden, 2015). In the twentieth century, the extension of a government-backed farm and then house mortgage system during WWI, the Great Depression, and the post-1945 era with the Federal Loan Guarantee System meant a continuity that stretched to the latest mortgage securitisation wave. The Spanish inward orientation of the economy, in turn, has been traced back to Franco’s policies which were first directed at autarchy and then at promoting residential construction for private homeownership and tourism (Vaz, 2013). They were a deliberate desarrollismo effort to modernise the country through these economic sectors and simultaneously produced consumption and tourist investment goods for middle classes to support the regime (Di Feliciantonio and Aalbers, 2018). But even after the dictatorship, this orientation of the economy was prolonged: ‘The Partido Socialista Obrero Español (PSOE), in power continuously under Felipe González from 1982–96, had no alternative model to propose’ (López and Rodríguez, 2011). Eichengreen makes a more general case for Southern European economies: lacking coordinated wage-setting institutions, these economies had been subject ever since 1945 to wage-led inflation pressures incompatible with an export-led growth strategy (Eichengreen, 1996). A story of institutional continuity could thus be defended for probably every growth model, even though a theoretical generalisation is still lacking.
The second set of accounts, by contrast, emphasises discontinuity. Whatever the institutional setup until the 1970s, important changes after this date changed the rules of the game and help explain the different trajectories (Blyth, 2015; Baccaro and Howell, 2011). Not historical pressures, but more contemporary structures force countries to go down different roads. One such account sees the fall of the Berlin Wall, German unification and the opening of Eastern European markets as an important difference-maker. Particularly, Germany saw an asynchronous construction boom and then a long decline, whereas all other Western European countries went through the cycle in reverse order. Another account emphasises the differential impact that the currency area shock had on the different euro economies (Armingeon and Baccaro, 2012, 2015). In that view, the pre-2007 euro was undervalued for the European South, where it led to a public and private debt explosion, but was overvalued from the perspective of Germany, where a recession followed. After 2007 and up to the current day, this picture has been reversed.
Both broad accounts have in common that structural and ideational pressures, either from the past or present, predetermine the general course of the countries’ trajectories. In line with the growth model approach, we put emphasis on the importance of political coalitions or social blocks (Amable, 2017; Baccaro and Pontusson, 2016) in determining the trajectory a country eventually ends up on. It is, of course, very difficult to establish which of the two came first, the structure of an economy or the interest groups and political parties tied to that structure. But disregarding the difficult question of the precise historical origins of the observed trajectories, we claim that these political coalitions are an important feedback mechanism for making the divergence a lasting one and for explaining why, after 2008, countries struggled to alter their trajectory even despite obvious signs of its unsustainability. Concretely, we would therefore expect economies with a high share of construction to have political parties that are more likely to defend the interests of a construction-based economy and not those of an export-led economy. Vice versa, we would expect an export-led economy to have political parties in its defence.
To see whether the construction- or export-centredness of an economy is associated with its policies in a more formal, multivariate OLS regression framework, we draw on the Party Manifesto Project (CMP; OECD countries post-1970), which provides manual content codes for the salience political parties attribute to economic protectionism against free trade.5 We use the relative frequency of quasi-sentences6 containing this content in manifestos as a proxy for how well disposed towards exports a party manifesto is. These 56 categories are precoded according to a coding scheme, documented by the Manifesto Project, and widely used in political science.7 To operationalise the preference for the construction sector, in turn, we rely on two different proxy measures in party manifestos. First, we use the salience which manifestos attributed to infrastructure investments. This code contains preferences for the construction of more roads and bridges, but also for public spending on technological infrastructure. Second, we draw on an additional binary coding of manifestos from 19 countries to see whether they mention housing construction policies in any significant way or not (Kohl, 2018).
We use these export and construction preferences as three dependent variables. As main independent variables we use the importance of exports and construction in the economies, notably, the export share and the construction share in relation to the GDP (Teorell et al., 2016).8 As our main independent variable we use the party families across countries, as most party positions have a strong ideological component. This is a CMP grouping of parties into ten different types which broadly reflect their ideological orientation. We also control for country fixed effects, as there could be country-specific background factors that make certain political issues more salient in general. We also use year fixed effects, as salience to political issues obviously has an election time dimension. We moreover control for GDP (Teorell et al., 2016). Countries with more construction catch-up and demand could also be driven to mention it more often, which is why we also control for population growth and births. For robustness, we estimate an alternative model with countries’ initial construction employment share as alternative country fixed effect (methodologically following Brady et al. (2016)) to see whether initial construction importance mattered for salience. As second alternative model, we estimate a multi-level model with manifestos nested in countries, party families and years (Supplementary Appendix).
The regression in Table 3 column 1 shows a negative statistically significant effect of the export share in GDP on the salience of parties’ pro protectionism for the post-1970s OECD countries. By contrast, the effect of the construction share is significantly positive. The larger the construction sector figures in an economy, the more party manifesto content is in favour of economic protectionism. This association is robust over time, as time dummies are controlled for. A look at the country fixed effects (not shown) reveals that, in comparison to Germany, only the English-speaking countries have significantly higher levels of anti-protectionism positions across parties. These country effects on trade policy preferences exist in parallel to a certain right-left divide towards trade: in comparison to parties of the social-democratic family (reference category), nationalist parties are even more protectionist, and socialist parties are similar, whereas conservatives and market liberals have a weaker preference for protectionism. The structural effect of sector size thus does not completely hollow out political party competition over the issue.
OLS and logistic regression on party-manifesto salience on trade, infrastructure and housing post 1970
| Pro protectionism | Pro infrastructure | Pro housing | |
|---|---|---|---|
| Construction share | 0.067*** (0.020) | 0.424*** (0.091) | 0.258*** (0.073) |
| Export share | –0.008*** (0.001) | 0.028*** (0.005) | 0.004 (0.006) |
| Socialist parties (ref. Socialdem.) | –0.007 (0.074) | –1.957*** (0.307) | 0.219 (0.320) |
| Ecological parties | –0.083 (0.071) | –1.118** (0.398) | –1.813*** (0.340) |
| Liberal parties | –0.163** (0.058) | –0.232 (0.393) | –0.950*** (0.275) |
| Christian democratic parties | –0.026 (0.068) | –0.425 (0.341) | –0.698* (0.290) |
| Conservative parties | –0.212** (0.076) | –0.062 (0.339) | –0.632* (0.293) |
| Nationalist parties | 0.670* (0.291) | –1.623** (0.508) | –0.957* (0.398) |
| Agrarian parties | 0.211 (0.147) | 1.002 (0.729) | –0.899* (0.366) |
| Ethnic and regional parties | 0.028 (0.112) | –0.804 (0.453) | –1.424*** (0.390) |
| Special issue parties | 0.017 (0.116) | –1.754*** (0.442) | –0.911* (0.424) |
| GDP p.c. | 0.253 (0.080) | 2.837*** (0.305) | 0.339 (0.408) |
| Population growth | 0.171 (1.884) | –20.381* (9.158) | 22.670* (10.016) |
| Birth rates | –0.008 (0.006) | 0.183*** (0.025) | –0.056 (0.040) |
| Constant | 14.745 (7.777) | 99.840** (31.750) | 70.164 (38.009) |
| Fixed Effects | Country/Period | Country/Period | Country/Period |
| Observations | 1,507 | 1,507 | 967 |
| R2 | 0.173 | 0.254 | |
| Adjusted R2 | 0.147 | 0.231 | |
| Log Likelihood | –461.364 | ||
| Akaike Inf. Crit. | 990.729 | ||
| Residual Std. Error (df = 1460) | 0.885 | 3.587 | |
| F Statistic (df = 46; 1460) | 6.626*** | 10.821*** |
Note: *p < 0.05; **p < 0.01; ***p < 0.001, robust standard errors
A similar regression on parties’ preference for infrastructure (column 2 in Table 3), in turn, also shows a significant positive impact of a country’s construction share in GDP, whereas the export share remains statistically insignificant. Over time, there is an increasing tendency for parties to favour infrastructure investments (not shown). Within regimes, however, there is also a party divide between the centre parties, regardless of whether on the left or right, which are more in favour than the smaller and peripheral parties. Relative to Germany, most other countries mention infrastructure less favourably, with no clear country pattern otherwise. The presence of housing as a dependent binary variable in column 3 (Table 3) confirms the significant positive effect of a real construction share in the economy on political preferences: the higher its share, the more political party manifestos are likely to mention housing. Contrary to investment preferences, however, where the political centre agrees when compared to more radical parties, housing is marked by a clear left-right divide comparable to other welfare domains.9 The regression results hold when using multi-level models nesting manifestos in country-years and when using the logarithmised total of sentences rather than their relative share.10 They become much stronger even when using the initial value of construction employment as alternative country fixed effect.
From this analysis, we conclude that the preferences expressed for exports or construction in manifestos depend on country-specific factors as well as the ideological orientations of political parties, and less so on specific time periods or the business cycle. Controlled for these factors, however, countries’ structural features in the economy, i.e. their reliance on exports or construction investment, leave an important imprint on what political manifestos defend, even beyond their party-political orientation. We need to refrain from reading these effects in any causal way, but they are indicative of an elective affinity between the structural dominance of either the export or the domestic construction sector in the economy and the general orientation of political attention in the respective democracies. They help to explain why parties change political course only slowly, even when the growth trajectory starts to show signs of unsustainability.
6. Conclusion
In this paper, we have argued that the Keynesian construction state transitioned into a trifurcation of more privatised housing regimes from the 1970s until 2008: a construction-repressed regime, a construction boom regime, and a mortgage boom regime. They all offer different alternatives of how to grow in times of retreating state housing investment: either through exports, through privatised construction activities, or through the consumption effect of higher housing asset prices. While this paper has not provided evidence for specific growth effects of exports, construction, and mortgage credit expansions itself, a host of studies have already empirically supported the positive effects of trade and exports on growth (Frankel and Romer, 1999), of (state) construction investment on growth (Green, 1997; Giang and Sui Pheng, 2011), and of mortgage asset price effects on growth via the consumption channel (Catte et al., 2004).
Substituting the Keynesian construction state with more privatised construction regimes is ultimately unsustainable and comes at a cost for all regimes. Countries experience an ‘Anna-Karenina effect’ (Diamond, 1997): they each become unhappy in their own way, as is visible mostly after 2008. Both the construction-repressed as well as the mortgage boom countries are faced with potential housing shortages, the latter with additional serious housing affordability problems and resulting urban inequalities. In these countries, homeownership rates have been decreasing after the crisis, and the class and intergenerational cleavage lines of housing market insiders versus outsiders have surfaced in national politics. In these countries, financial instability is more likely to be a problem, whereas, in the construction-repressed countries, the strong reliance on exports to the detriment of domestic consumption (most importantly of housing construction) causes international current account imbalances. Capital inflow, low interest rates and housing shortages have moreover started to produce a house price boom after the crisis, in contrast to most other countries. The construction boom countries, in their turn, rather face a housing surplus problem that inhibits the former growth engine, new housing construction, and contributes disproportionately to rising unemployment and deepening recessions.
Where do these different regimes actually come from? Rather than siding with either the historical continuity or the discontinuity account, we suggested that the strategies of political parties and their coalitions differ systematically depending on a country’s economic structure, once it is set on a certain trajectory. Thus, we found conditional associations between the size of the export and the construction sector in an economy and the likelihood of parties of all colours defending trade and infrastructure/housing investments, respectively. Beyond structural effects, trade and housing follow a right-left partisan logic and infrastructure a centre-radical logic.
However, the three coping regimes are not completely locked in and ever since the disruptions of the Global Financial Crisis, the unsustainable features of the regimes have become too visible to ignore. We rather suggest that these regimes are stable in providing growth as long as suitable macroeconomic environments can be maintained by national politics. Similar to the extraordinary circumstances that led to the demise of the Keynesian construction state in the 1970s, current developments point in this direction. Among those developments are pressures in the Eurozone on Southern European economies to export more, and for Germany to spend more domestically including on its rising house prices, as well as structural changes emanating from climate change and new energy policies. Moreover, in certain historical moments, countries like Japan have had both booming exports and booming construction. Construction cycles generally have large amplitudes, therefore the persistent trade-off between exports and domestic construction we found, might hold over the cycle of past decades, but not necessarily future ones anymore. It also might be stronger during some subperiods of construction cycles, e.g. the boom period, rather than others, as the construction downturn might be more intensive than a reduction of exports. Therefore, we have to account for both contingency and the possibility of change in the development and maintenance of coping regimes and the trade-off between exports and construction.
Overall, we argue for taking the political economy of the construction sector more seriously, as it does not seem to be easily reducible to sectoral logics found in manufacturing or to another variant of purely finance-driven growth, as presumed in recent contributions. It also is a sector that would merit a closer investigation at regional growth regimes: much as industrial regions can be the pertinent unit of analysis (Piore and Sabel, 1984; Herrigel, 2000), housing and construction markets have a clearly regional scope. While it is not the only sector important in the economy and for growth, it is certainly a central one, and its problems have the potential to spill over into the broader society and economy, important for the study of consequences of European heterogeneity.
Footnotes
The authors thank the ifo-Institute for making these data available.
In the economic historiography of each country, one finds mentions of how construction was used to steer countries out of recession, e.g. for Germany (Abelshauser, 2004), for Sweden (Rostow, 1960, Magnusson, 2000, Bohlin, 2014), for the US (Radford 1996), for Japan (Kerr, 2001), for France (Rosanvallon, 1989), for the UK (Ball and Wood, 1996), and more generally (Harris and Arku, 2006).
Yet, there are countries that are at odds with the trifurcate trajectory analysis. For instance, the Netherlands displays both export-led growth as well as a state-sponsored mortgage explosion. Moreover, Italy has neither a construction nor an export or mortgage boom but resembles what Baccaro and Pontusson (2016) refers to as a ‘no-growth-model’ case. Whereas the former has created a business model that runs on special services in exports and capital imports that have positive effects on domestic lending and thus represents a very special case, the latter has a pathological growth crisis that comes from ineffective fiscal policy institutions and negative effects of the euro currency regime.
See Chakraborty et al. (2018) for micro-evidence of this crowding-out of business by mortgage credit.
The codebook reads: ‘support for the concept of free trade and open markets. Call for abolishing all means of market protection’ (Volkens et al., 2011).
The smallest part of a sentence conveys a political meaning.
See all publications using this data source here: https://manifesto-project.wzb.eu/publications/all.
Alternatively, we could also use the construction employment share in total employment, as one motivation for the infrastructure preference lies in the employment effect. The two measures are, however, quite strongly correlated (> 0.9) and employment data are rather sketchy.
Although the preference for homeownership is more prevalent among conservative parties (Kohl, 2018).
The share is a limited dependent variable that is still predominantly used in party manifesto research, as many items follow a normal distribution.
Bibliography
---.
